Simplified Operations
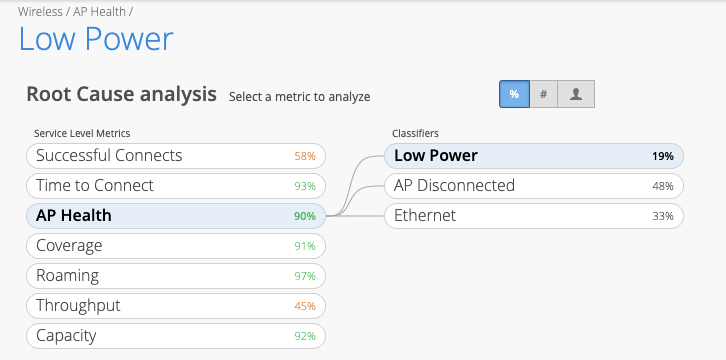
AP Health SLE
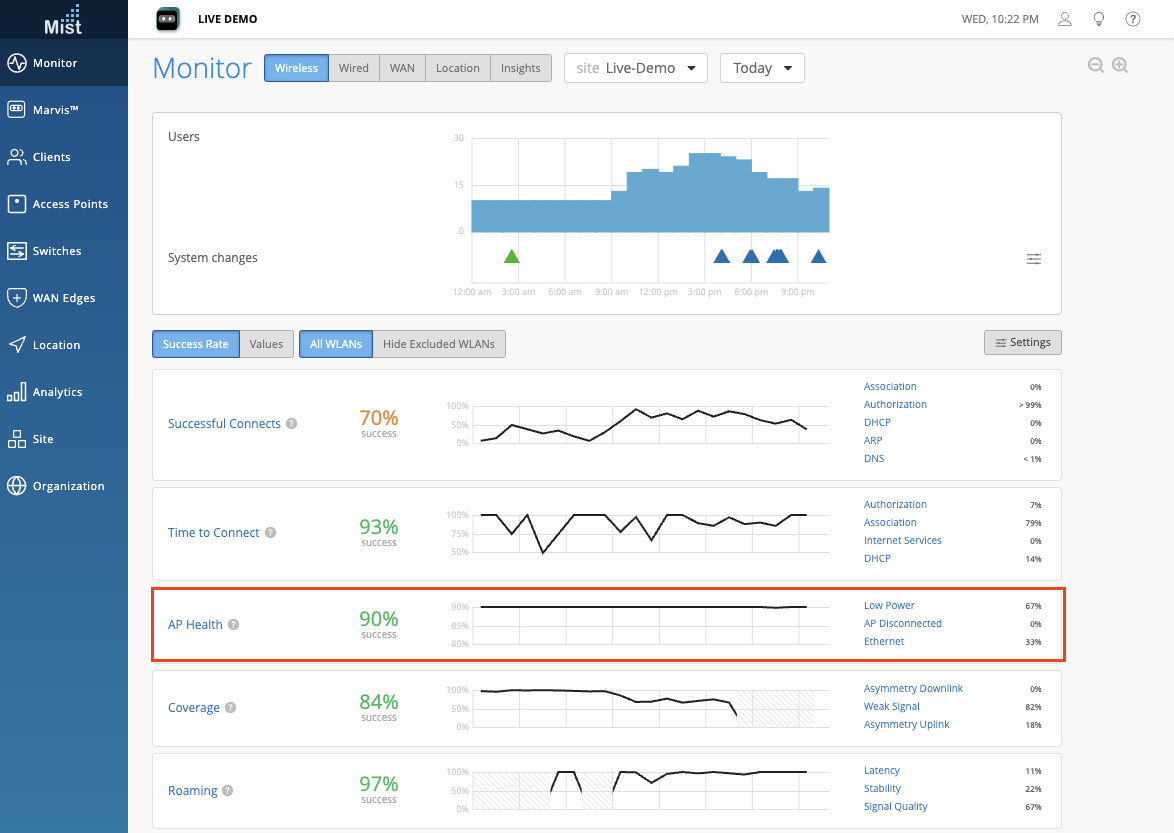
We are replacing the old AP Uptime WiFi Service Level metric with AP Health, which supports new and recategorized classifiers and sub-classifiers.
Low Power
AP Disconnected
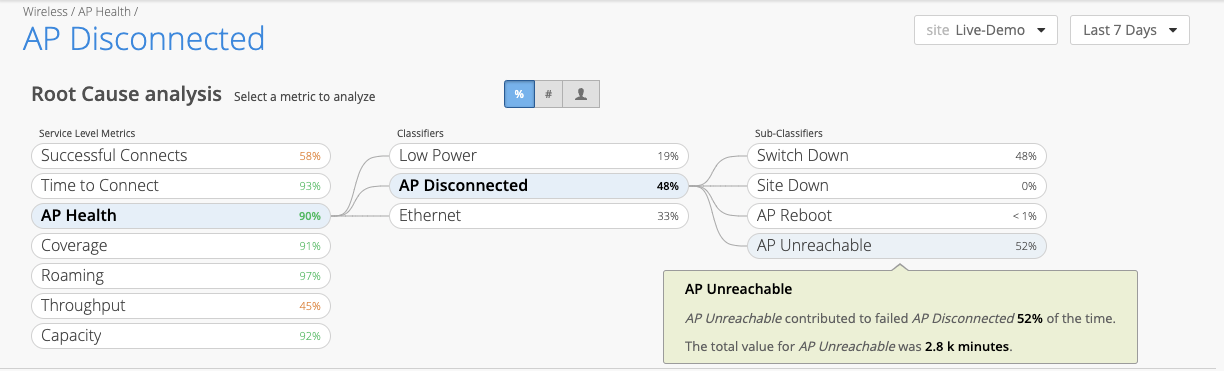
This is further divided into the following Sub-Classifiers:
- AP Unreachable
- Site Down
- Switch Down
- AP Reboot
Ethernet
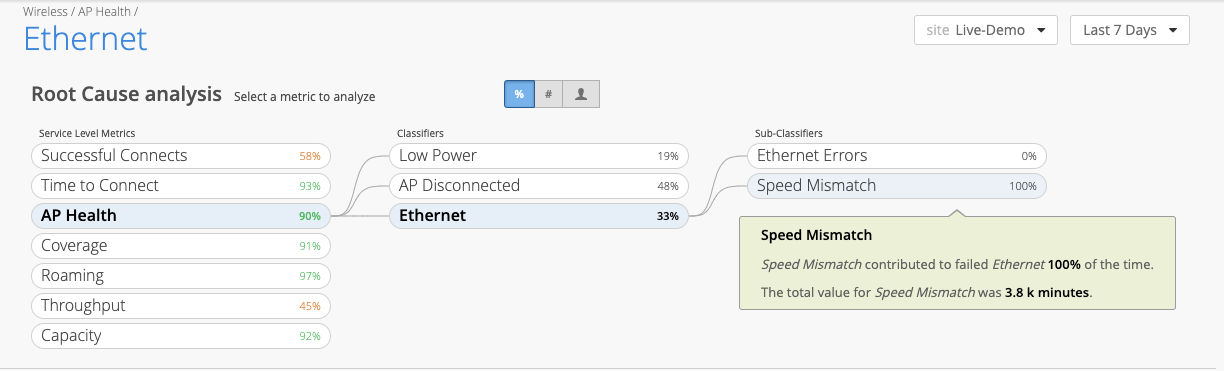
This is further divided into the following Sub-Classifiers:
- Speed Mismatch
- Ethernet Errors
Keep in mind that the new SLE metric name in the API is “ap-health”. The old SLE metric name “ap-availability” will be deprecated in a future release; any scripts using the old metric name should be updated as soon as possible.
MSP tiers
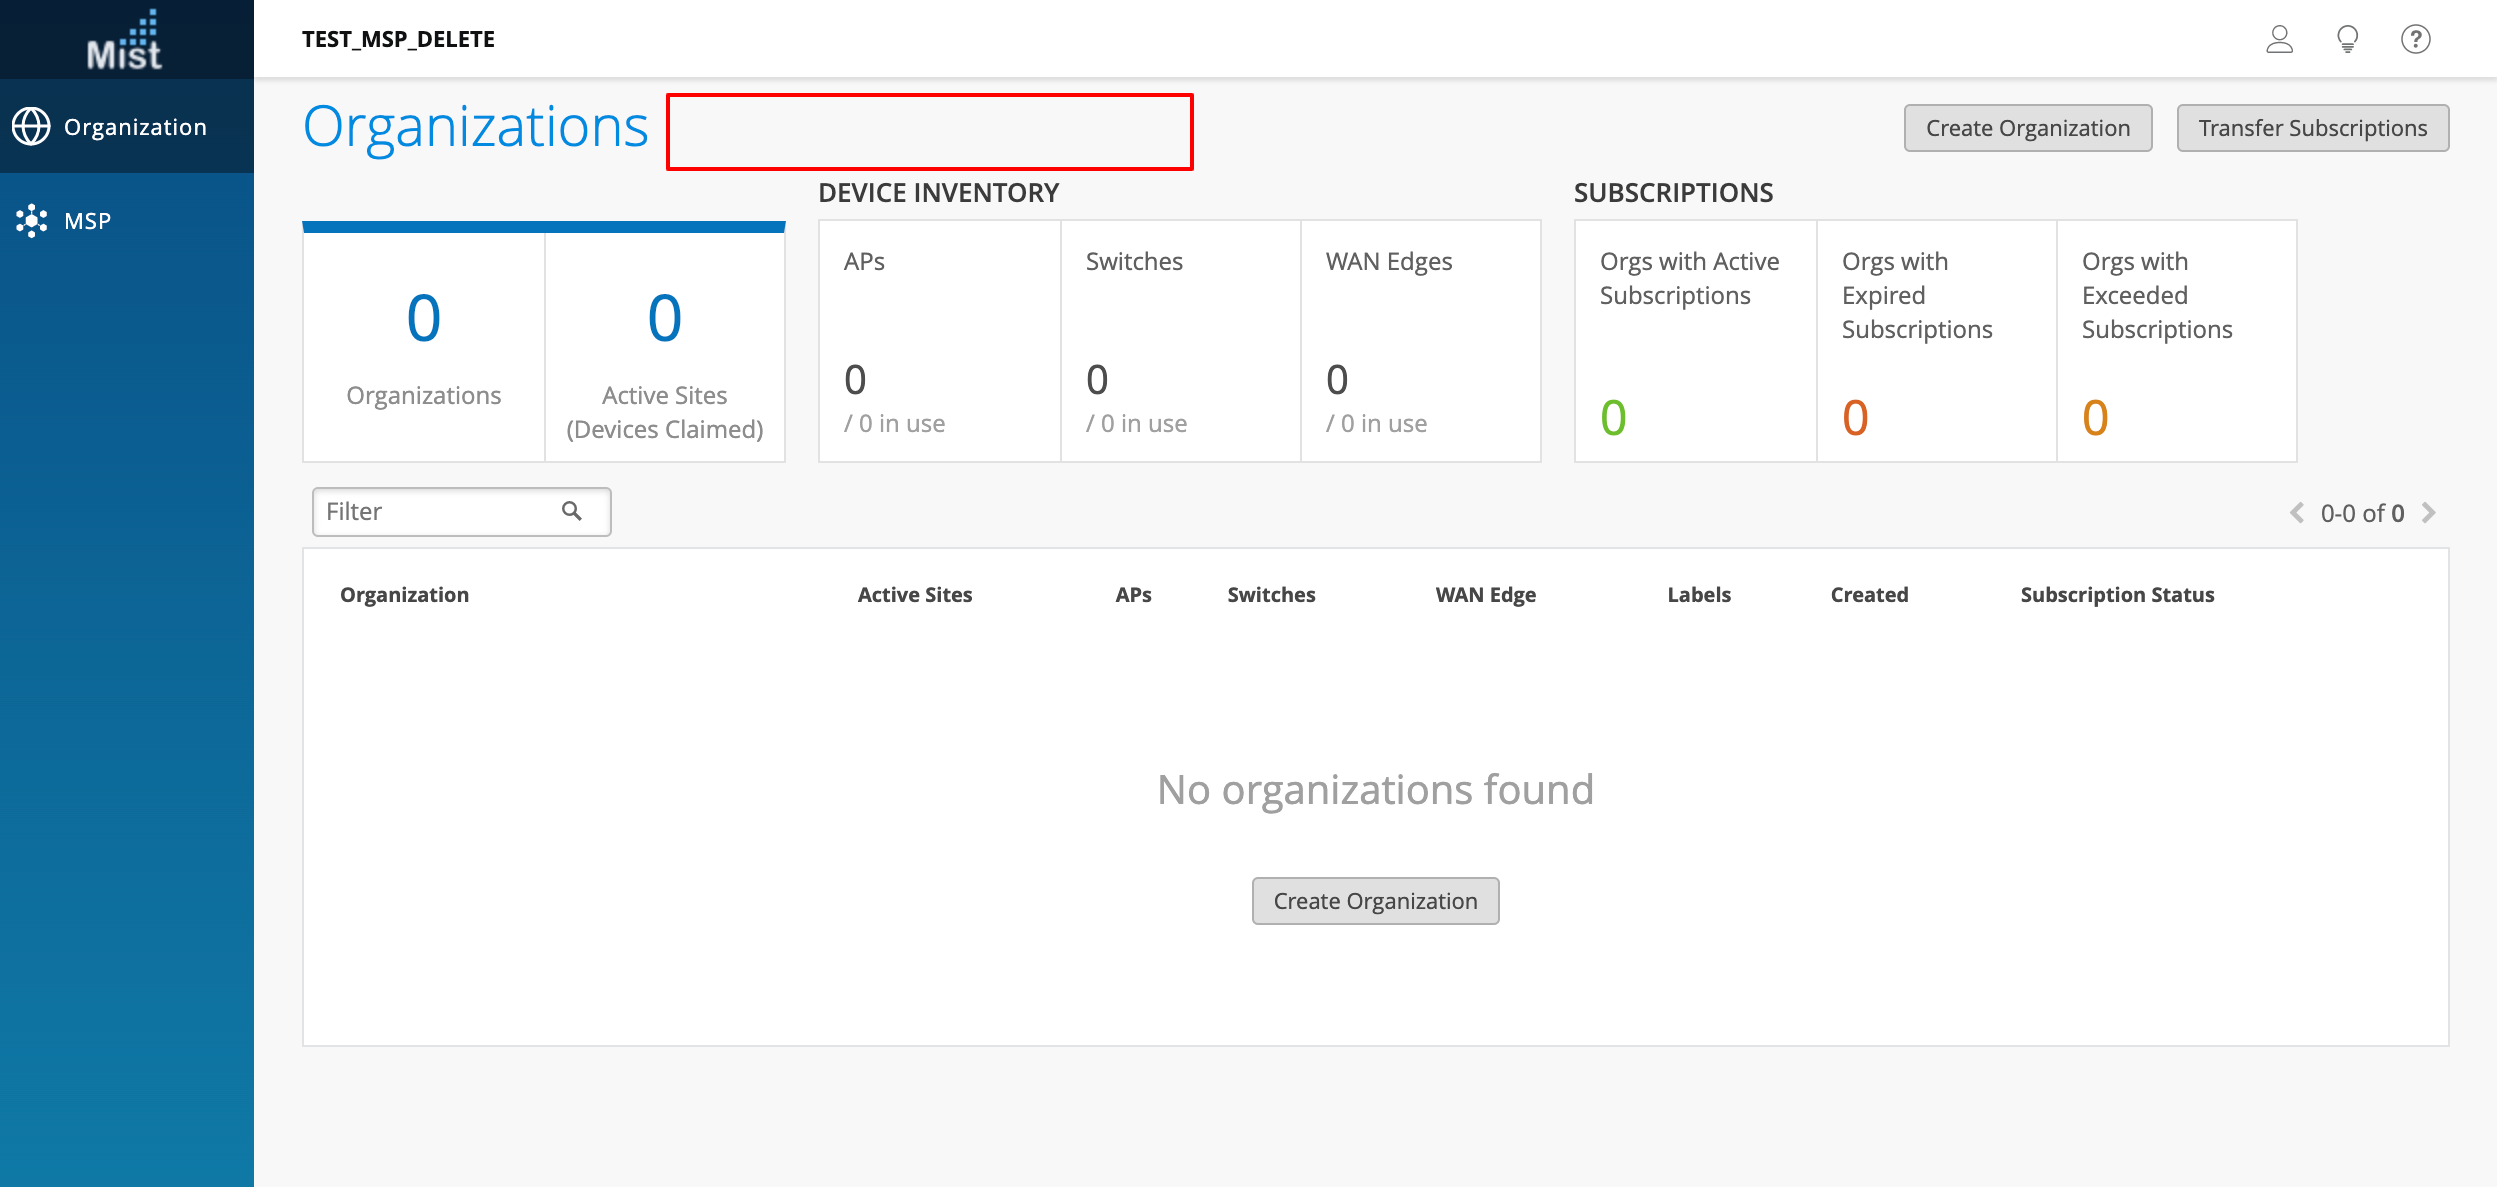
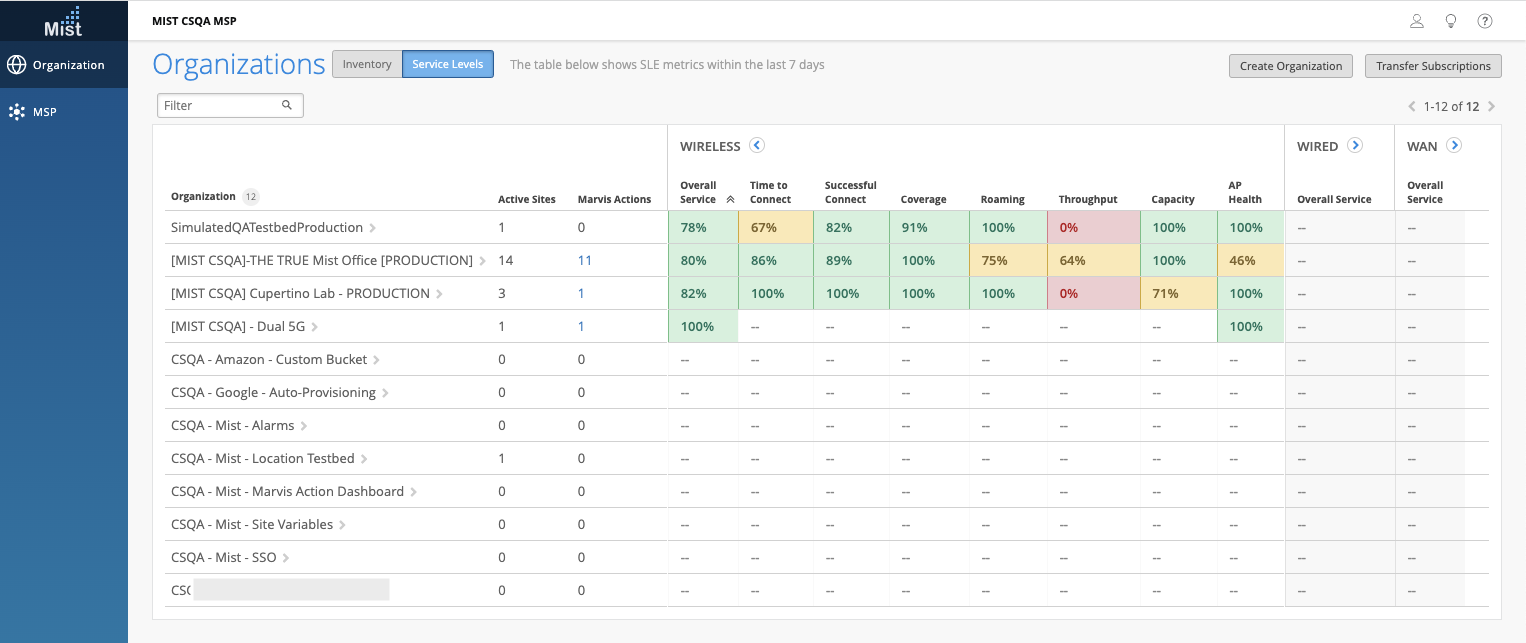
The MSP dashboard is updated to support the different MSP tiers, “base” and “advanced”. The “Service Levels” tab was temporarily available to all “base” MSPs as a preview, and now it is restricted to “advanced” MSPs only. We will be adding additional support in future releases for the “advanced” MSP tier, such as support ticket management from the MSP.
Example of a Basic tier MSP with no Service Levels tab:
Example of an Advanced tier MSP with all views:
Inventory Page Enhancements
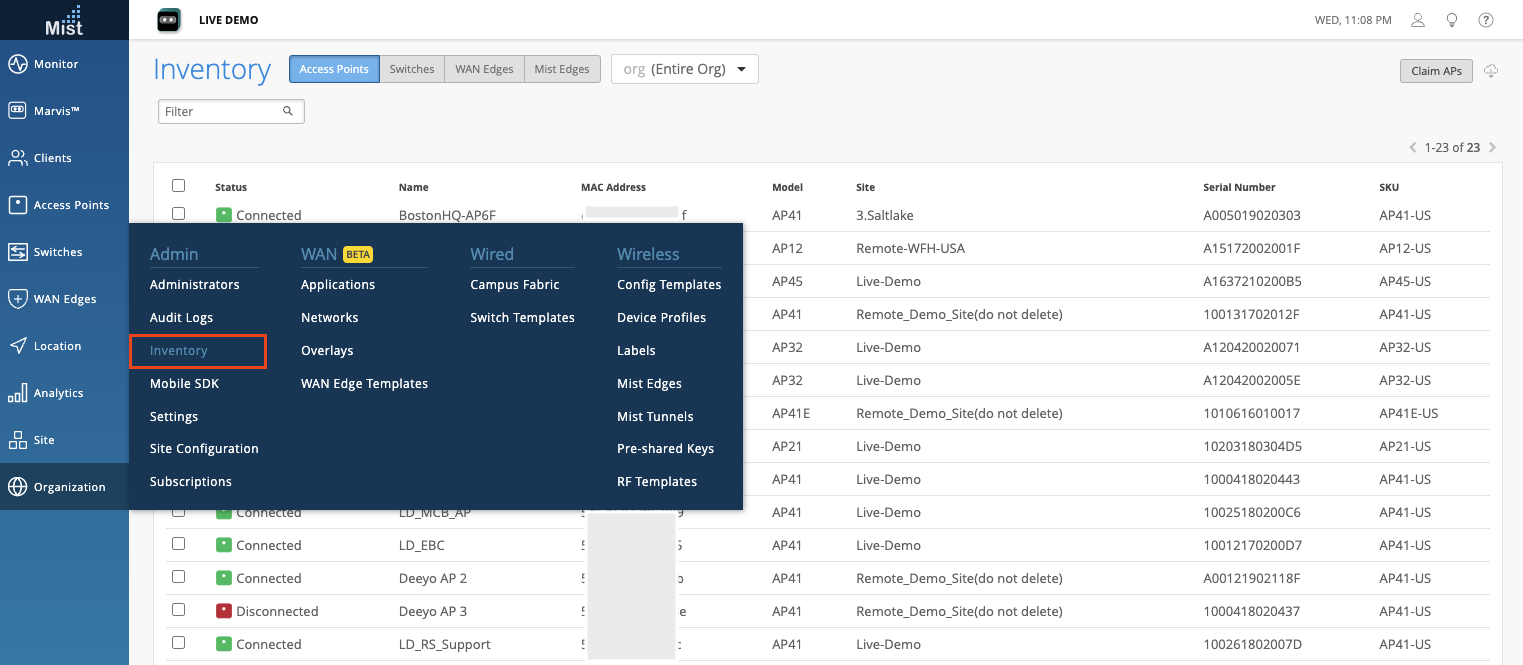
Previously our Inventory page was a list to reference all devices on your org. Now all of your assigned devices in this Inventory page are clickable and will route to their respective device details view. Use this view to easily show all devices on your entire org and navigate directly to them. To view your Inventory page, navigate to Organization > Inventory
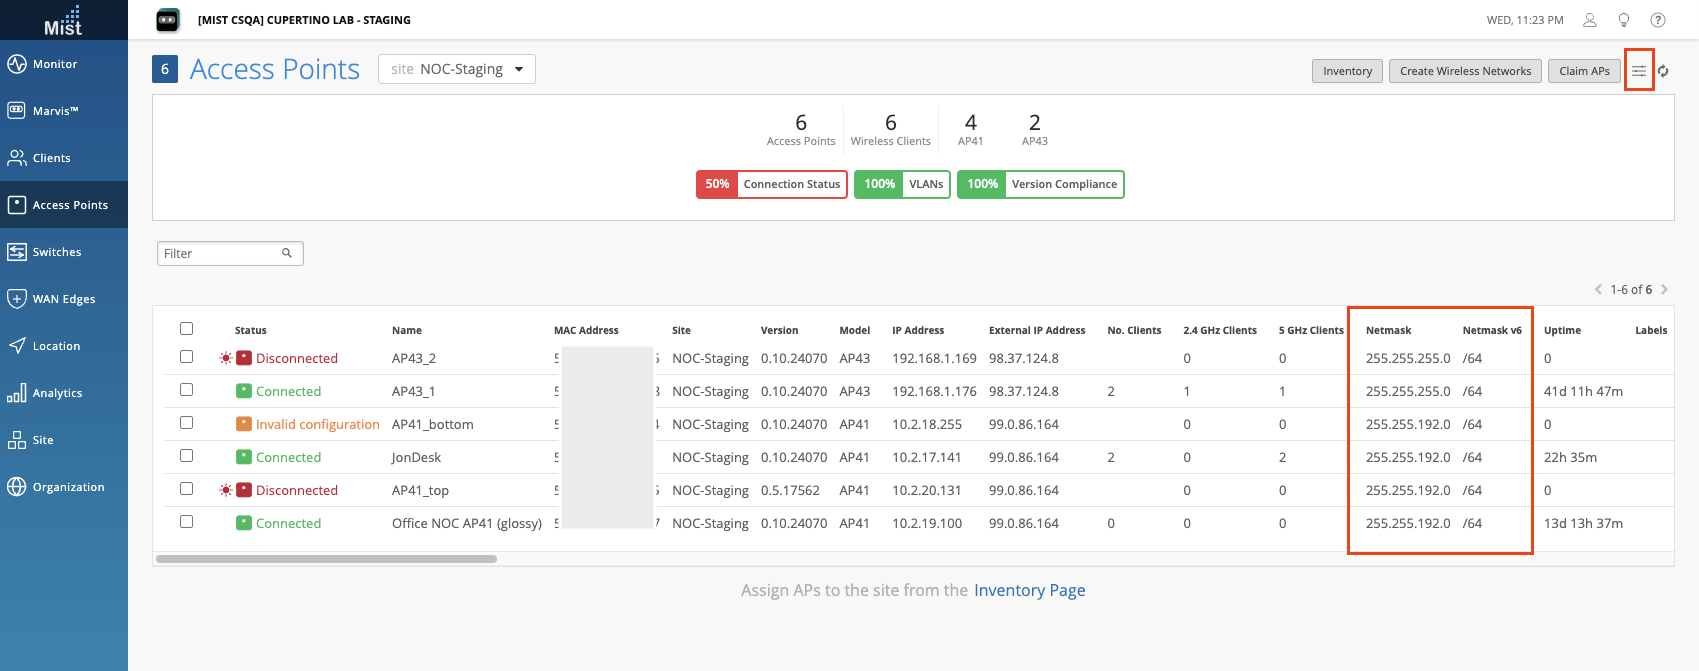
Access Point enhancements
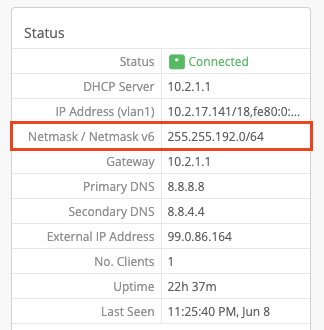
We have added the Netmask (IPv4) and Netmask v6 (IPv6) information into the AP list and AP details views. This allows APs to be sorted and filtered by netmask. Be sure to enable these new columns in the table settings button on your AP list page.
Subscription Banner Enhancement
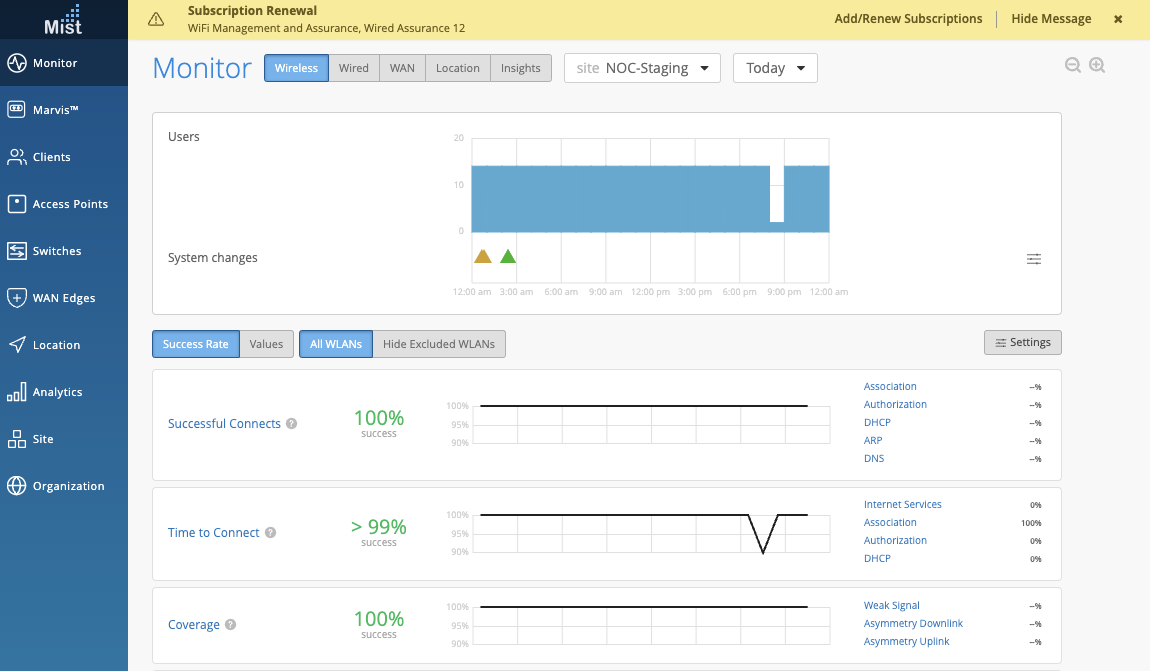
When a subscription expires, the “Add/Renew Subscriptions” link in the Subscription Renewal banner now routes directly to the Subscriptions page, where the subscriptions can be managed or renewed. Clicking the “x” button will hide the banner for the duration of the admin’s login session, while clicking the “Hide Message” link allows the admin to suppress the banner in the browser for a pre-set duration.
When the Wired Assurance subscription has expired, the Switches page is still visible with a warning banner indicating that the Juniper switches are no longer accessible through Mist, and what actions may be taken by the admin. The switch will still be accessible with some basic statistics and an option to release the device if the subscriptions are not renewed.
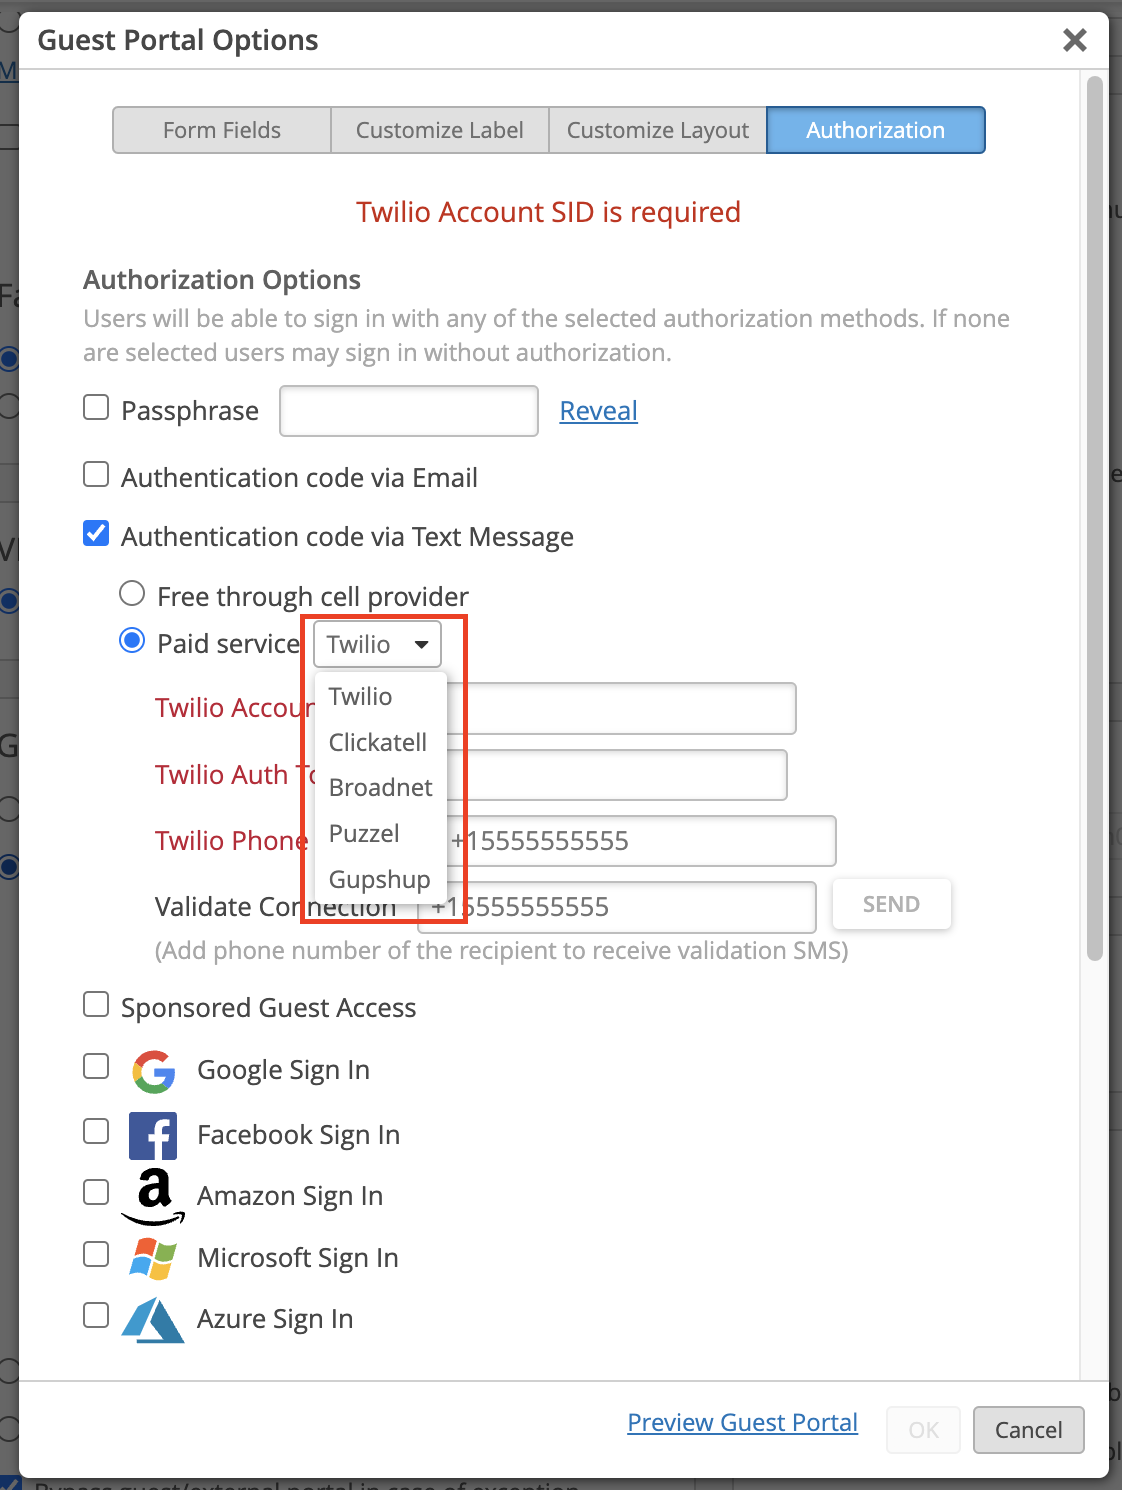
Guest Portal WLAN – Additional SMS Providers
We have added these additional SMS providers for you to use in a guest portal login:
Broadnet, Clickatell, Gupshup, Puzzel. To set up SMS access on one of these providers, navigate to your WLAN page and add a Guest portal WLAN (see here for more details: https://www.mist.com/documentation/mist-guest-portal/). Select Authentication code via Text Message and in the Paid Service dropdown, you may select your desired SMS provider from the list. Note that we now differentiate between the Free option of using a cell provider, and Paid services such as Twilio and the additional providers.
Marvis
Marvis Actions Alerts – More Details
We have made improvements to our Marvis Actions Webhooks by providing you more relevant information in the payloads you receive. With these details, you now have more visibility into your network issues, matching the information shown on the Action Dashboard in our UI. Here are the details provided in the Webhooks for each of the Marvis Actions:
- Port flap: Switch name & mac address, port, connected client name/mac address
- Neg mismatch: Switch name & mac address, port which has mismatch
- Connectivity Failures with Anomaly Detection: server IP address (for 802.1X) or WLAN (for PSK) name, affected wlan, failure reason
- Connectivity Failures with Scope: Scope (Org, site, server, AP, WLAN), Entity name (Server, AP, WLAN)
- Missing VLAN: Switch, AP name & mac address, port, missing vlan IDs
- Switch Bad cable: Switch name & mac address, port which has the bad cable
- AP – Offline: Switch, AP name & mac address, port, offline reason
- AP bad cable: Switch, AP name & mac address, port
- Persistently Failing Clients: Client name (if known)/mac address, WLANs (for wireless), switch name + port (for wired) failure reason
Here is an example webhook payload of an AP Offline Action:
{
    "topic": "alarms",
    "events": [
        {
            "_internal": {
                "alarmtemplate": {
                    "delivery": {
                        "additional_emails": [
                            "abcdef@juniper.net"
                        ],
                        "enabled": true,
                        "to_org_admins": true,
                        "to_site_admins": true
                    },
                    "rules": {
                        "ap_offline": {
                            "enabled": true
                        }
                    }
                },
                "site_info": {
                    "alarmTemplateId": "055e68e4-ba52-48d3-9ddf-936bXXXXXXX",
                    "id": "8XXXXXXXX-4432-ac1b-XXXXXXXXX",
                    "name": "NOC-Staging",
                    "org": "9747a50a-2XXXXXXXXXXXXXX",
                    "timezone": "America/Los_Angeles",
                    "vars": {}
                }
            },
            "alert_id": "3d2e37a0-5387-3287-955b-123412341234",
            "category": "ap",
            "count": 1,
            "details": {
                "action": "check_disconnected_ap",
                "category": "ap",
                "status": "open",
                "symptom": "ap_disconnect"
            },
            "email_content": {
                "disconnect_reason": "locally_offline",
                "impacted_ap": [
                    "JonDesk"
                ],
                "impacted_ap_count": 1,
                "status": "open"
            },
            "group": "marvis",
            "id": "3d2e37a0-5387-3287asdf23fasdf5ef2d47",
            "impacted_entities": [
                {
                    "entity_mac": "XXXXXXXXXXXX",
                    "entity_name": "JonDesk",
                    "entity_type": "ap"
                }
            ],
            "impacted_entity_count": 1,
            "last_seen": "2022-06-07T04:53:31",
            "org_id": "9747a50a-23f8-4ca5-83c4-XXXXXXXXXXXX",
            "org_name": "[MIST CSQA] Cupertino Lab - STAGING",
            "root_cause": "locally_offline",
            "severity": "critical",
            "site_id": "8d2e354a-8340-4432-ac1b-eXXXXXXX",
            "site_name": "NOC-Staging",
            "status": "open",
            "suggestion": "check_disconnected_ap",
            "timestamp": 1654578242.7112896,
            "type": "ap_offline"
        }
    ]
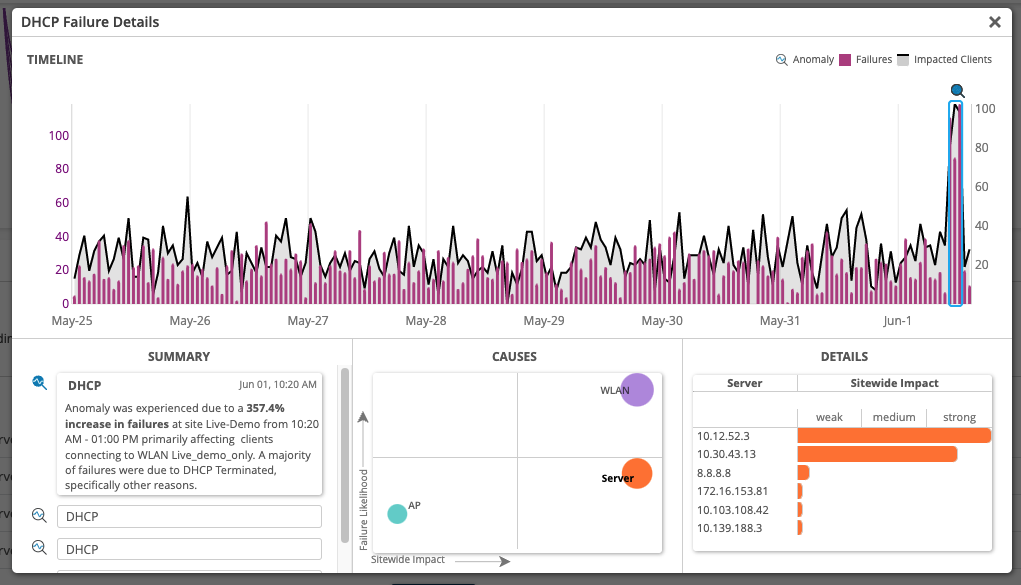
Server Information in Anomaly Details Card
Connectivity Failures with possible server correlations will now display the relevant information in the Anomaly Detection Details card. This will show up as a bubble in the Causes section – selecting the Server bubble will reveal the server list in the Details section. Please note that the server correlation is only visible in DHCP server, DNS server, and Connectivity (Radius server) failure actions. Read more about the Anomaly Detection card on this page:
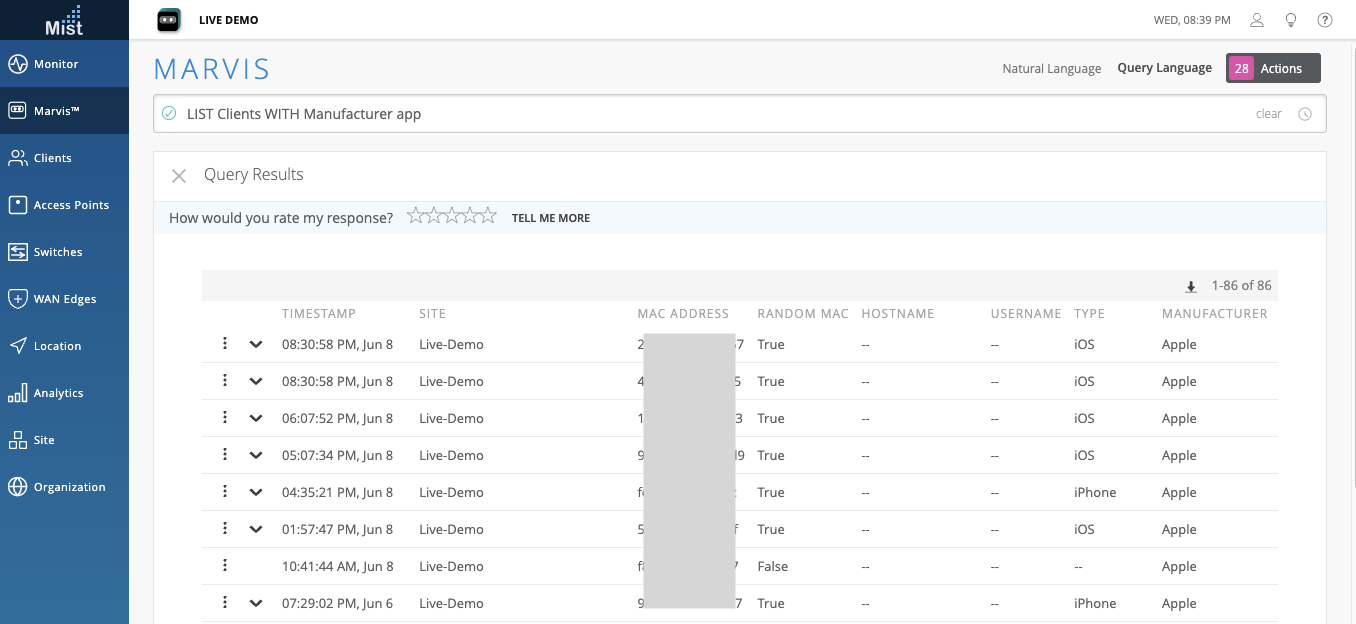
Marvis Query Language Improvements
Now, our Marvis Query Language allows you to search via partial text, hostname, and manufacturer name when searching for clients. You can use queries such as “LIST Clients WITH <Filter Type>” and “RANK <Object> BY ClientCount” in MQL. To use the MQL search, please navigate to the Marvis sidebar, and select Query Language. If you are on the Action Dashboard page, select the Ask a Question button first. Here is an example of listing all clients with a manufacturer containing “app” in the name:
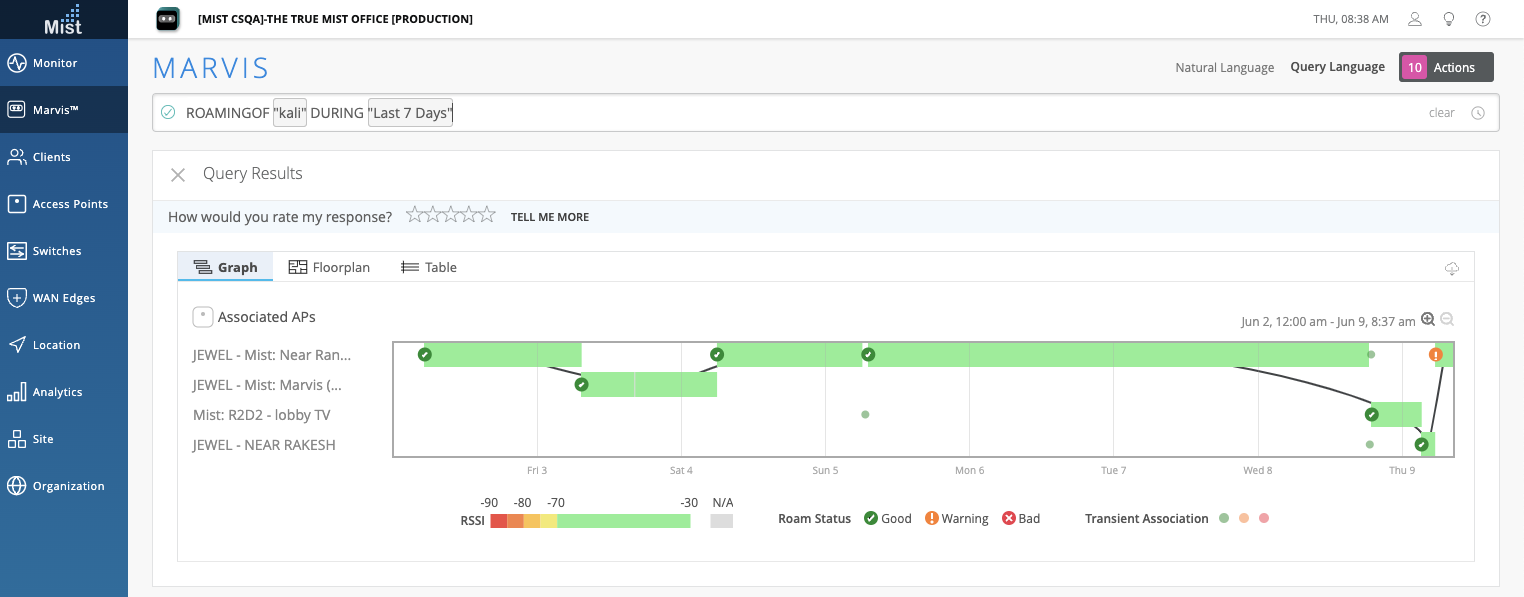
The “ROAMINGOF <Client>” query is now improved and will display the WiFi Client’s full roaming history for the selected duration, rather than only showing the roaming graph for the most recent 1000 events.
Conversational Assistant Improvements
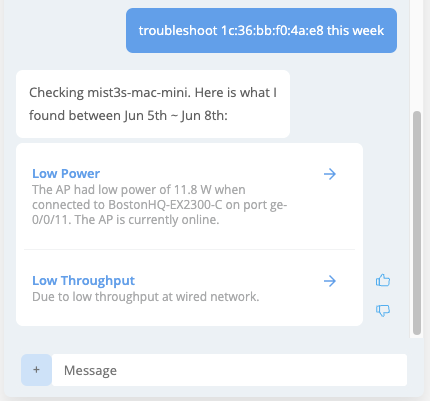
Troubleshooting Wired Clients
We are excited to bring you the capability to troubleshoot wired clients directly from our Marvis Conversational Assistant! Ask Marvis to troubleshoot a wired client to find any connection failures, port health issues, and switch health events experienced by the wired client. Stay tuned for even more details to be available for wired client troubleshooting in our future releases.
Troubleshooting Switch – 1st level details
Troubleshooting a switch in the Marvis Conversational Assistant now immediately reveals details in the first level of troubleshooting, saving you an additional step to dig for more information in the window. For switches with multiple issues, the most prevalent one will be prioritized and displayed, while the other active issues can be found by clicking on Other minor issues.
In this example, we troubleshoot a switch with Uplink Congestion issues on port ge-0/0/23. Since this is the major issue for this switch, it is displayed in the first level.
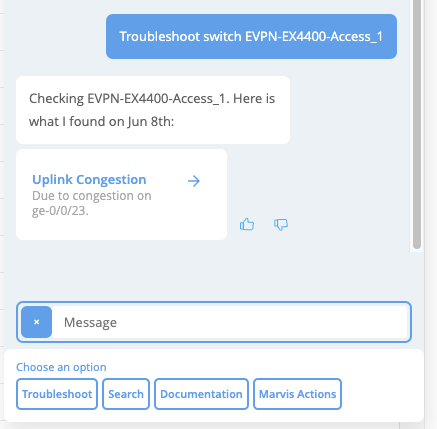
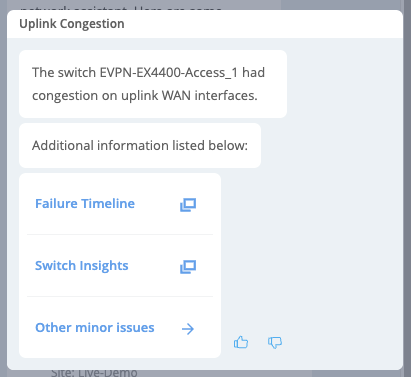
Clicking on the Uplink Congestion will allow you to choose which page to navigate on our UI to troubleshoot the issue. From here, you can also access the other minor issues of the switch.
Troubleshooting Switches also shows Successful Connect Issues
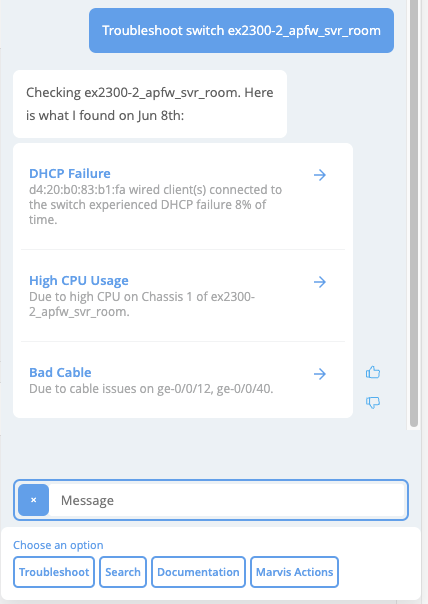
Troubleshooting switches on our Marvis Conversational Assistant will also reveal any Successful Connects issues that wired clients of that switch are experiencing. Here, we troubleshoot a switch on our site, and the first level of details reveals that a wired client is experiencing DHCP failures on the switch.
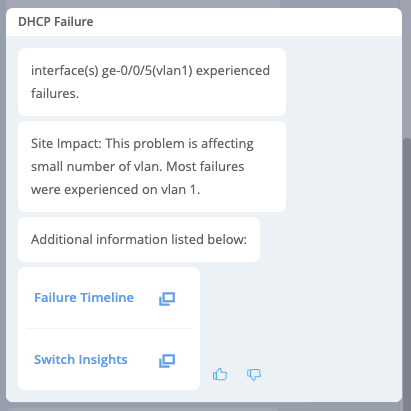
Clicking into this suggestion, the 2nd level shows additional details about the DHCP failures. From here you can have Marvis bring you to either the Failure Timeline or the Switch Insights page to further dig into the problem.
Wired Assurance
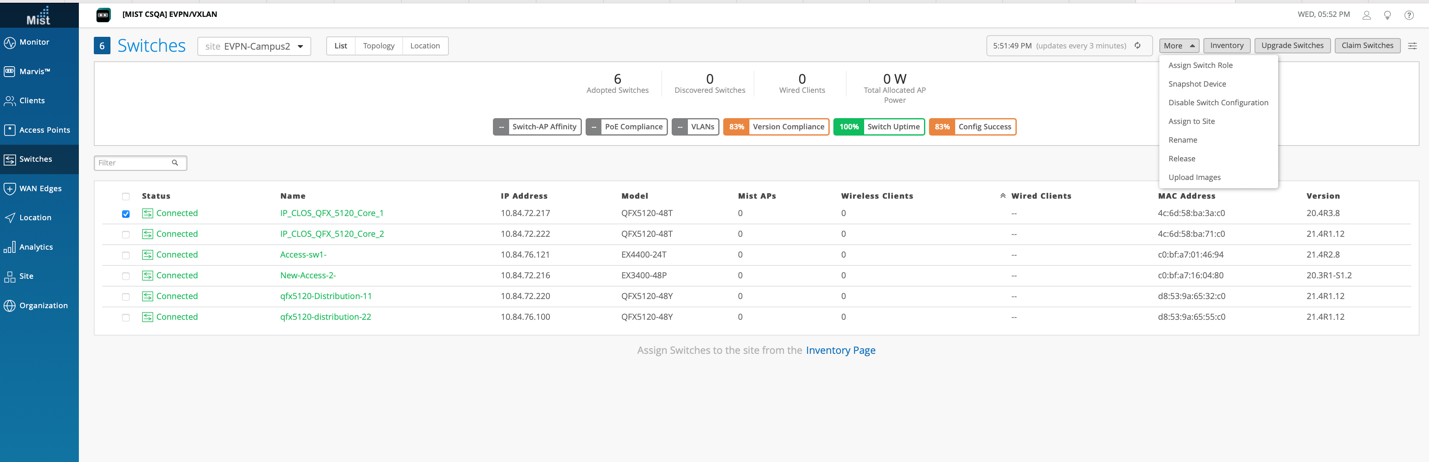
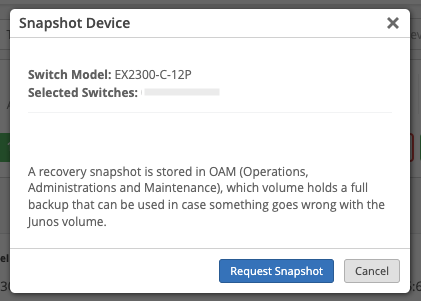
On-demand Snapshot
We now offer on-demand snapshot for supported EX & SRX models. A recovery snapshot is stored in OAM (Operations, Administrations and Maintenance), whose volume holds a full backup that can be used in case something goes wrong with the Junos volume. Find this function when you select a switch from you list and use the More dropdown menu > Snapshot Device.
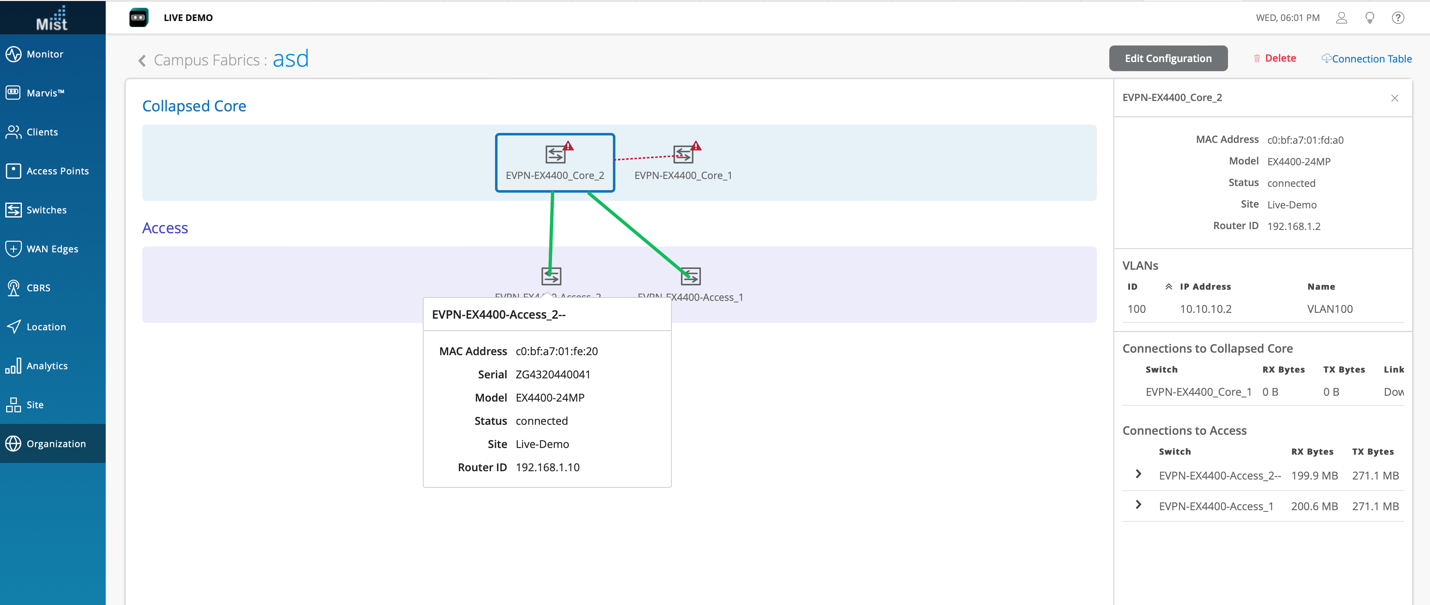
EVPN Visibility
We have added support to display the link status & details of connection between different devices under EVPN topologies to provide enhanced user visibility for troubleshooting. To view these details, just hover over your EVPN device in the Campus Fabrics view (Organization > Wired > Campus Fabrics).
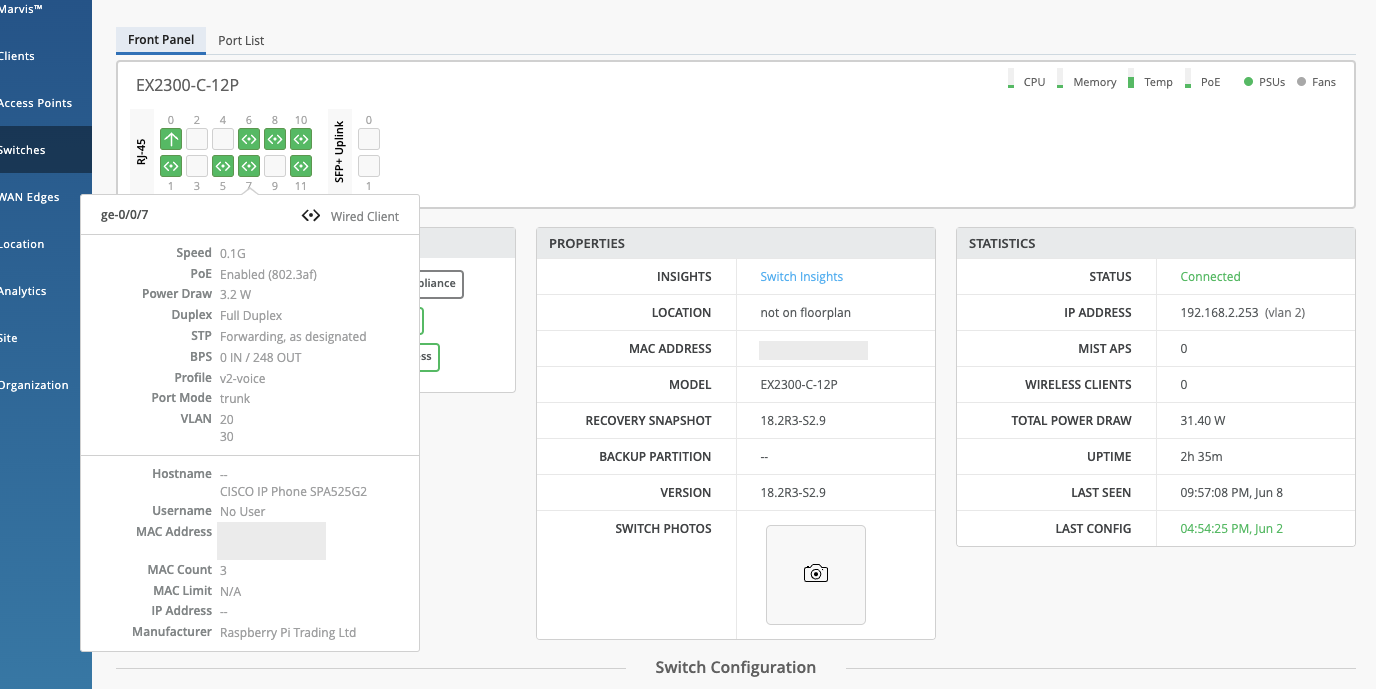
Display Multiple VLANs
Display multiple VLANs on trunk interfaces via the Front Panel, Port list & Wired clients view.
Here is an example of the front panel view. Hovering over a port with multiple VLANs will display the full list in the Details card.
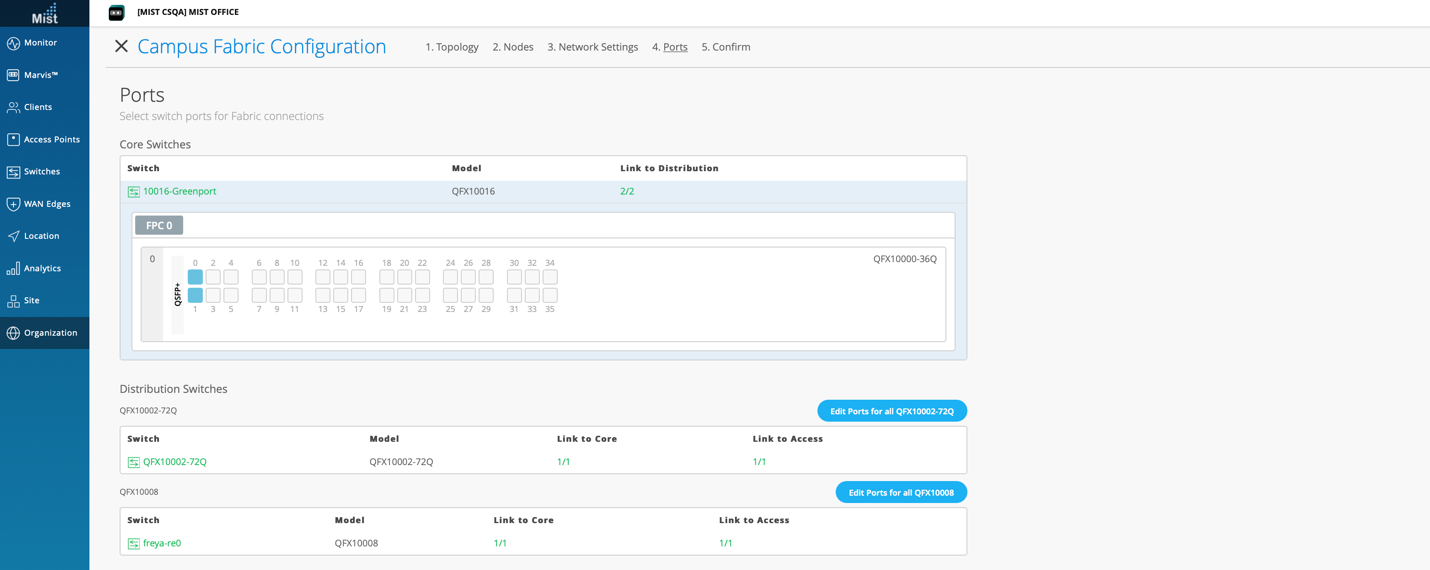
QFX10K Series Support
We have added Wired Assurance & EVPN-VXLAN Support for QFX10008 & QFX100016 devices.
WAN Assurance
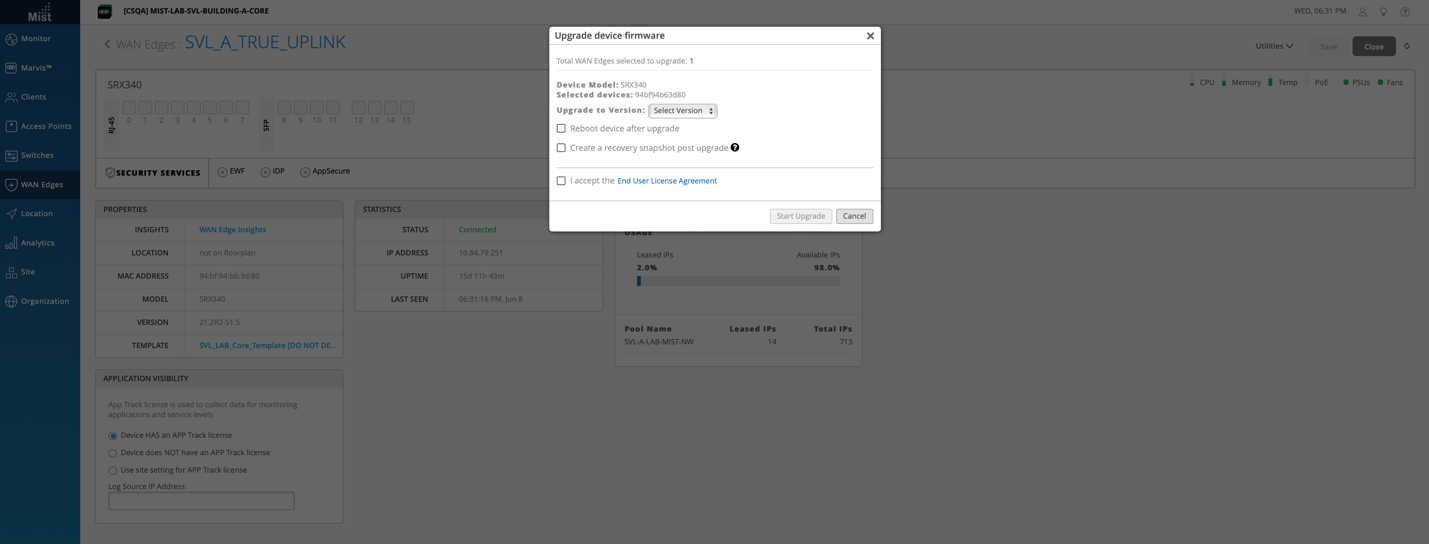
SRX Upgrade & Snapshot Support
You can now upgrade SRX devices directly from Mist UI for JTAC suggested & above SR releases. The snapshot option is also available for supported SRX models.
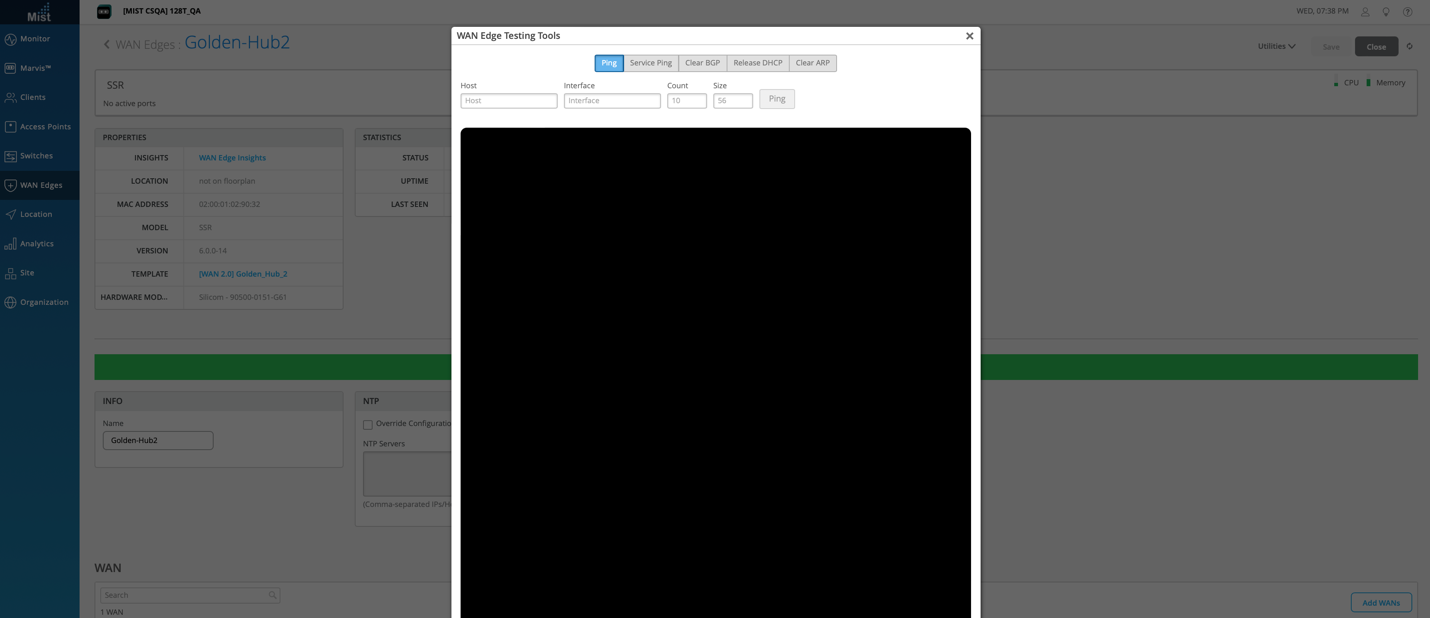
SSR Testing tools
Use testing tools such as Ping, Service Ping, Clear BGP, Release DHCP, Clear ARP directly in our UI, similar to our AP and Switch testing tools. Find these testing tools in the Utilities dropdown of your SSR device. Keep in mind that this feature is available for those with WAN 2.0 only. Please contact our support team for access.
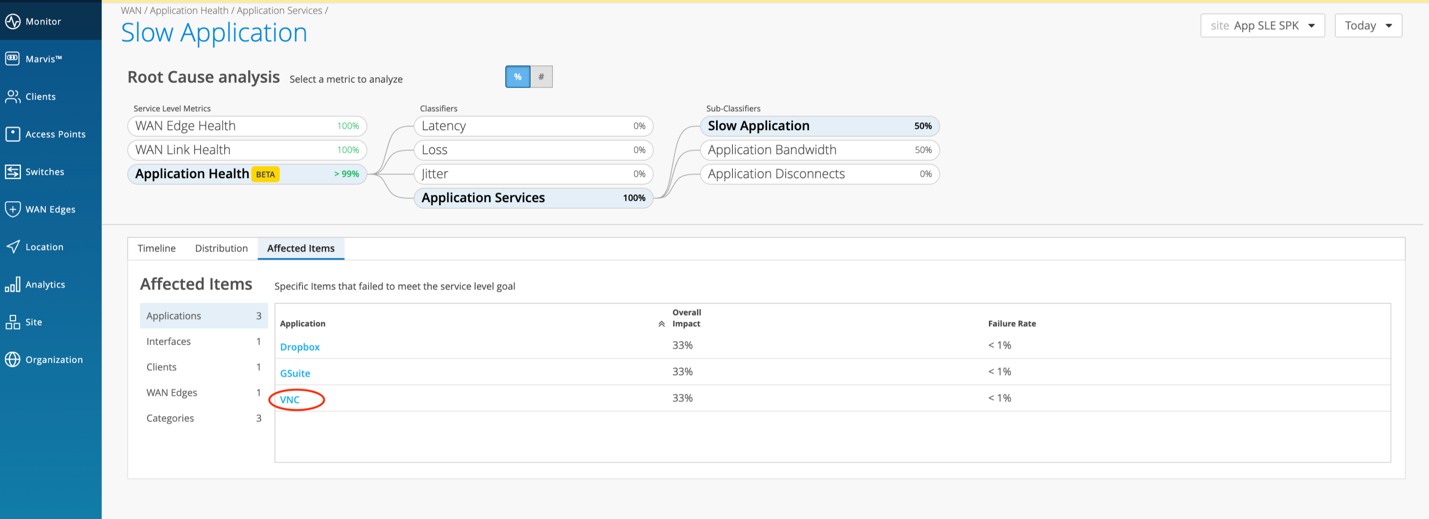
Custom App SLE for SSR devices
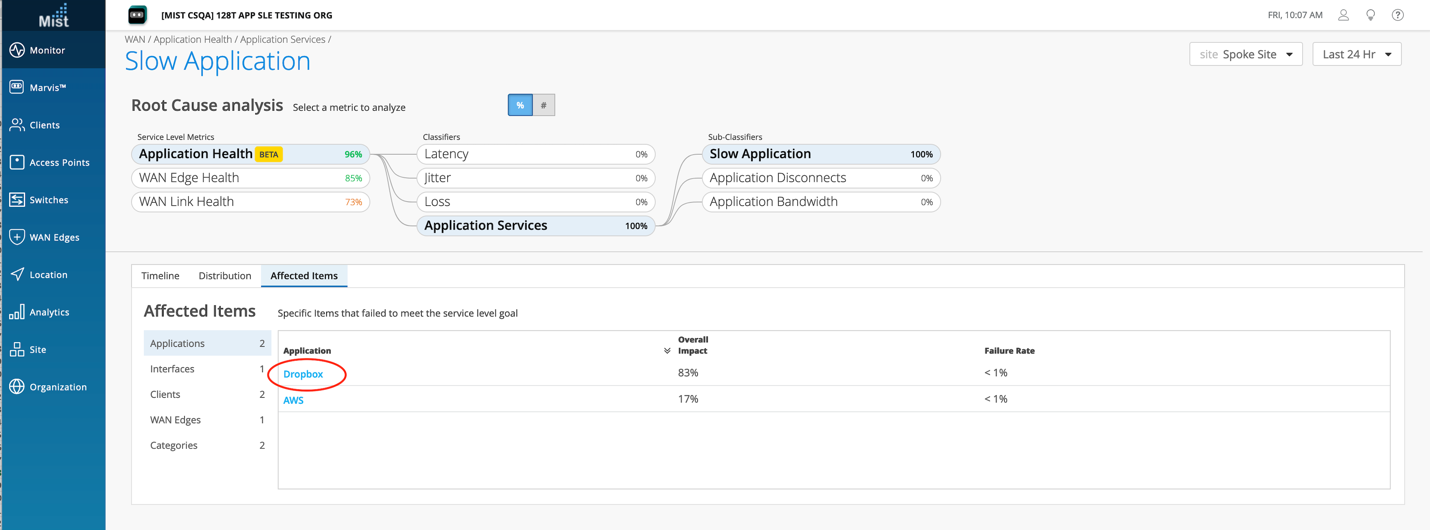
Now Custom App SLE is supported for WAN 1.0 devices only. You can define your custom App under “Services” in the SSR conductor. If your defined application is being affected the WAN App SLE will populate with the corresponding sub-classifier & affected client list. In addition, selected predefined Apps can also be added to the WAN App list.
Predefined Apps:
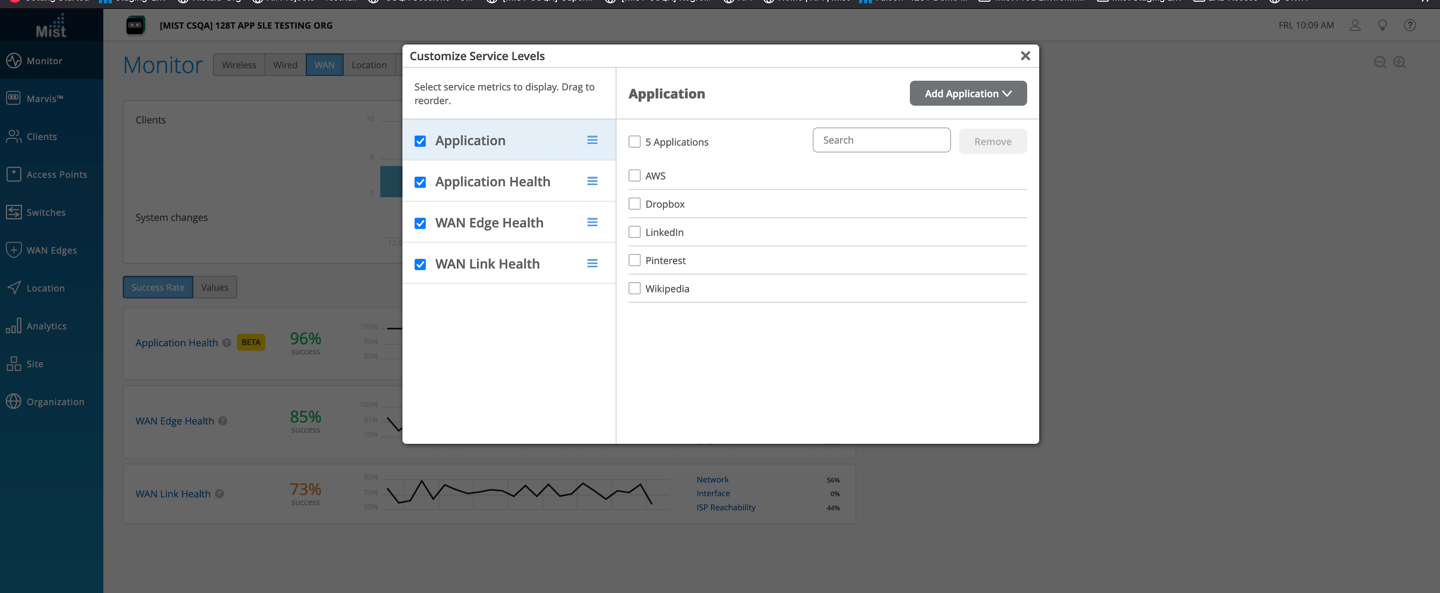
Custom App:
Mist Edge
Mist Edge Details in some SLE views
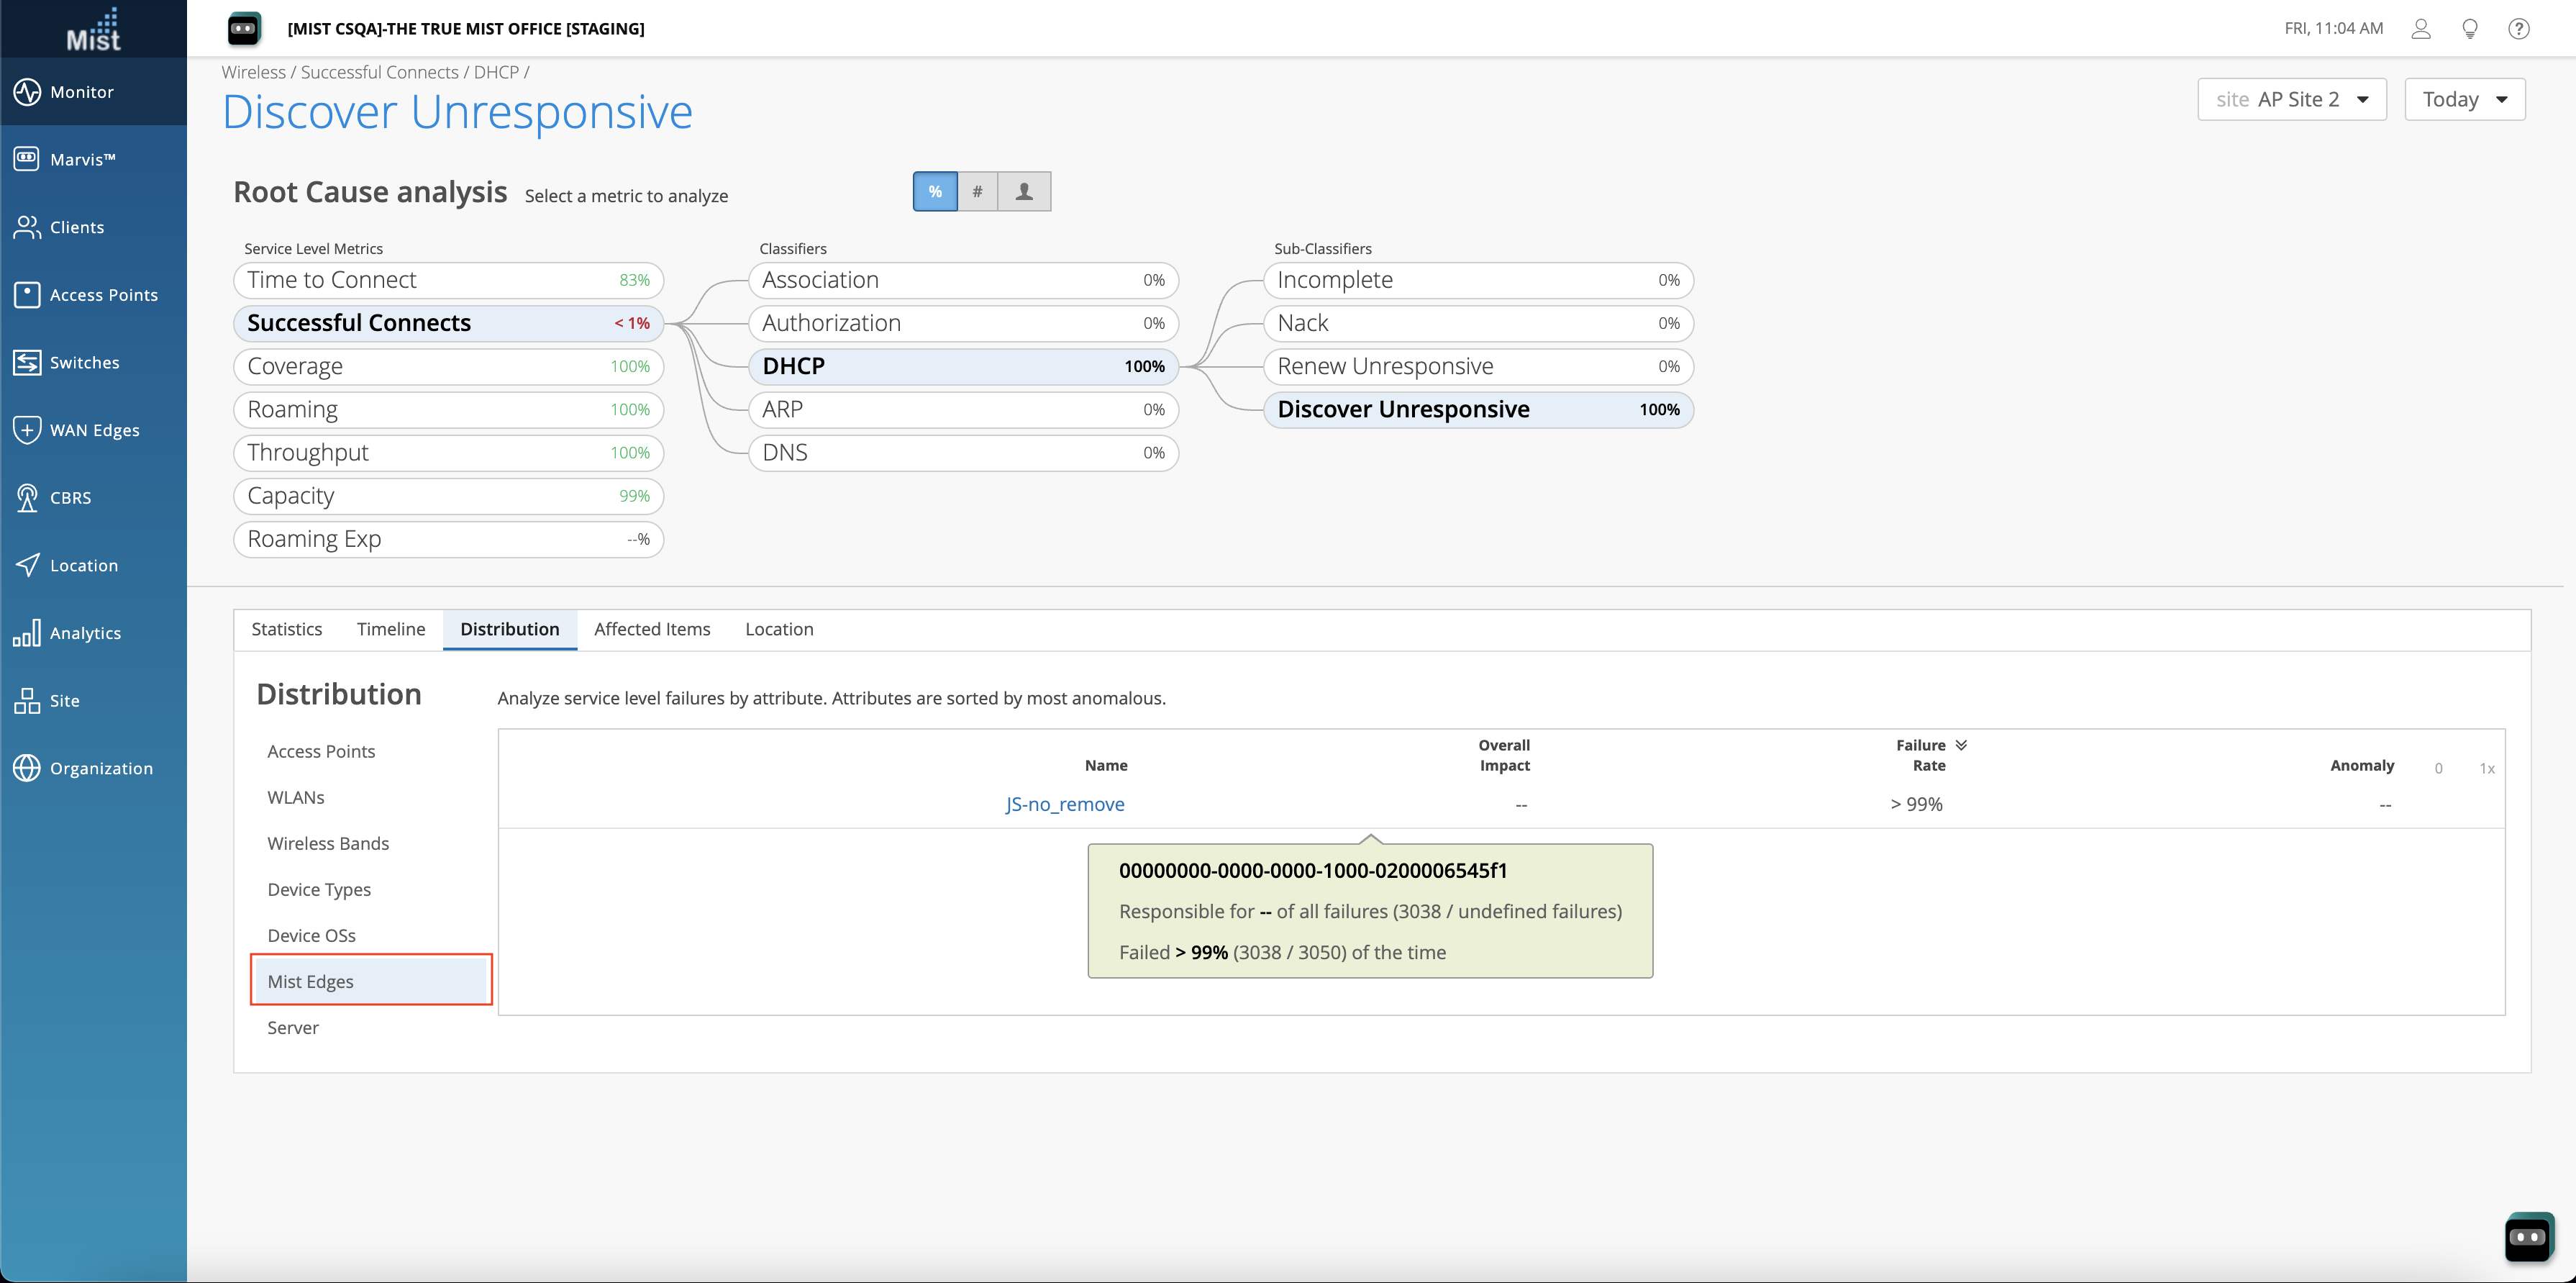
Now, in the Successful Connects and Time to Connect SLEs, you will find a Mist Edge tab under the Distribution section in each Sub-Classifiers, when viewing the SLE details. This can bring more insight into cases where your Mist Edge devices are impacting these SLEs.
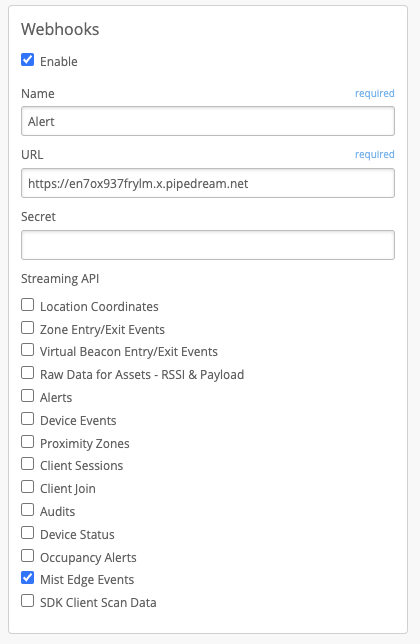
Mist Edge Events
We now generate events when the Mist Edge port status or link status changes, as well as LACP port dropping out of LACP. Currently these events can be seen on the Mist Edge stats API and can be received as a webhook payload as well. These events will be exposed in the UI in an upcoming release. To enable webhooks for Mist Edge, make sure you select the Mist Edge option in your Webhooks settings under Organization > Admin > Site Configuration.