Mist Juniper Service Level Expectations (SLE) shows the client experience on your network at any given point in time. Use the SLE page to measure and manage your network proactively by identifying pain points before they become too big of an issue. Do you want to know how your network is doing today? Wired SLEs can help you identify which metric is running into problems by showing the percentages of success and failures in a given time range.
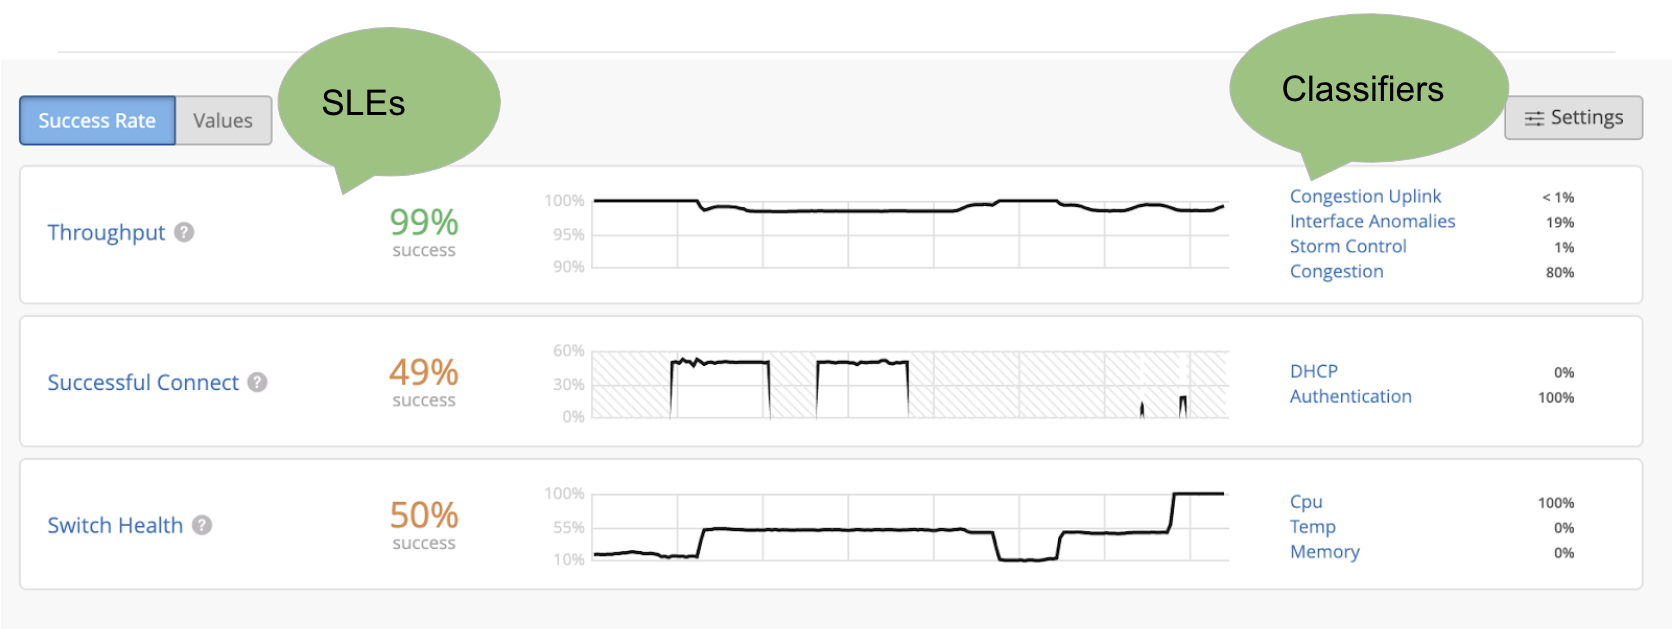
Our Wired SLEs are divided into 3 Metrics: Throughput, Switch Health, and Successful Connects. Click into these metrics to find detailed Classifiers and Sub-Classifiers which show the exact circumstances of failures experienced by your clients.

Throughput SLE
The Throughput SLE can help you recognize the need for more bandwidth on your site. Many factors can affect the throughput value of your network, including MTU mismatches, bad cables, and devices negotiating at the wrong speed. With the Throughput SLE, you can proactively assess when your network needs a higher bandwidth to function properly.
The Throughput SLE is divided into 5 Separate Classifiers:
Congestion
Congestion measures the number of output drops. When packets come into your interface, they are queued in a buffer. When the buffer becomes full it will start to drop packets (TxDrops). We use a formula that takes into account these 3 ratios to determine whenever there is a “Bad user minute” due to congestion:
- TxDrops to TxPackets
- Txbps to Link speed
- RxSpeed to Link Speed
Congestion Uplink
High congestion uplink can be caused by:
- A neighbor being a switch or router (this is known through LLDP)
- When port is a STP Root Port
- Tx and RX is higher than the rest of the ports
- Aggregated Links
- Module ports
We attach a coefficient to each of these factors and run a logistic regression function against each factor to determine the uplink.
Interface Anomalies
The details for interface anomalies are all obtained from the switch. The data is then correlated into a format that is easier to consume for users. The Interface Anomalies Classifier is split up into 3 Sub-Classifiers: MTU Mismatch, Cable Issues, and Negotiation Failed.
MTU Mismatch
Admins have the ability to set the Max Transmission Unit (MTU) on each interface (The default is 1514 for gigabit interfaces). If the interface needs the ability to send Jumbo Frames, the MTU is set to a higher 9216. MTU needs to be the same value along the path of the packet, and if there are any MTU Mismatches, the packets will be discarded. In Juniper switches, MTU mismatches can be identified under MTU Errors and Input Errors. Every time an Input Error or MTU Error is observed on an interface, we calculate a bad user minute for that user.
Cable Issues
If a physical cable on your network setup is faulty, we will detect this and the Cable Issues Sub-classifier will indicate failure.
Negotiation Failed
Latency can be observed on ports when Local or remote device settings are misconfigured, Auto-negotiation fails, or when there is a possible duplex conflict. Older devices may not be able to negotiate at full speed and will fall back to a slower link speed of 100 Mbps. These scenarios can cause latency issues for clients connected.
Storm Control
Storm control enables the device to monitor traffic levels and to drop broadcast, multicast, and unknown unicast (BUM) packets when a specified traffic level is exceeded. These specified traffic levels are called storm control level or storm control bandwidth. By default on Juniper switches, on all layer 2 interfaces the storm control level is set to 80 percent of the combined broadcast, multicast, and unknown unicast traffic streams. There are use cases where storm-control helps prevent an actual storm, but there might also be applications or client devices that are being throttled due to storm control and may be eligible for removal of this restriction. The goal for this Classifier is to identify such conditions and proactively help mitigate throughput issues.
Network
The Network Classifier represents issues related to the round trip time (RTT) for messages from the switch to the cloud. It is split up into two Sub-classifiers: Latency and Jitter.
Latency
The Latency is calculated using the average value of RTT over a period of time.
Jitter
Jitter is calculated using the variation (standard deviation) of RTT within a small time period (last 5/10 min.) for a particular switch or site and comparing this value with the overall deviation of RTT over a longer period of time (day/week).
Switch Health SLE
We monitor Switch Health through an SLE since CPU usage can affect connected clients. Whenever the CPU utilization spikes up to 100%, the AP will lose connectivity, directly impacting clients and preventing them from being able to pass traffic. Bad user minutes are recorded on clients connected to a wired switch with these classifiers and failing conditions:
- Power used on the switch is above 90% of the available power
- Memory utilization is above 80%
- CPU usage of the switch is above 90%
- Temperature is beyond the prescribed operating threshold for the switch (both above and below)
- The switch itself is Unreachable. Disconnected switches age-out of the SLE after seven days from the last seen time.
Successful Connects SLE
This SLE indicates whether a client was able to connect to the network with success or failure. This gives us the ability to determine the scope of impact on your network to help identify the issue that needs to be addressed. For example, in a case where we see dot1x failures on the site, here are some possible culprits for failure:
- If a single port is failing authentication this usually correlates to the port being misconfigured or a user error.
- If all ports from a single switch are failing authentication, this would correlate with the switch not being added as a NAS client in the RADIUS server, or with a routing issue between the switch and RADIUS server.
- If all ports on all switches are failing, this would indicate that the RADIUS server itself had a failure at that point in time.
- If all devices of a certain type i.e. Windows devices are failing, then this could indicate a cert related issue.
The two Classifiers that make up Successful Connects are Authentication and DHCP.
Authentication
Every time a client authenticates, a client event is generated. These will either be successful events or failure events. Failures in this classifier correlate to these failing client events.
DHCP
Switches need to be configured with DHCP Snooping (not enabled by default) in order to see these failures in the Classifier. Snooping enables the switch to bring DHCP packets to the CPU/PFE level and examines the packets and keeps track of the binding. A failure to connect is tracked every time a client connects to a network and does not reach the “bound” state within the minute.