Failing Authorization
For this section we will be taking a client (38:78:62:40:de:e5) and giving a wrong password multiple times deliberately.
Check Marvis with following command
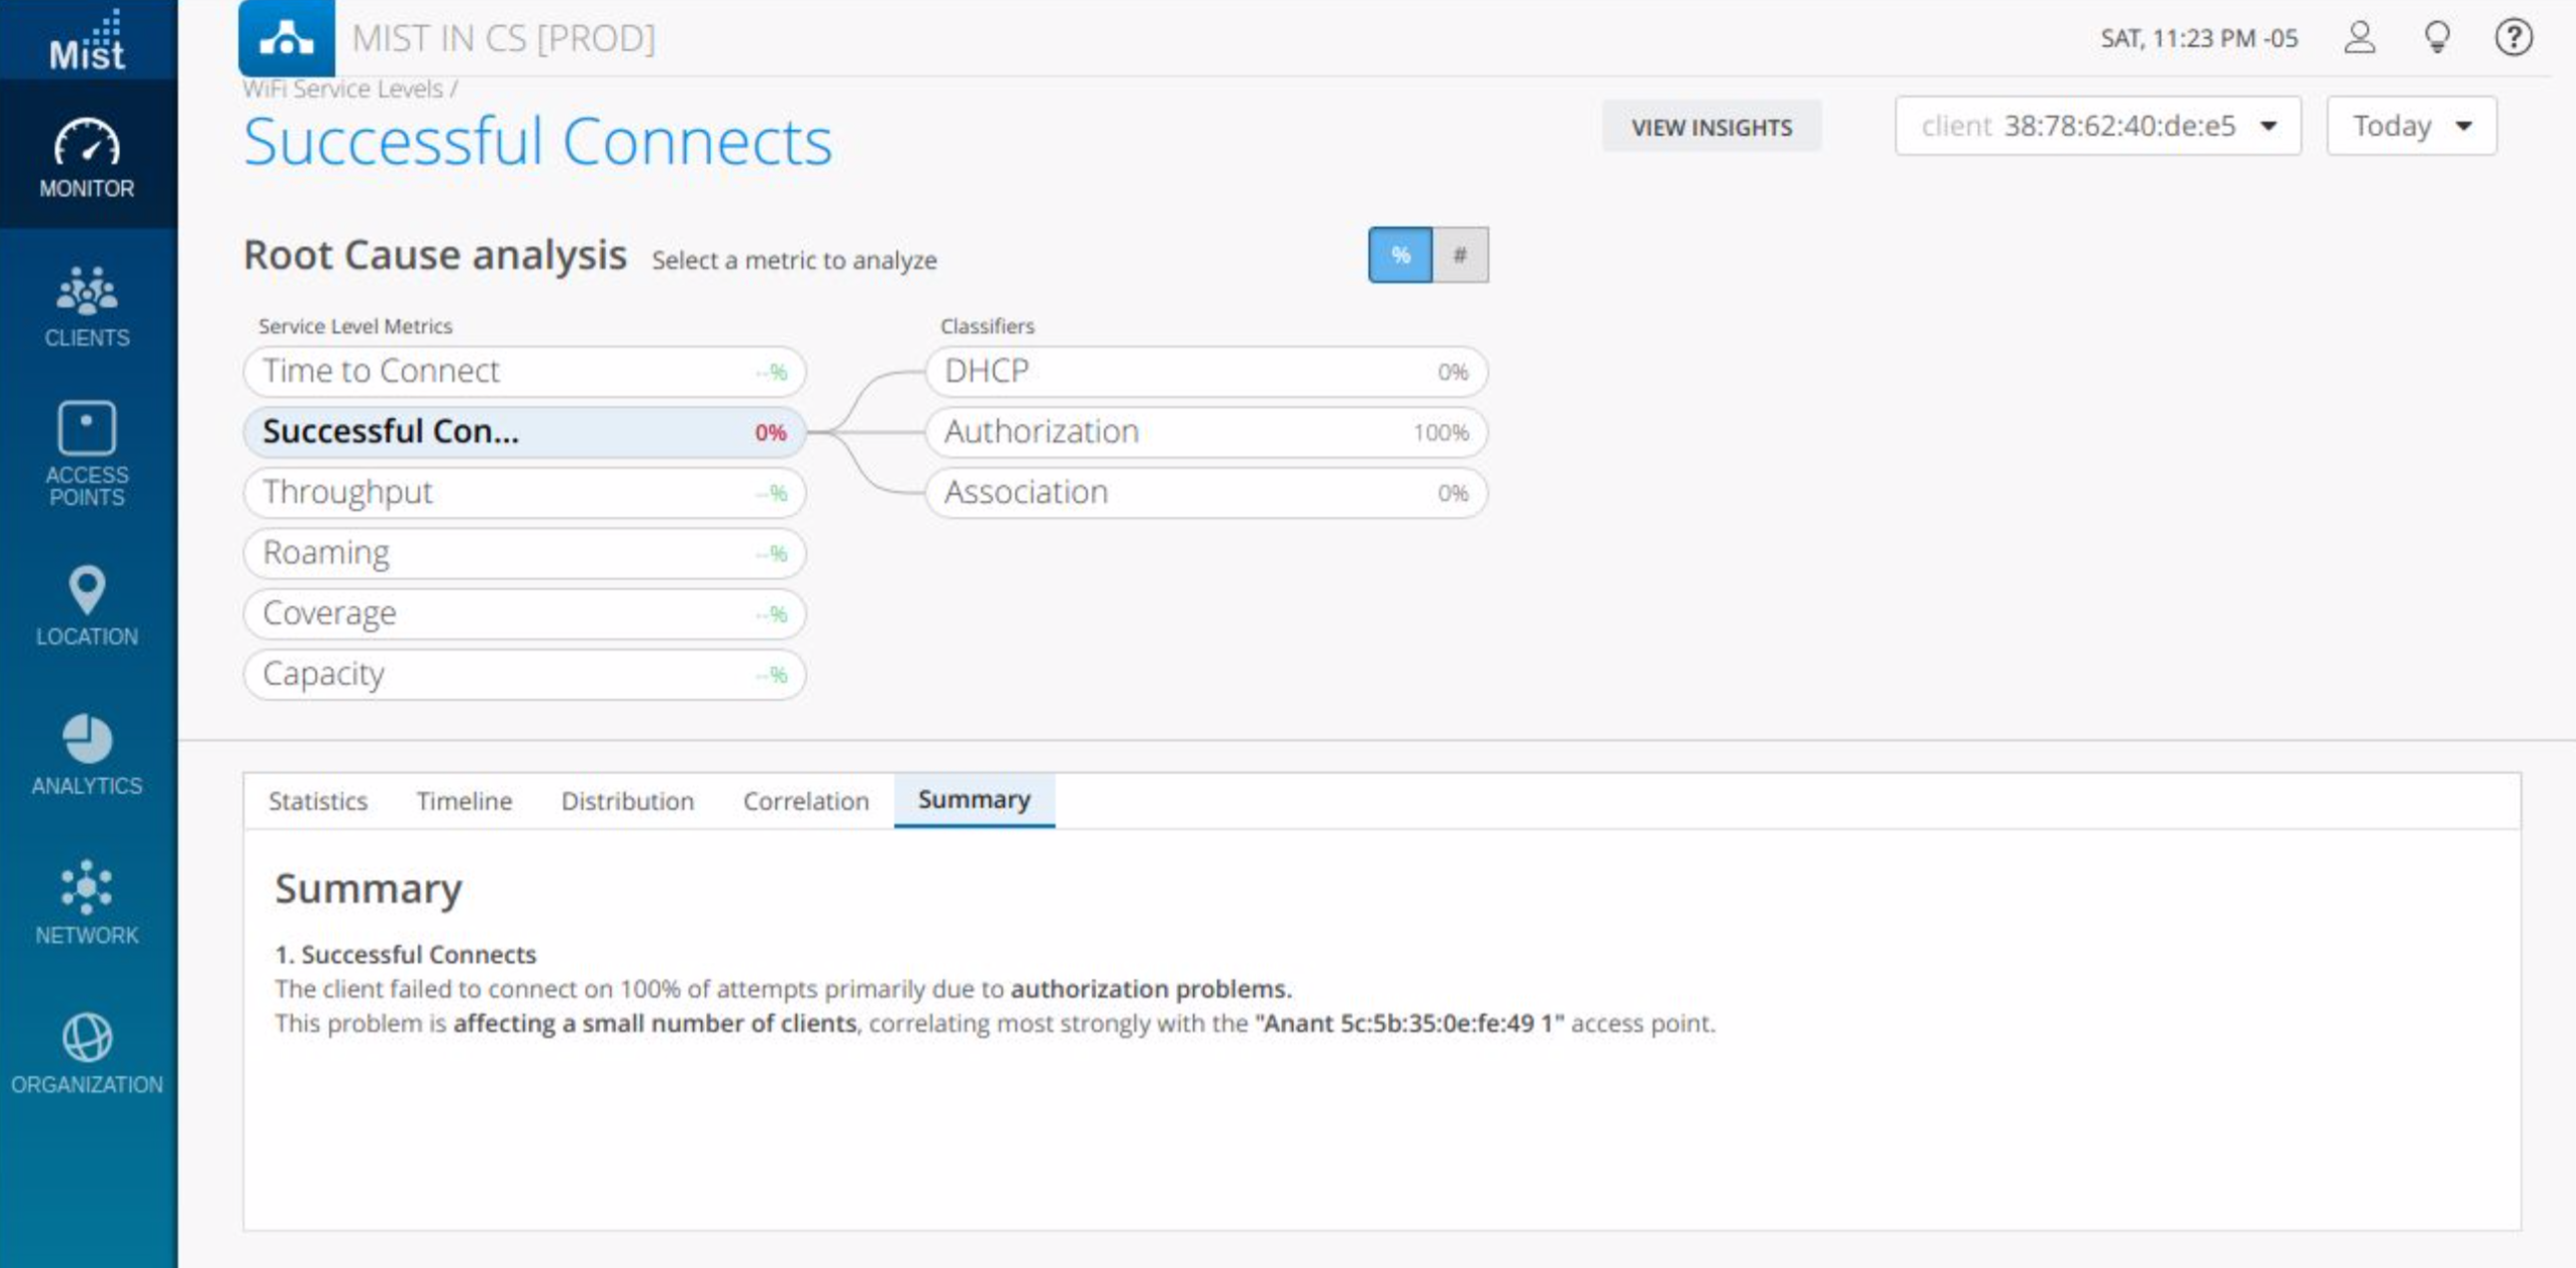
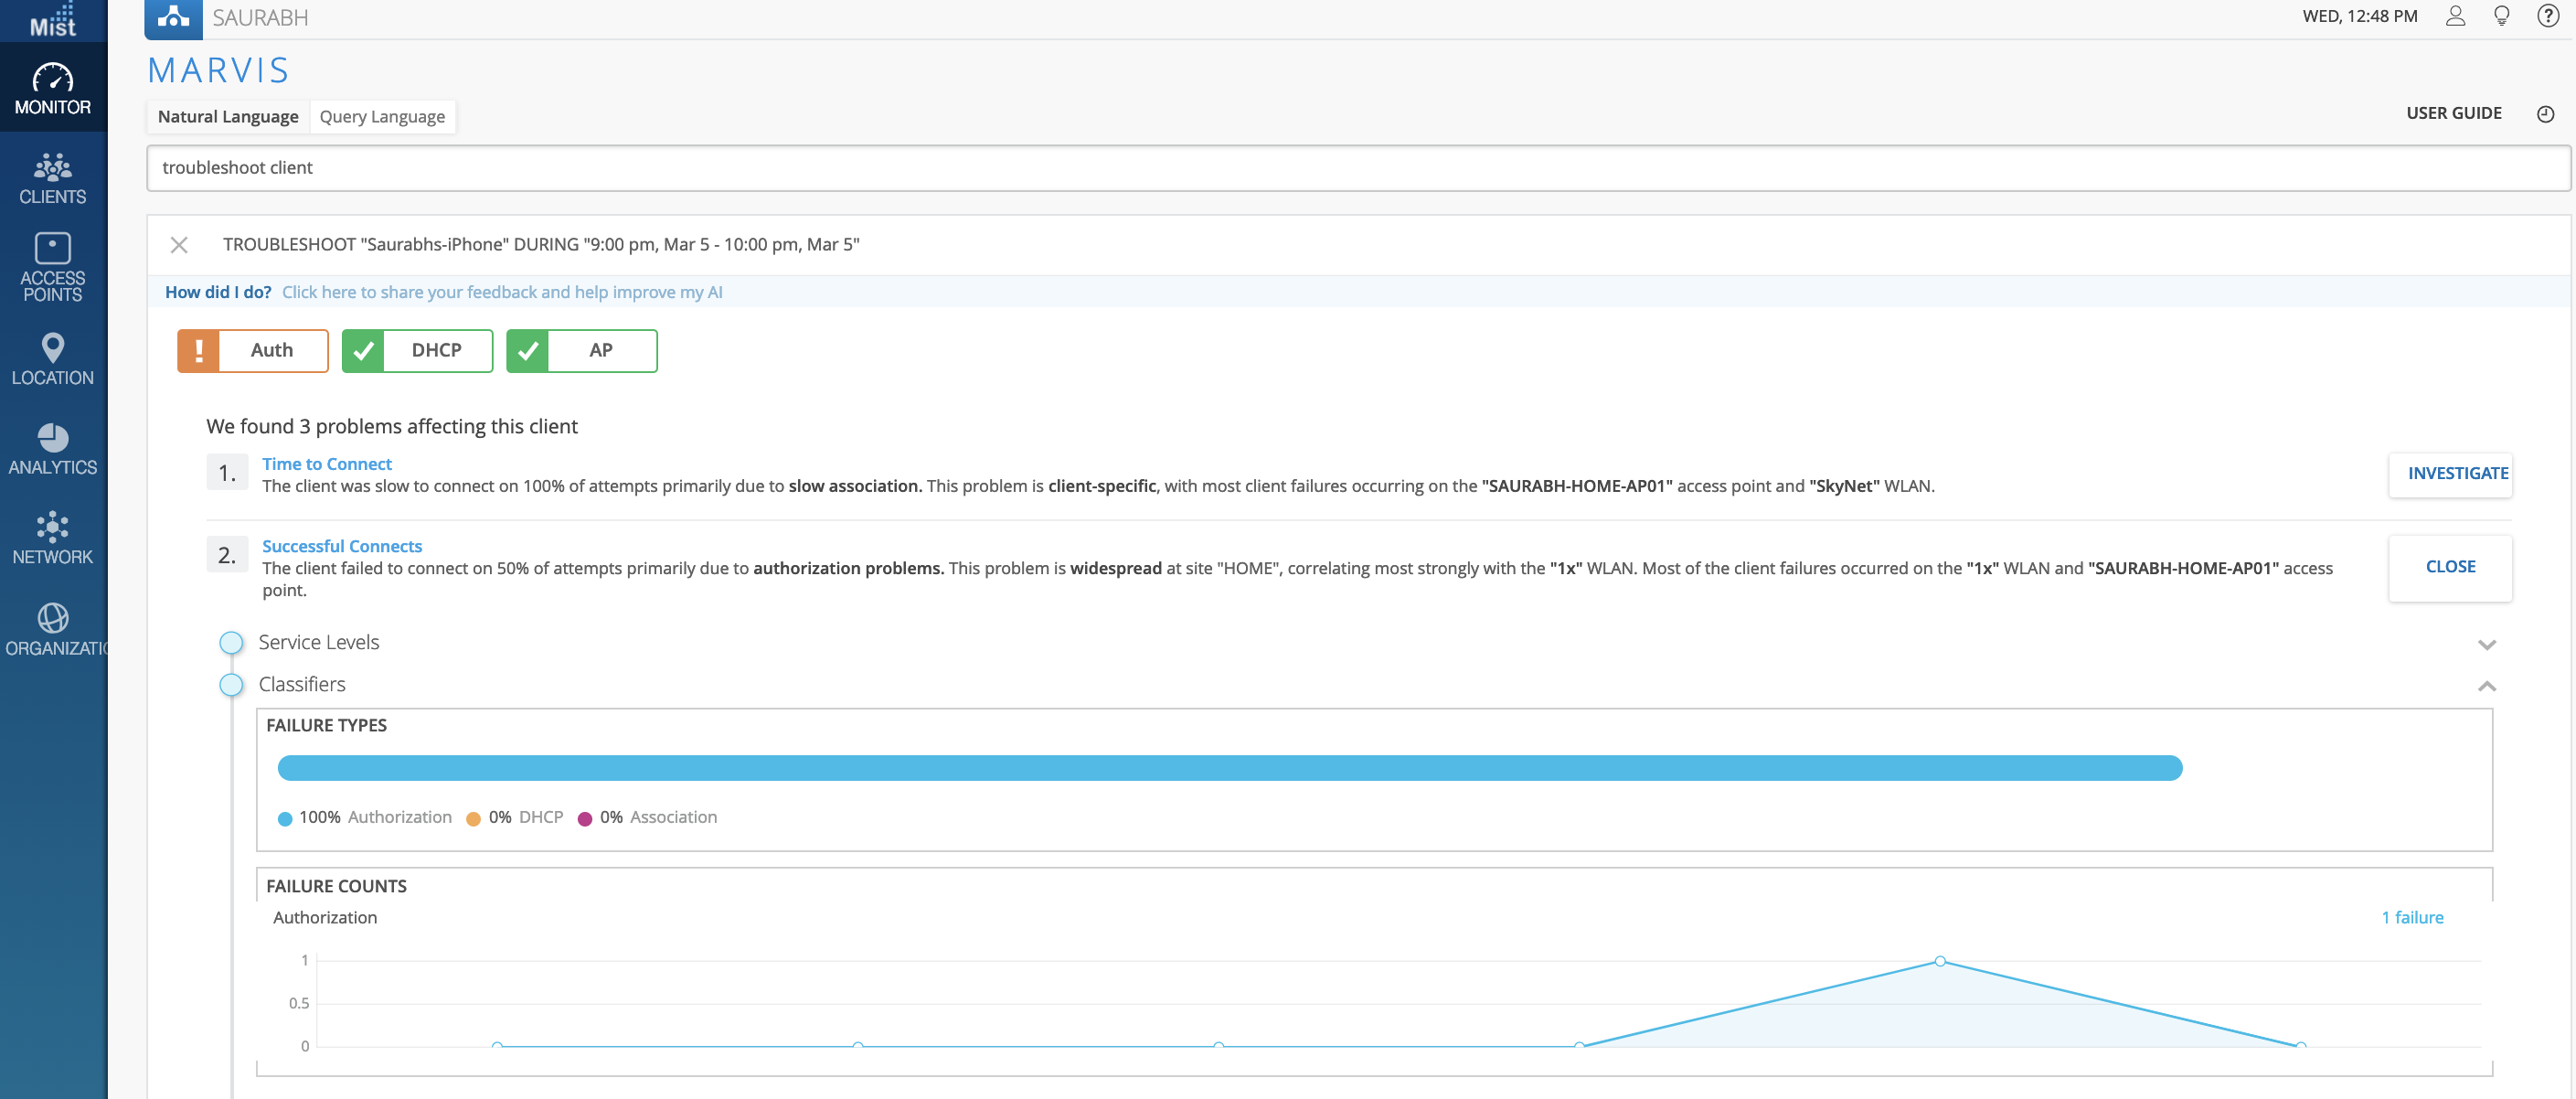
- troubleshoot client 38:78:62:40:de:e5 – This will give you the answer to what is happening to the client for most of the time (The client failed to connect on 100% of attempts primarily due to authorization problems.)
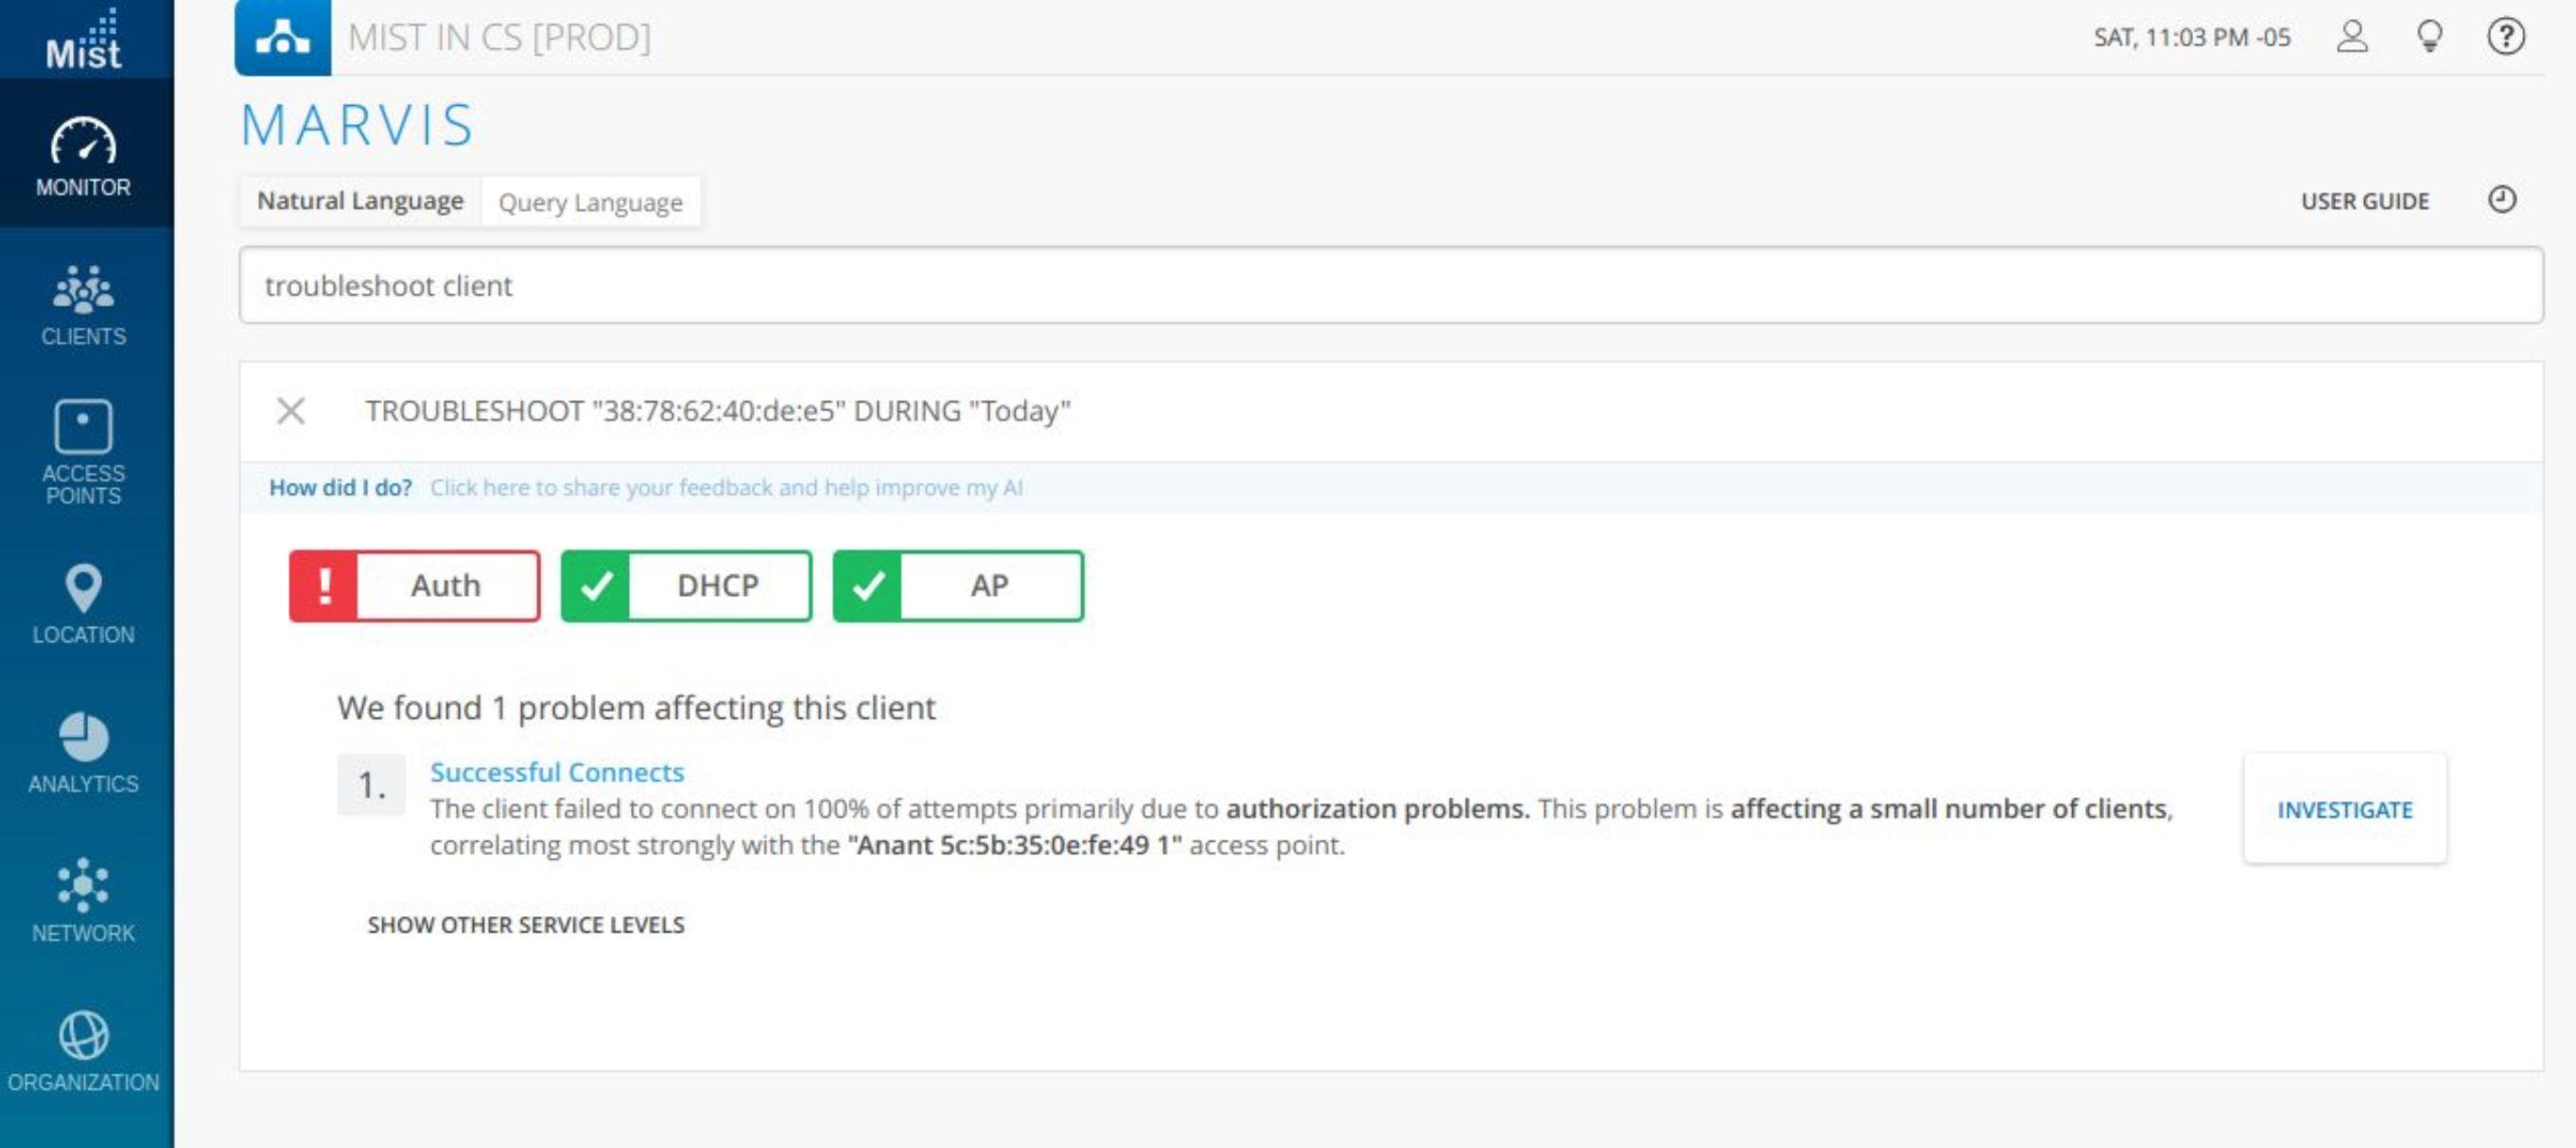
Next step is to click Investigate
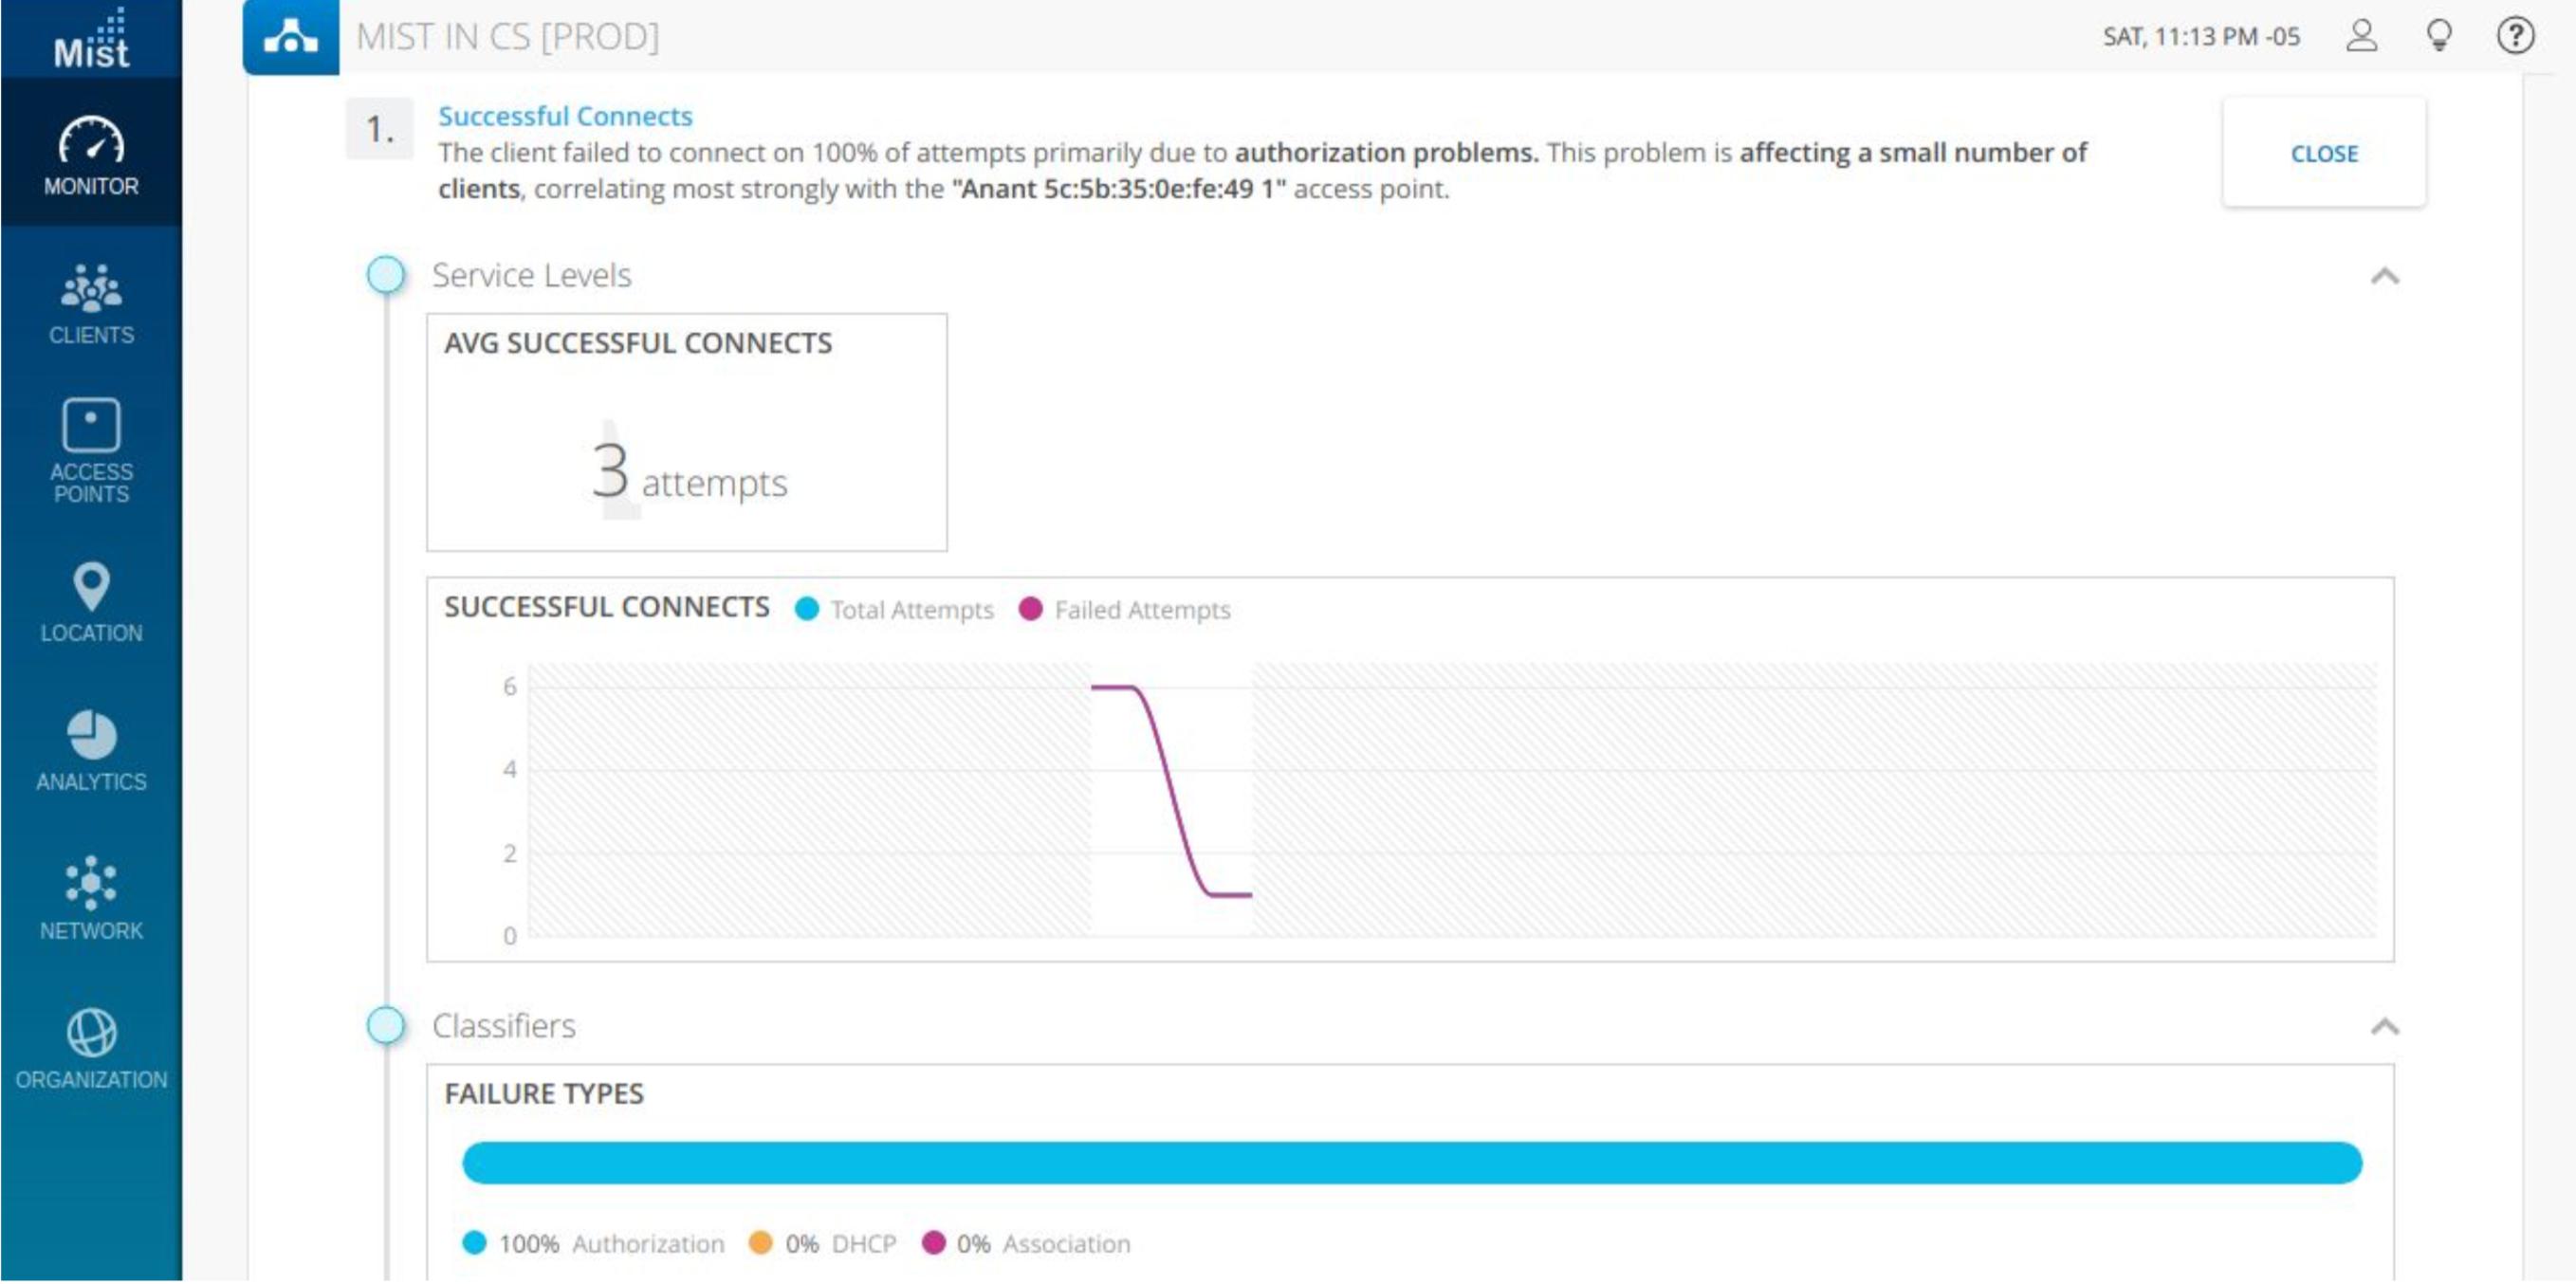
Here you can check
- The Successful connects – Gives information related to number of attempts and failure graph related to your client
- Classifier – Gives the type and count of failure type (Authorization in this case)
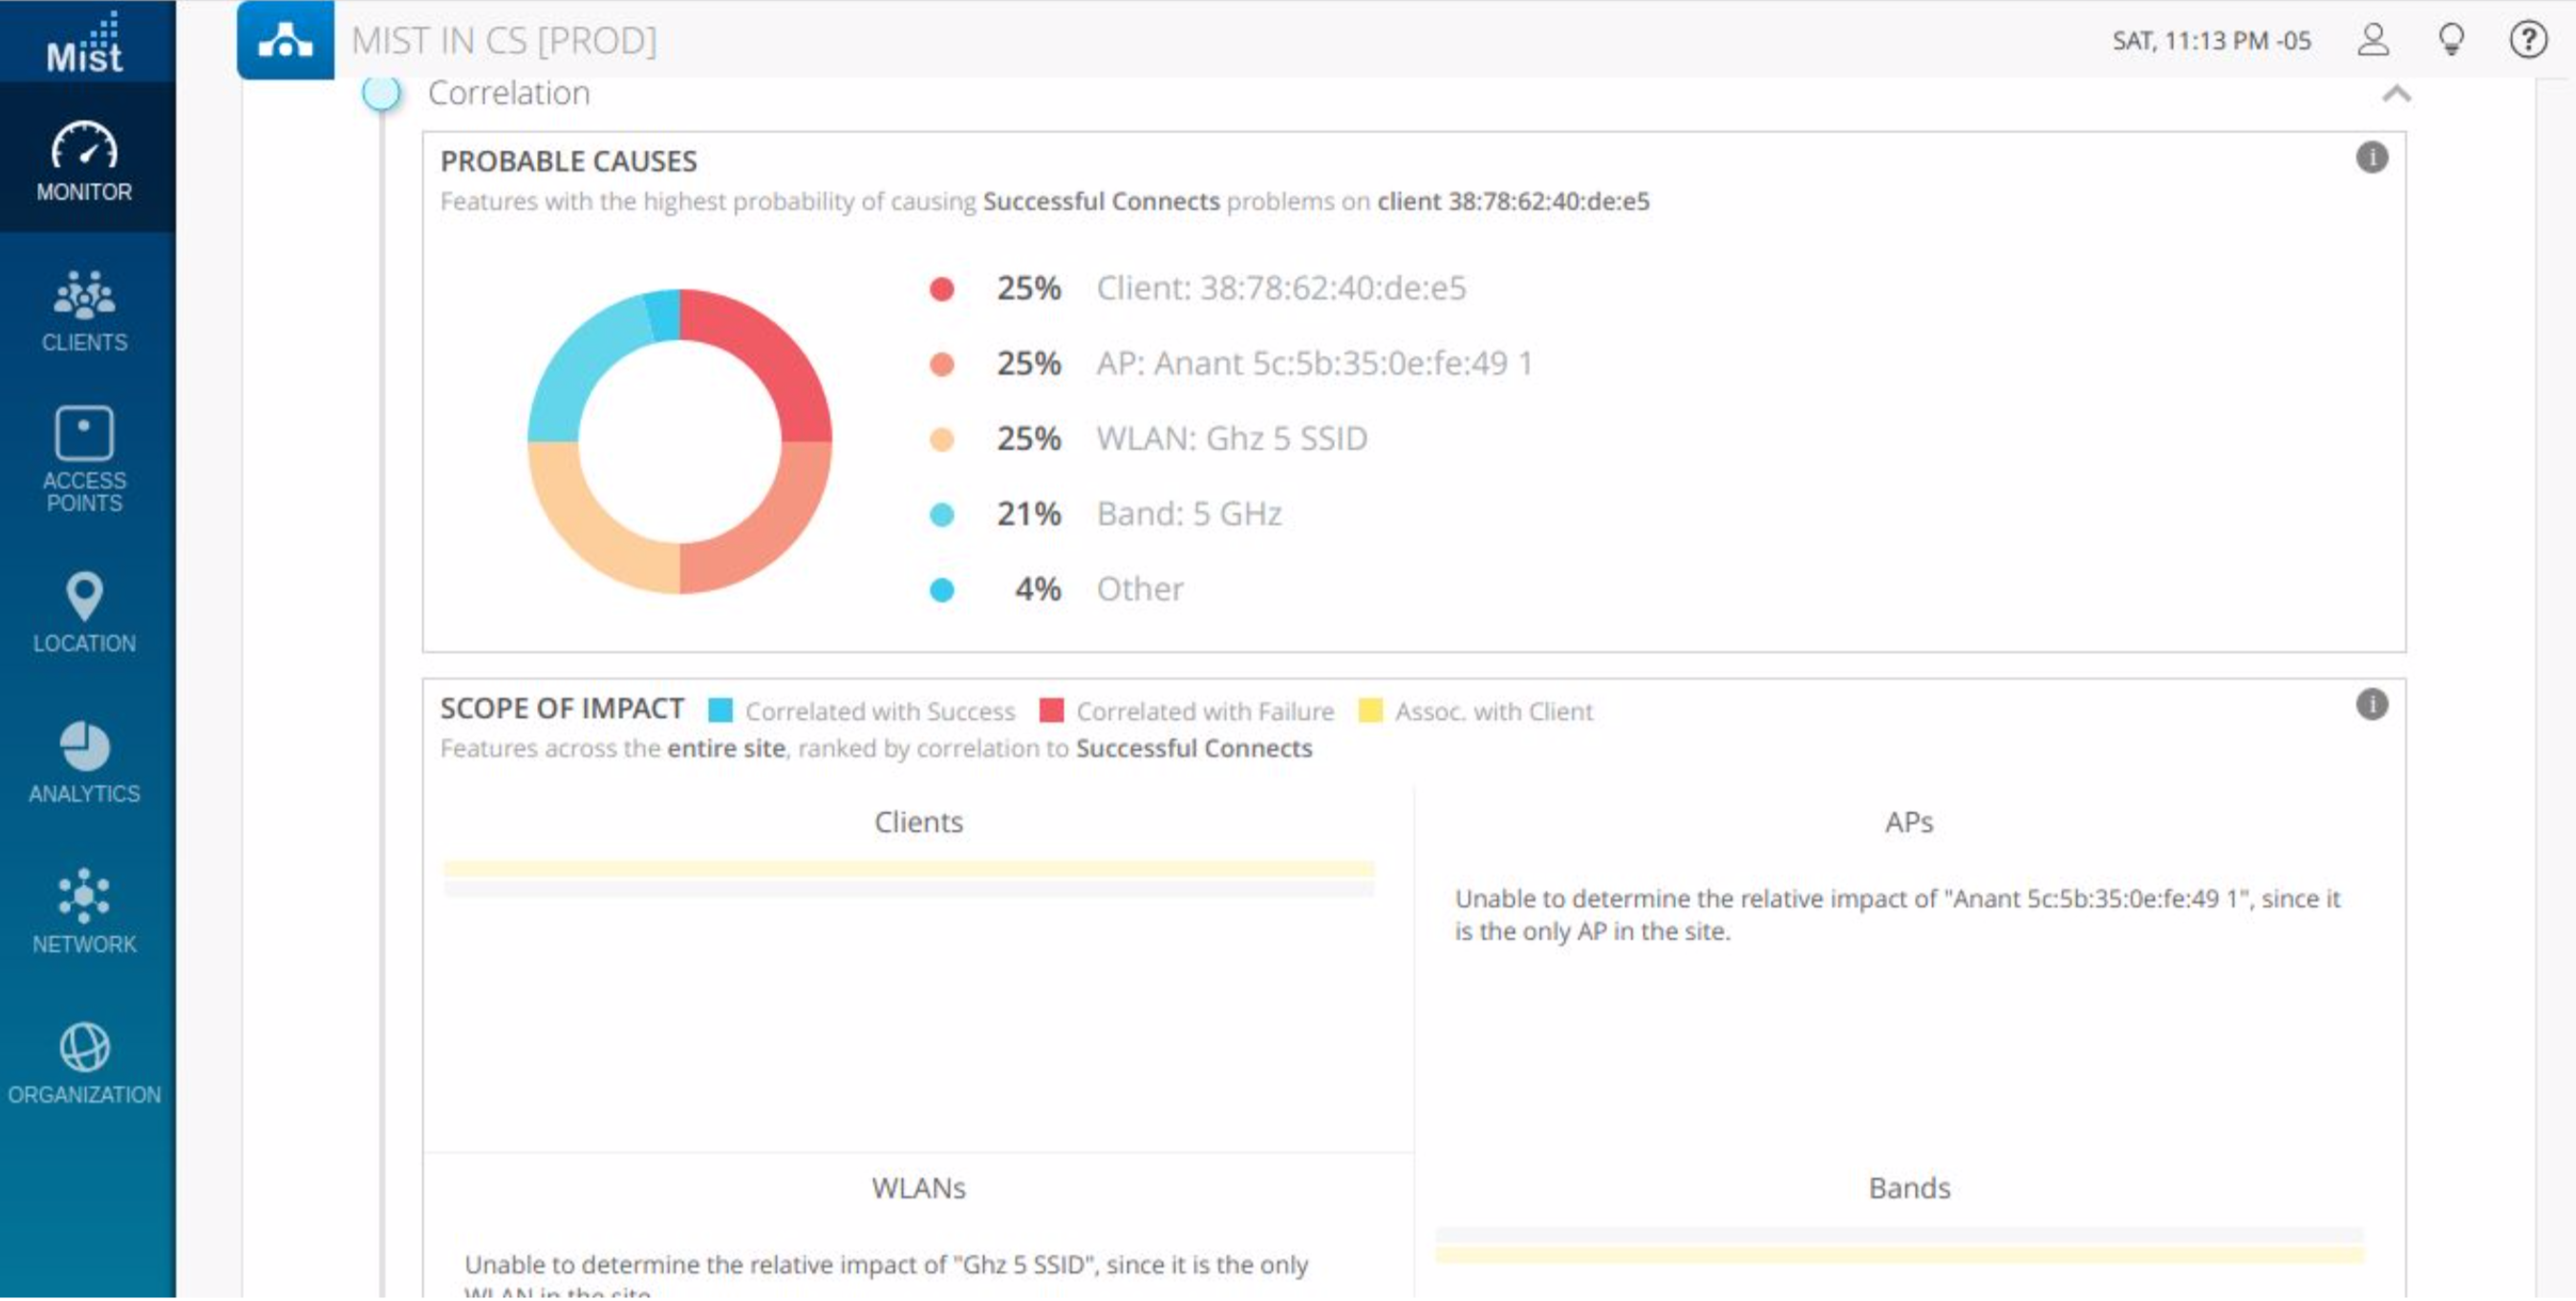
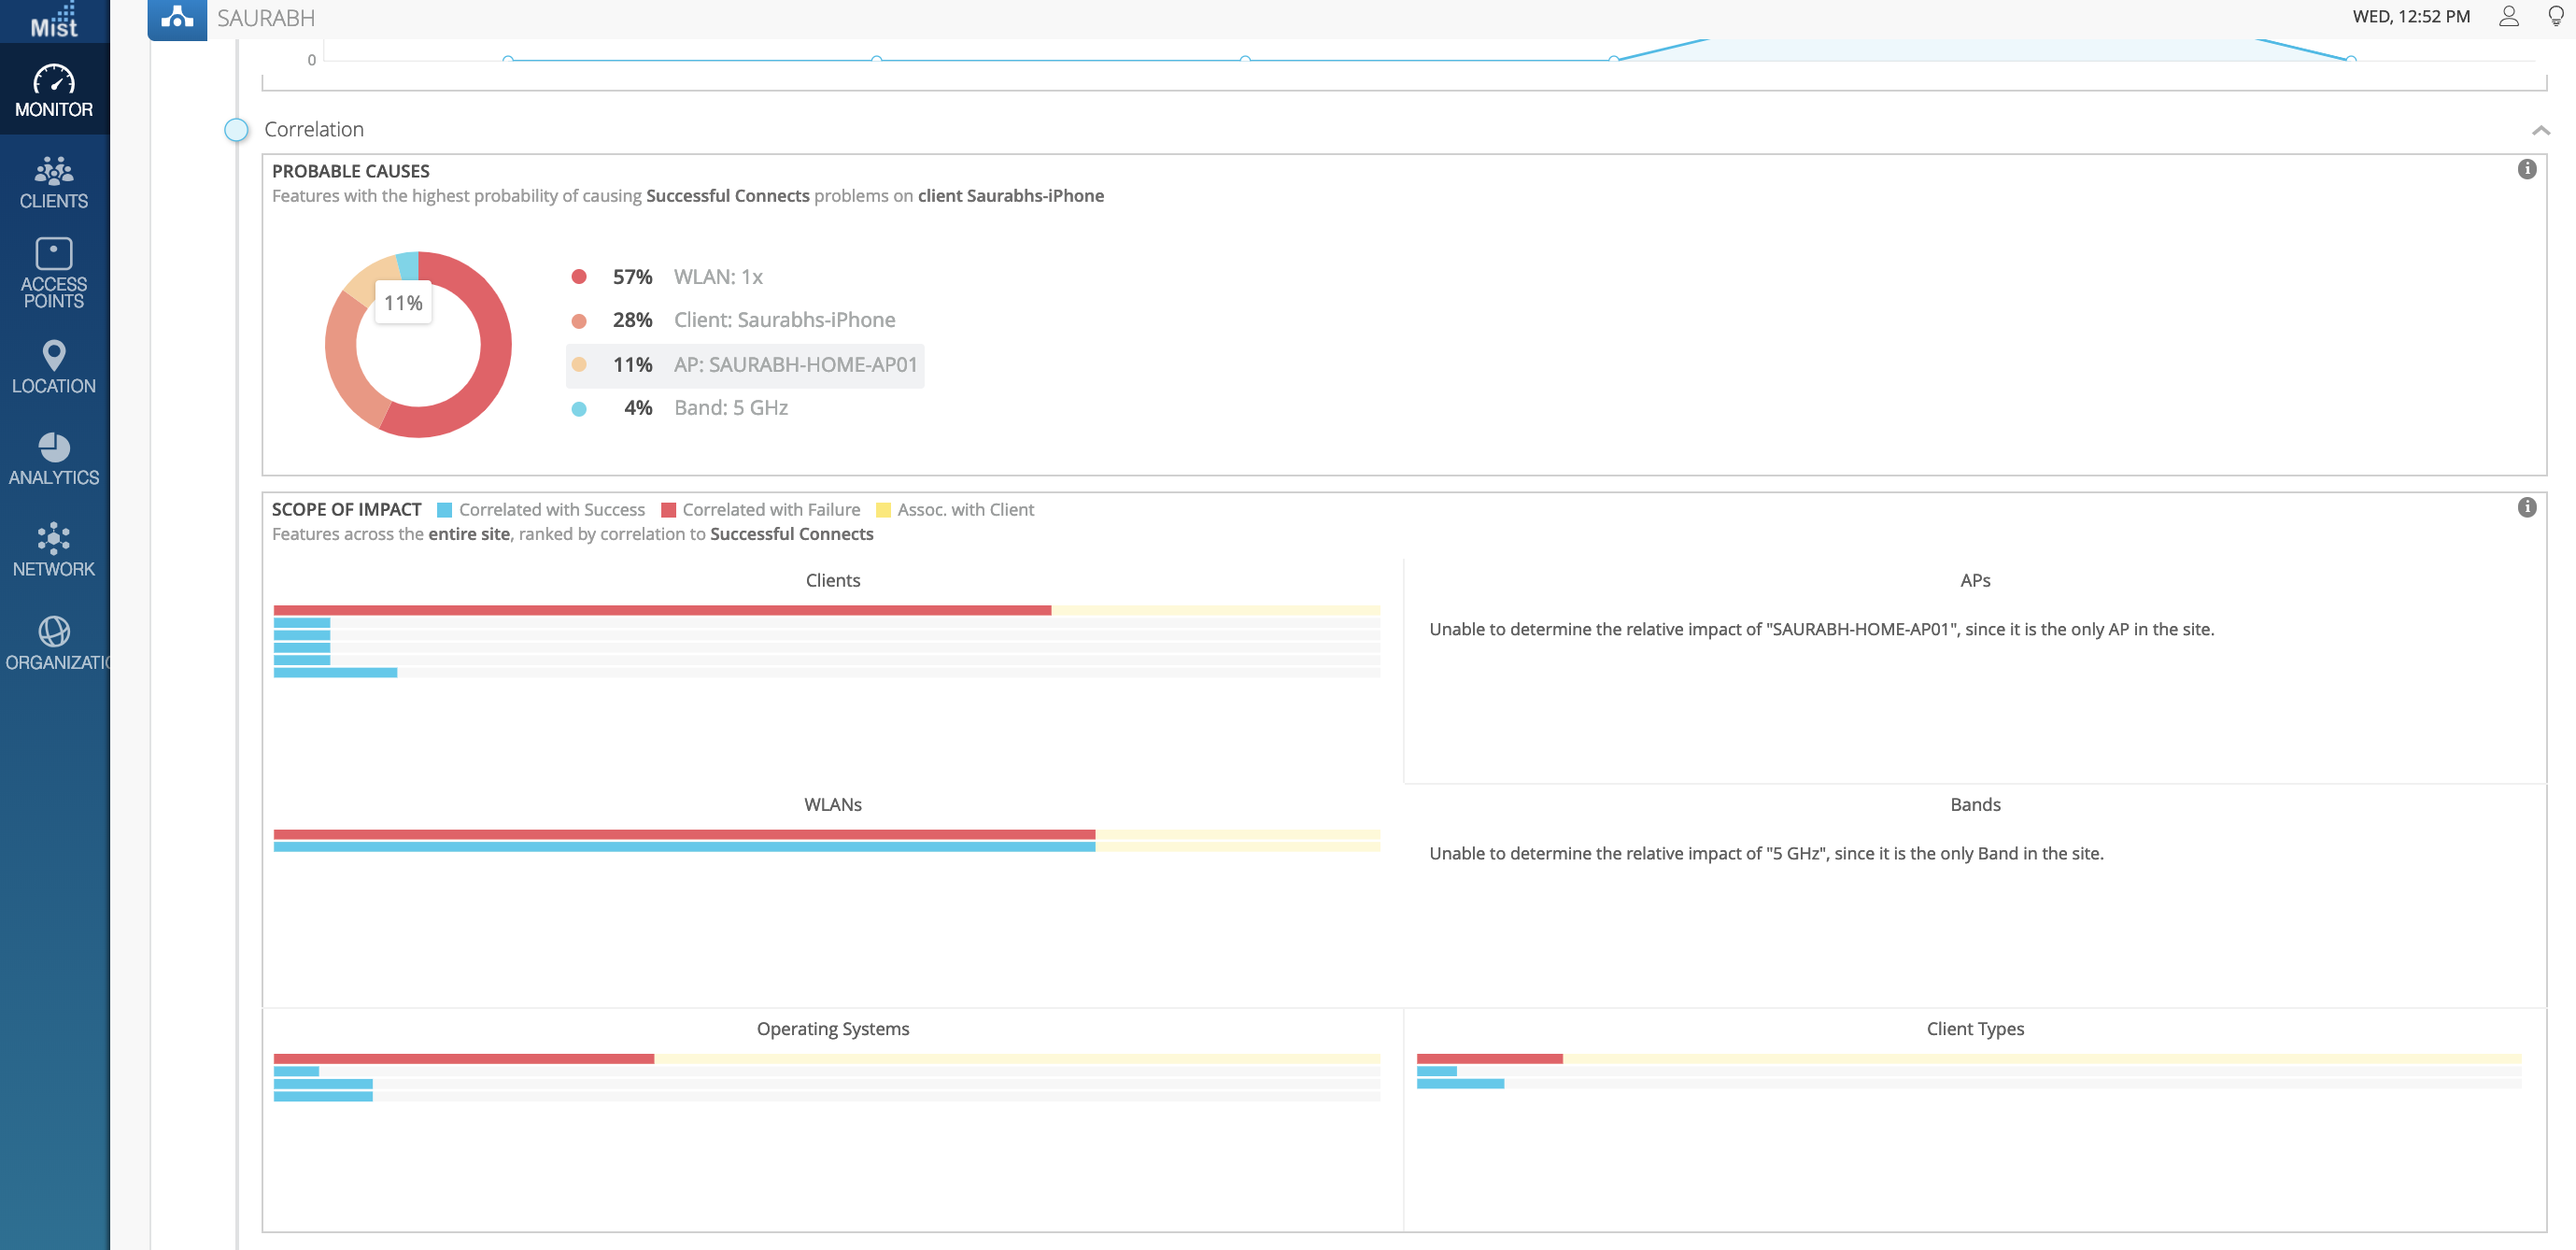
Correlation
Gives you the SCOPE OF IMPACT talks about the Mac address of client, on which SSID on which band it was trying to connect and fails
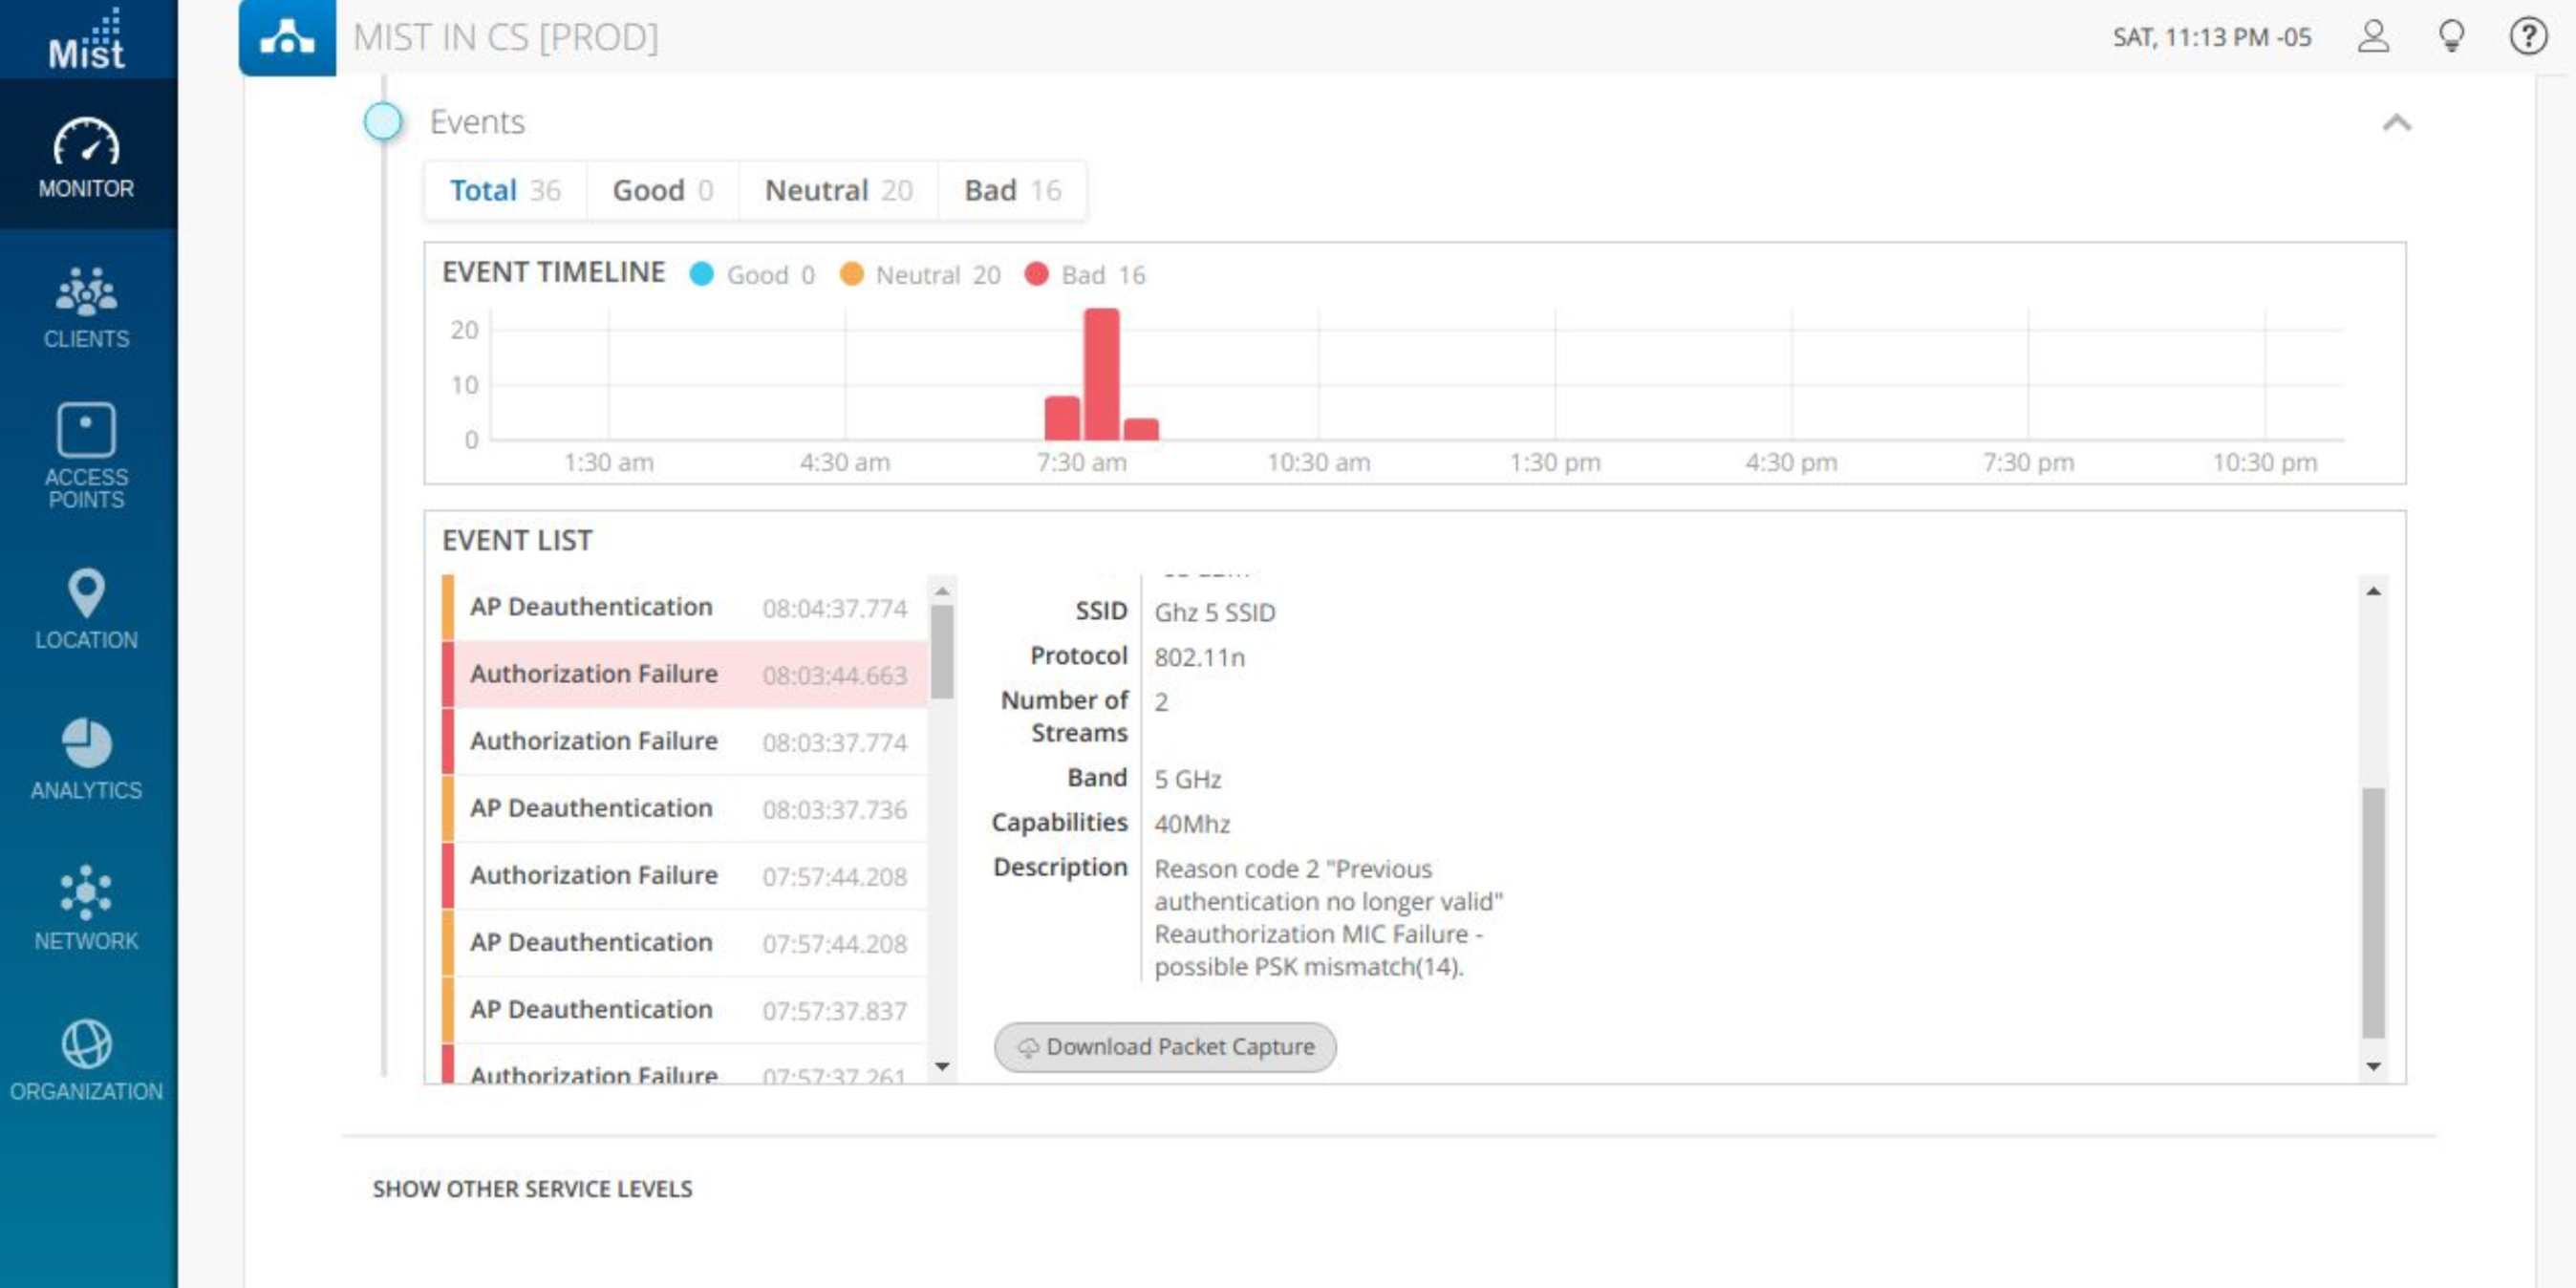
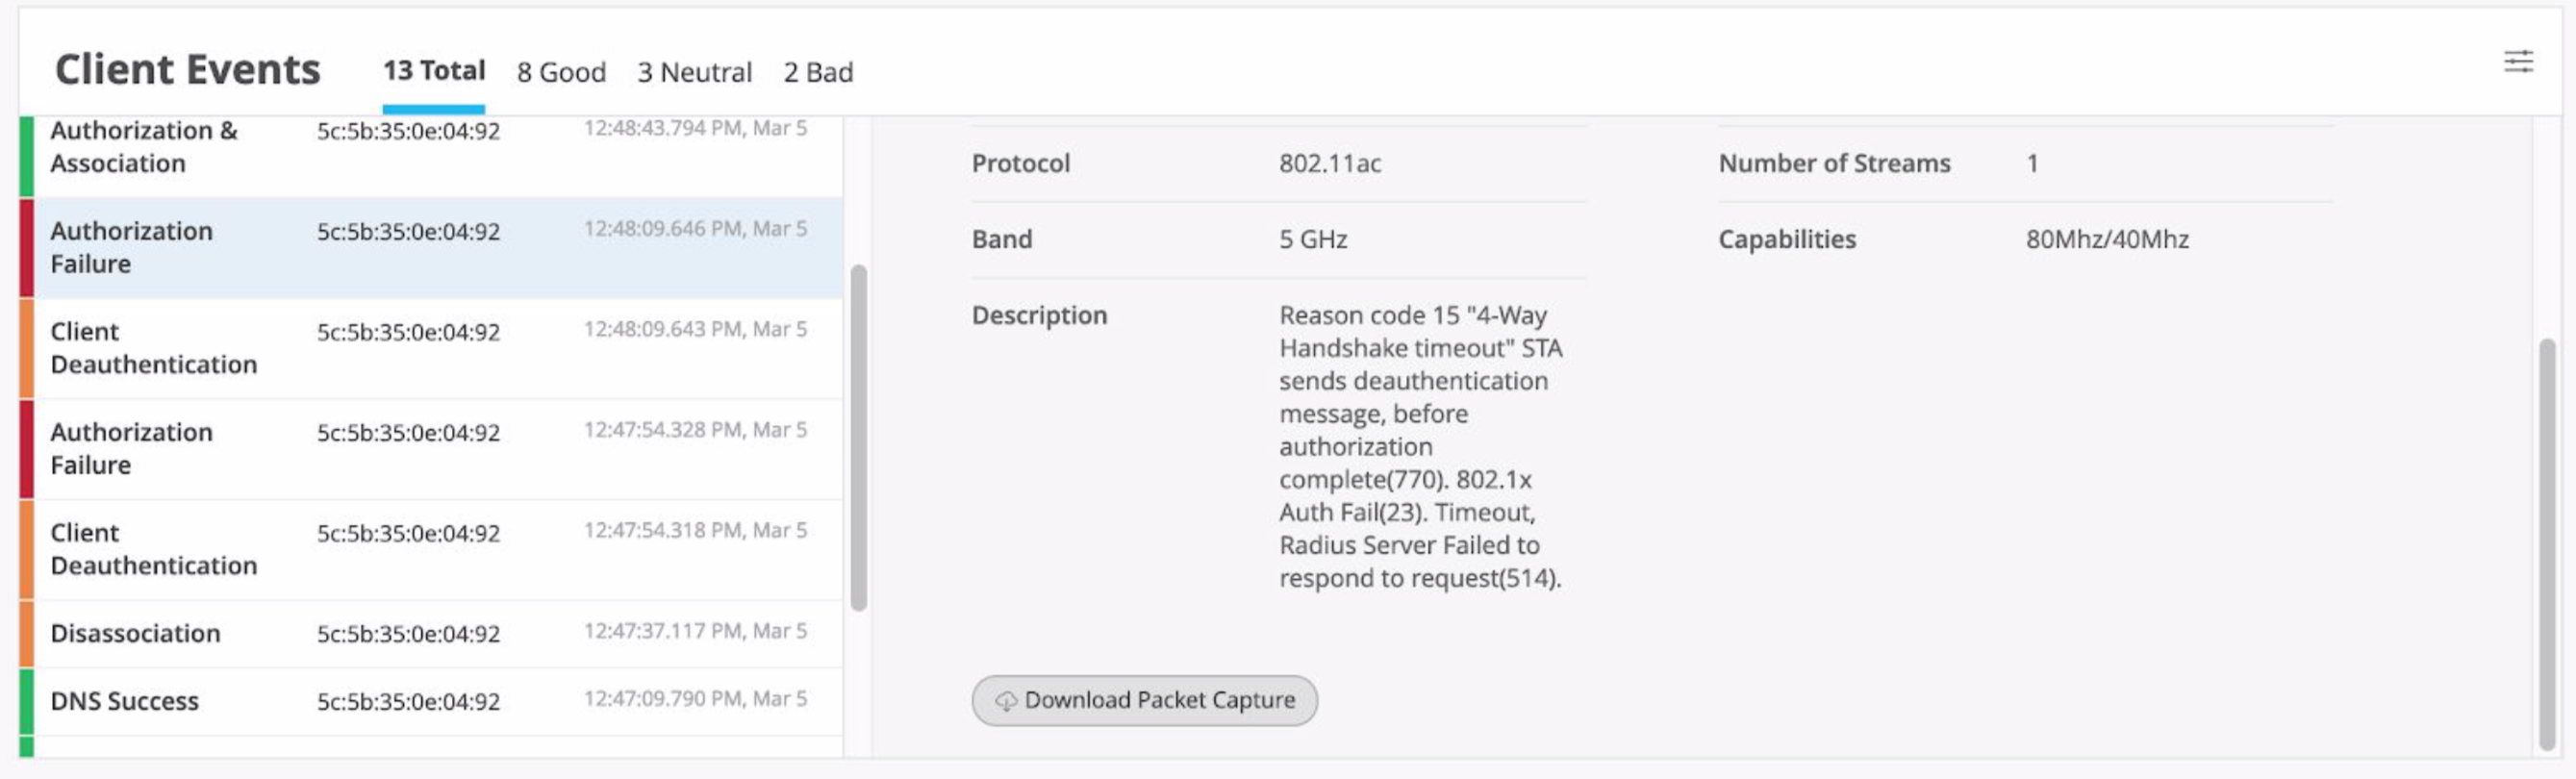
 Events
Give you the Good or Bad events related to the client, where you can always download the dynamic PCAPs for the bad events that occurred.
If you have not purchased the VNA subscriptions
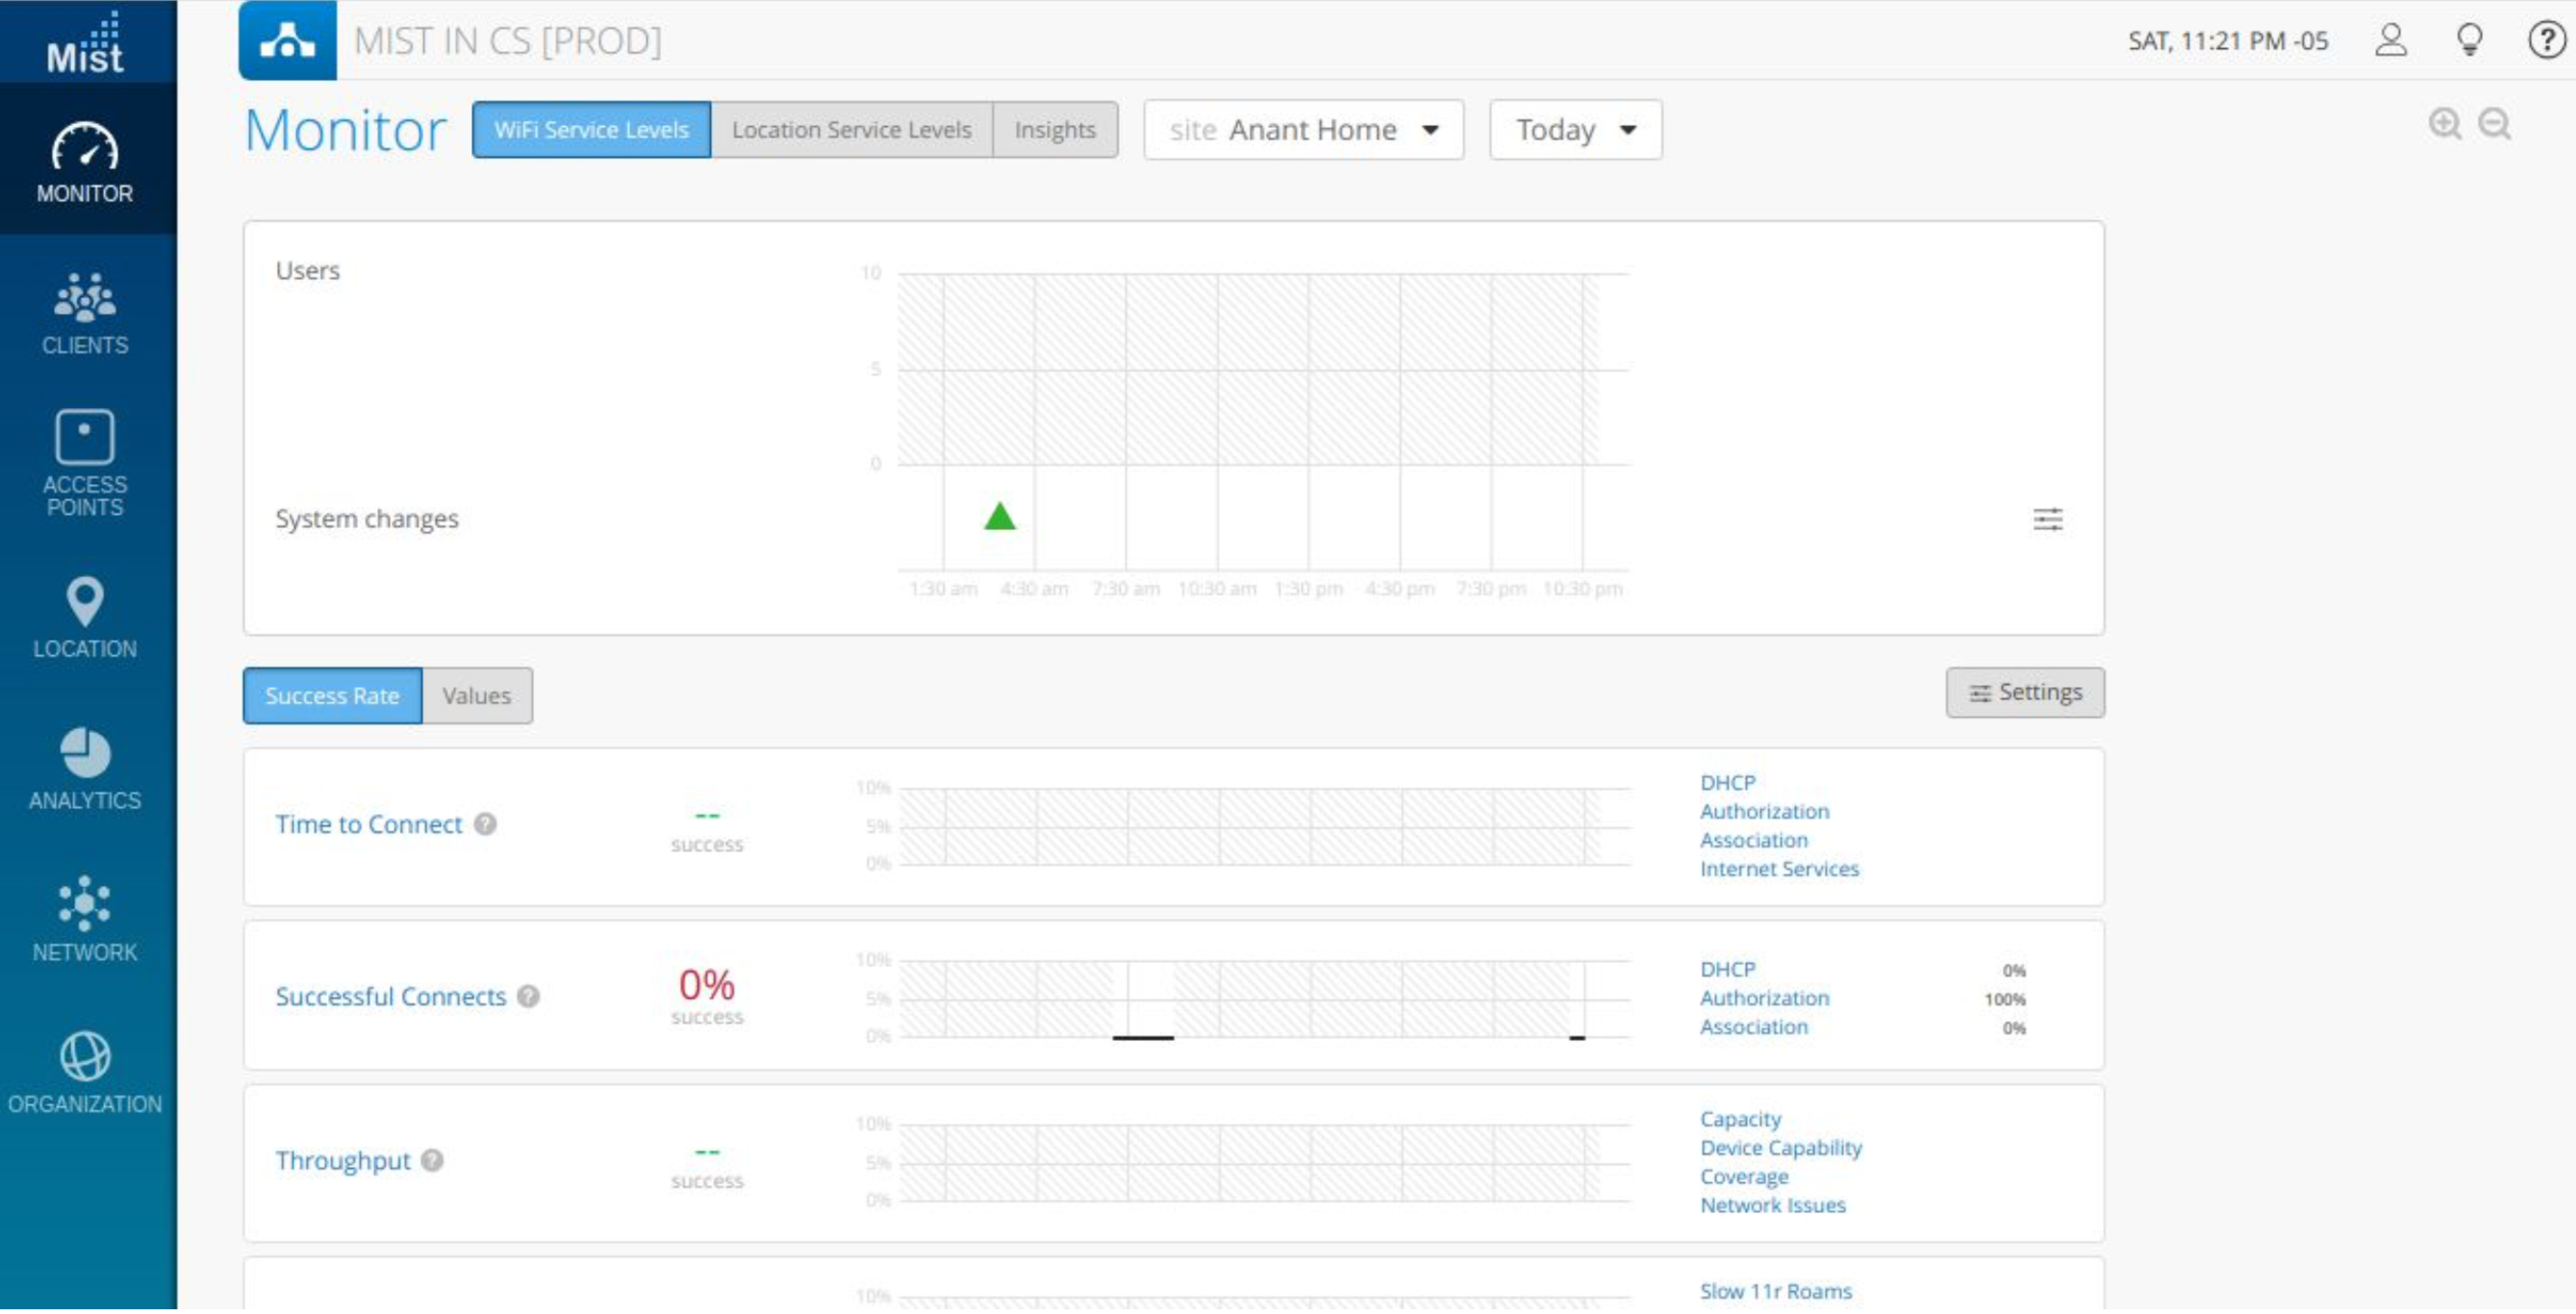
Go to Monitor Page → Wifi SLE→ Check which SLE is tapering down for a particular time period in the graph (In our case it is basically Successful connect).
Now you know that successful connect graph is tapering down for the site in example, this decrease in ‘Success Rate’ can be because of:
- DHCP issue
- Authorization
- Association
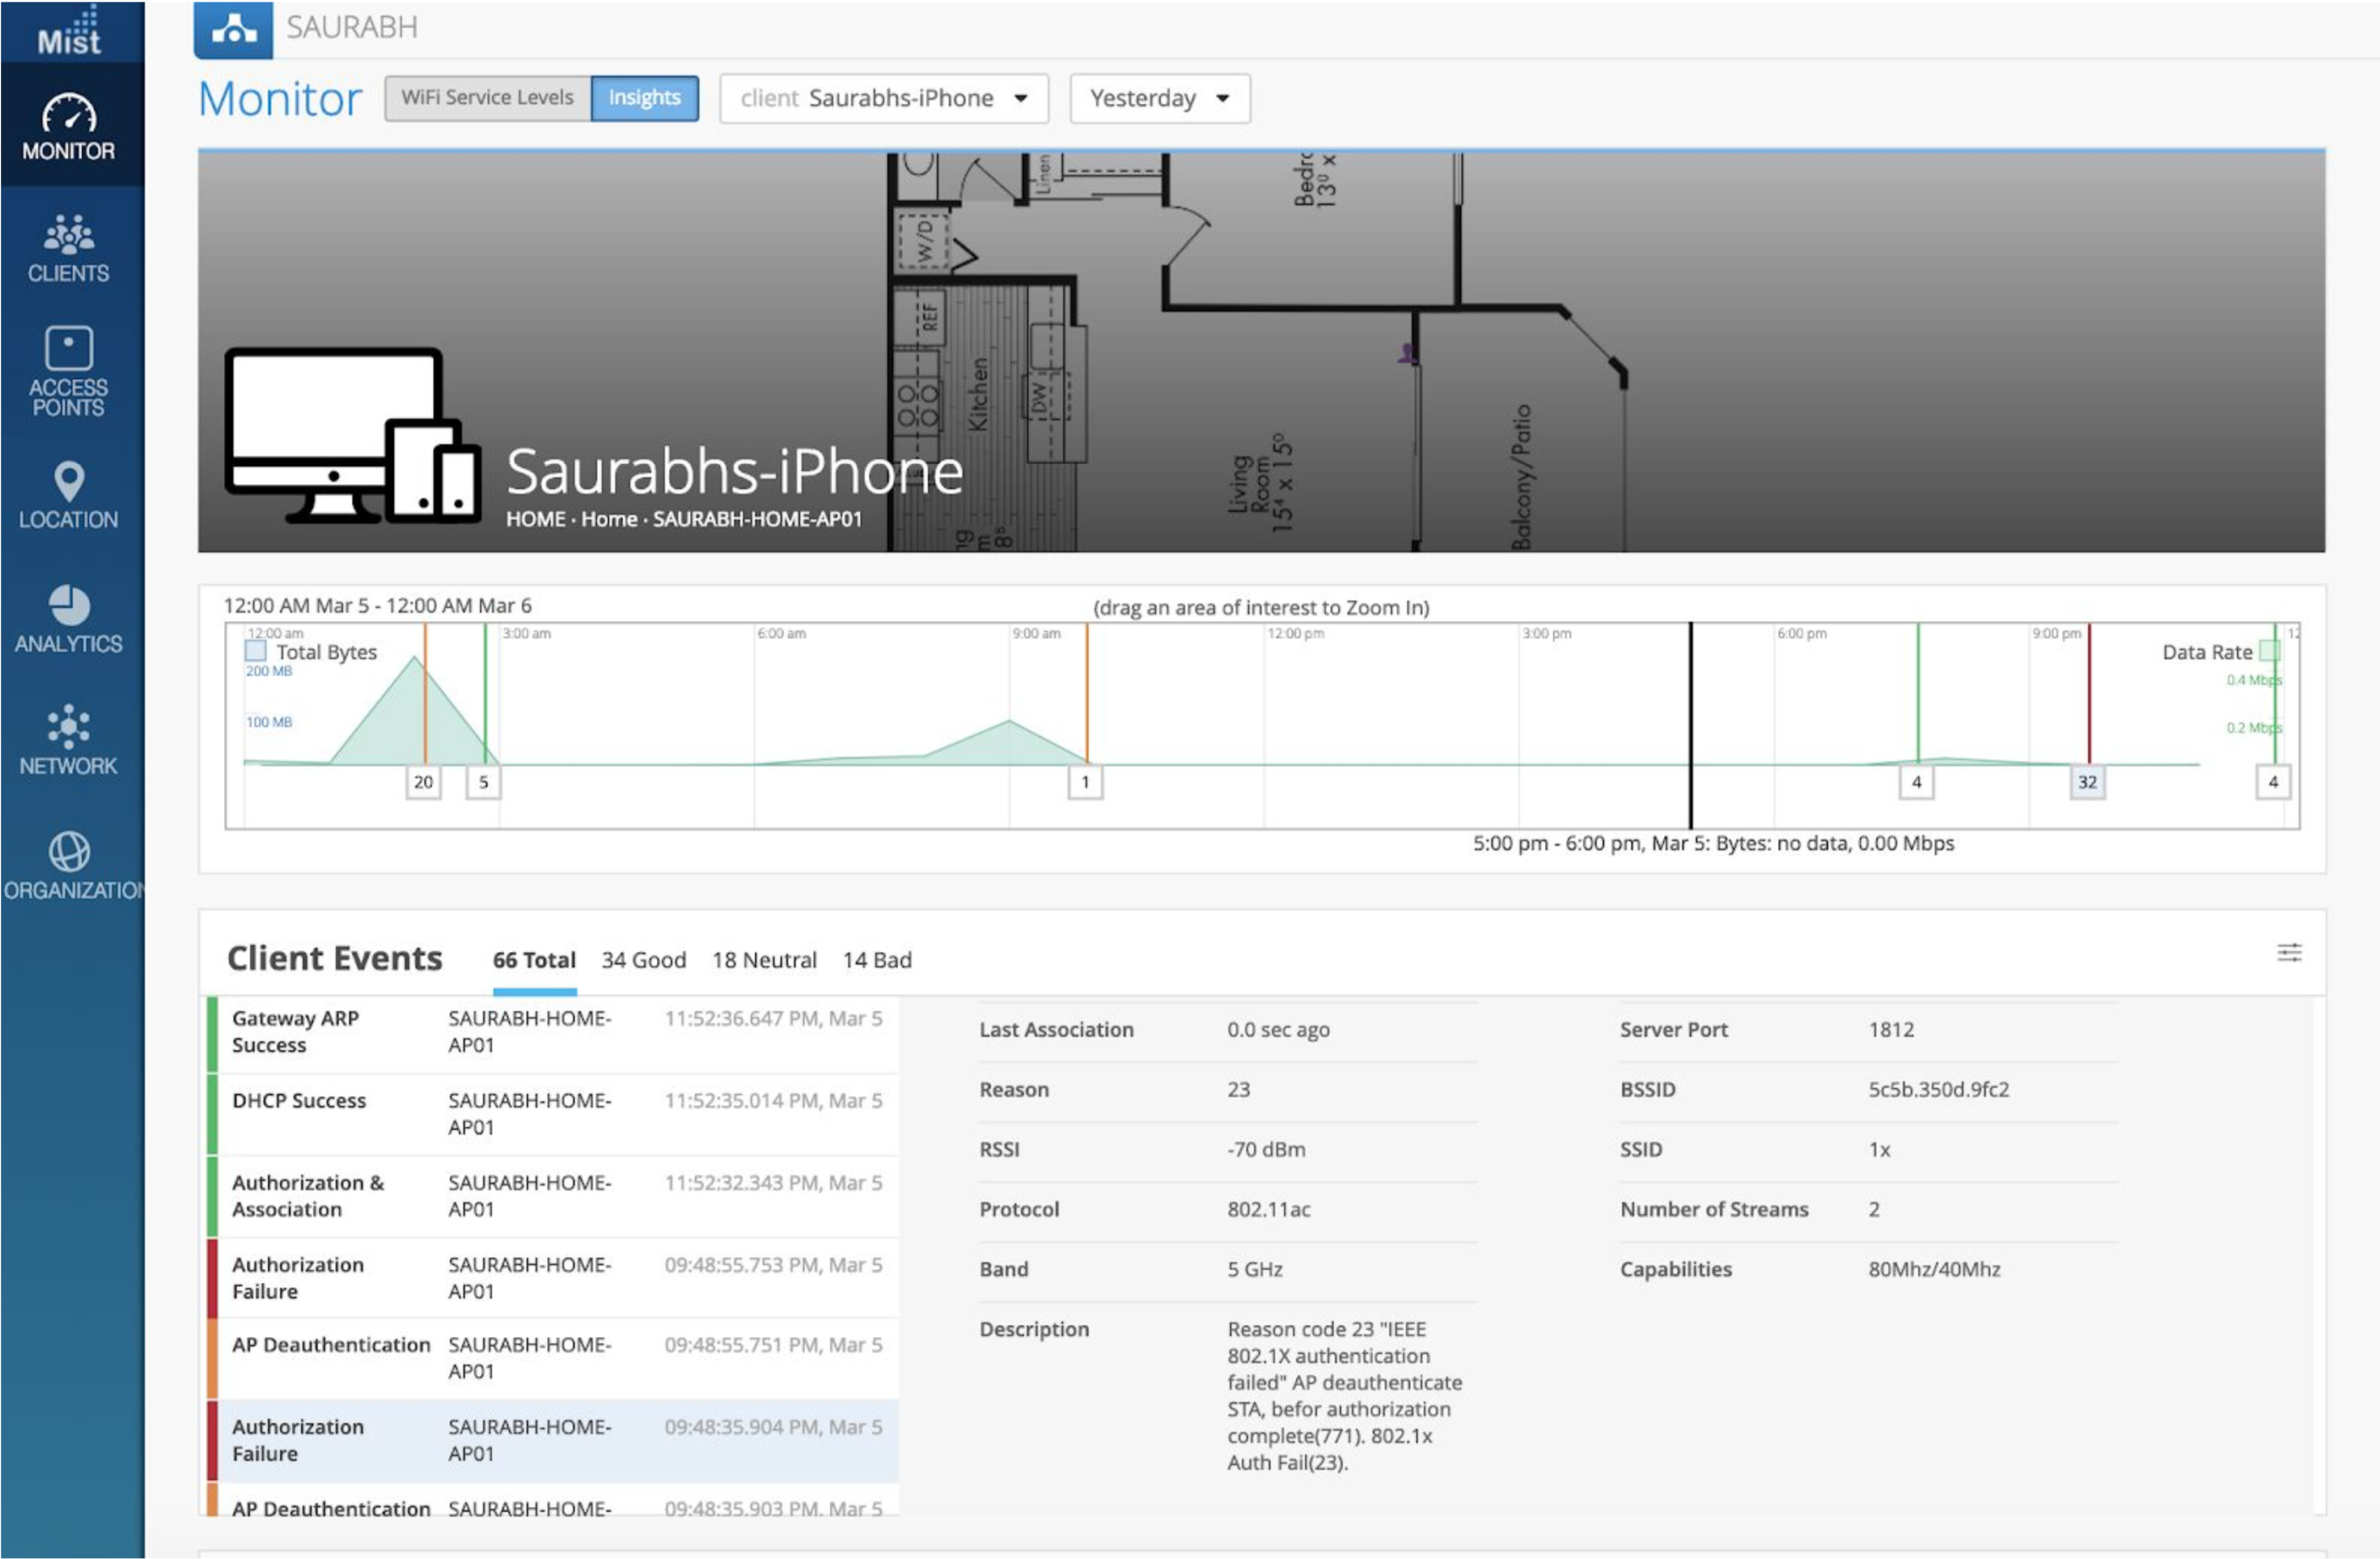
In the below example successful connect is 0% and what is contributing for it’s 0% is due to 100% authorization.
Click on Successful connect→ Click on the classifier→ Go to affected Item and check for impacted Clients and Access Points
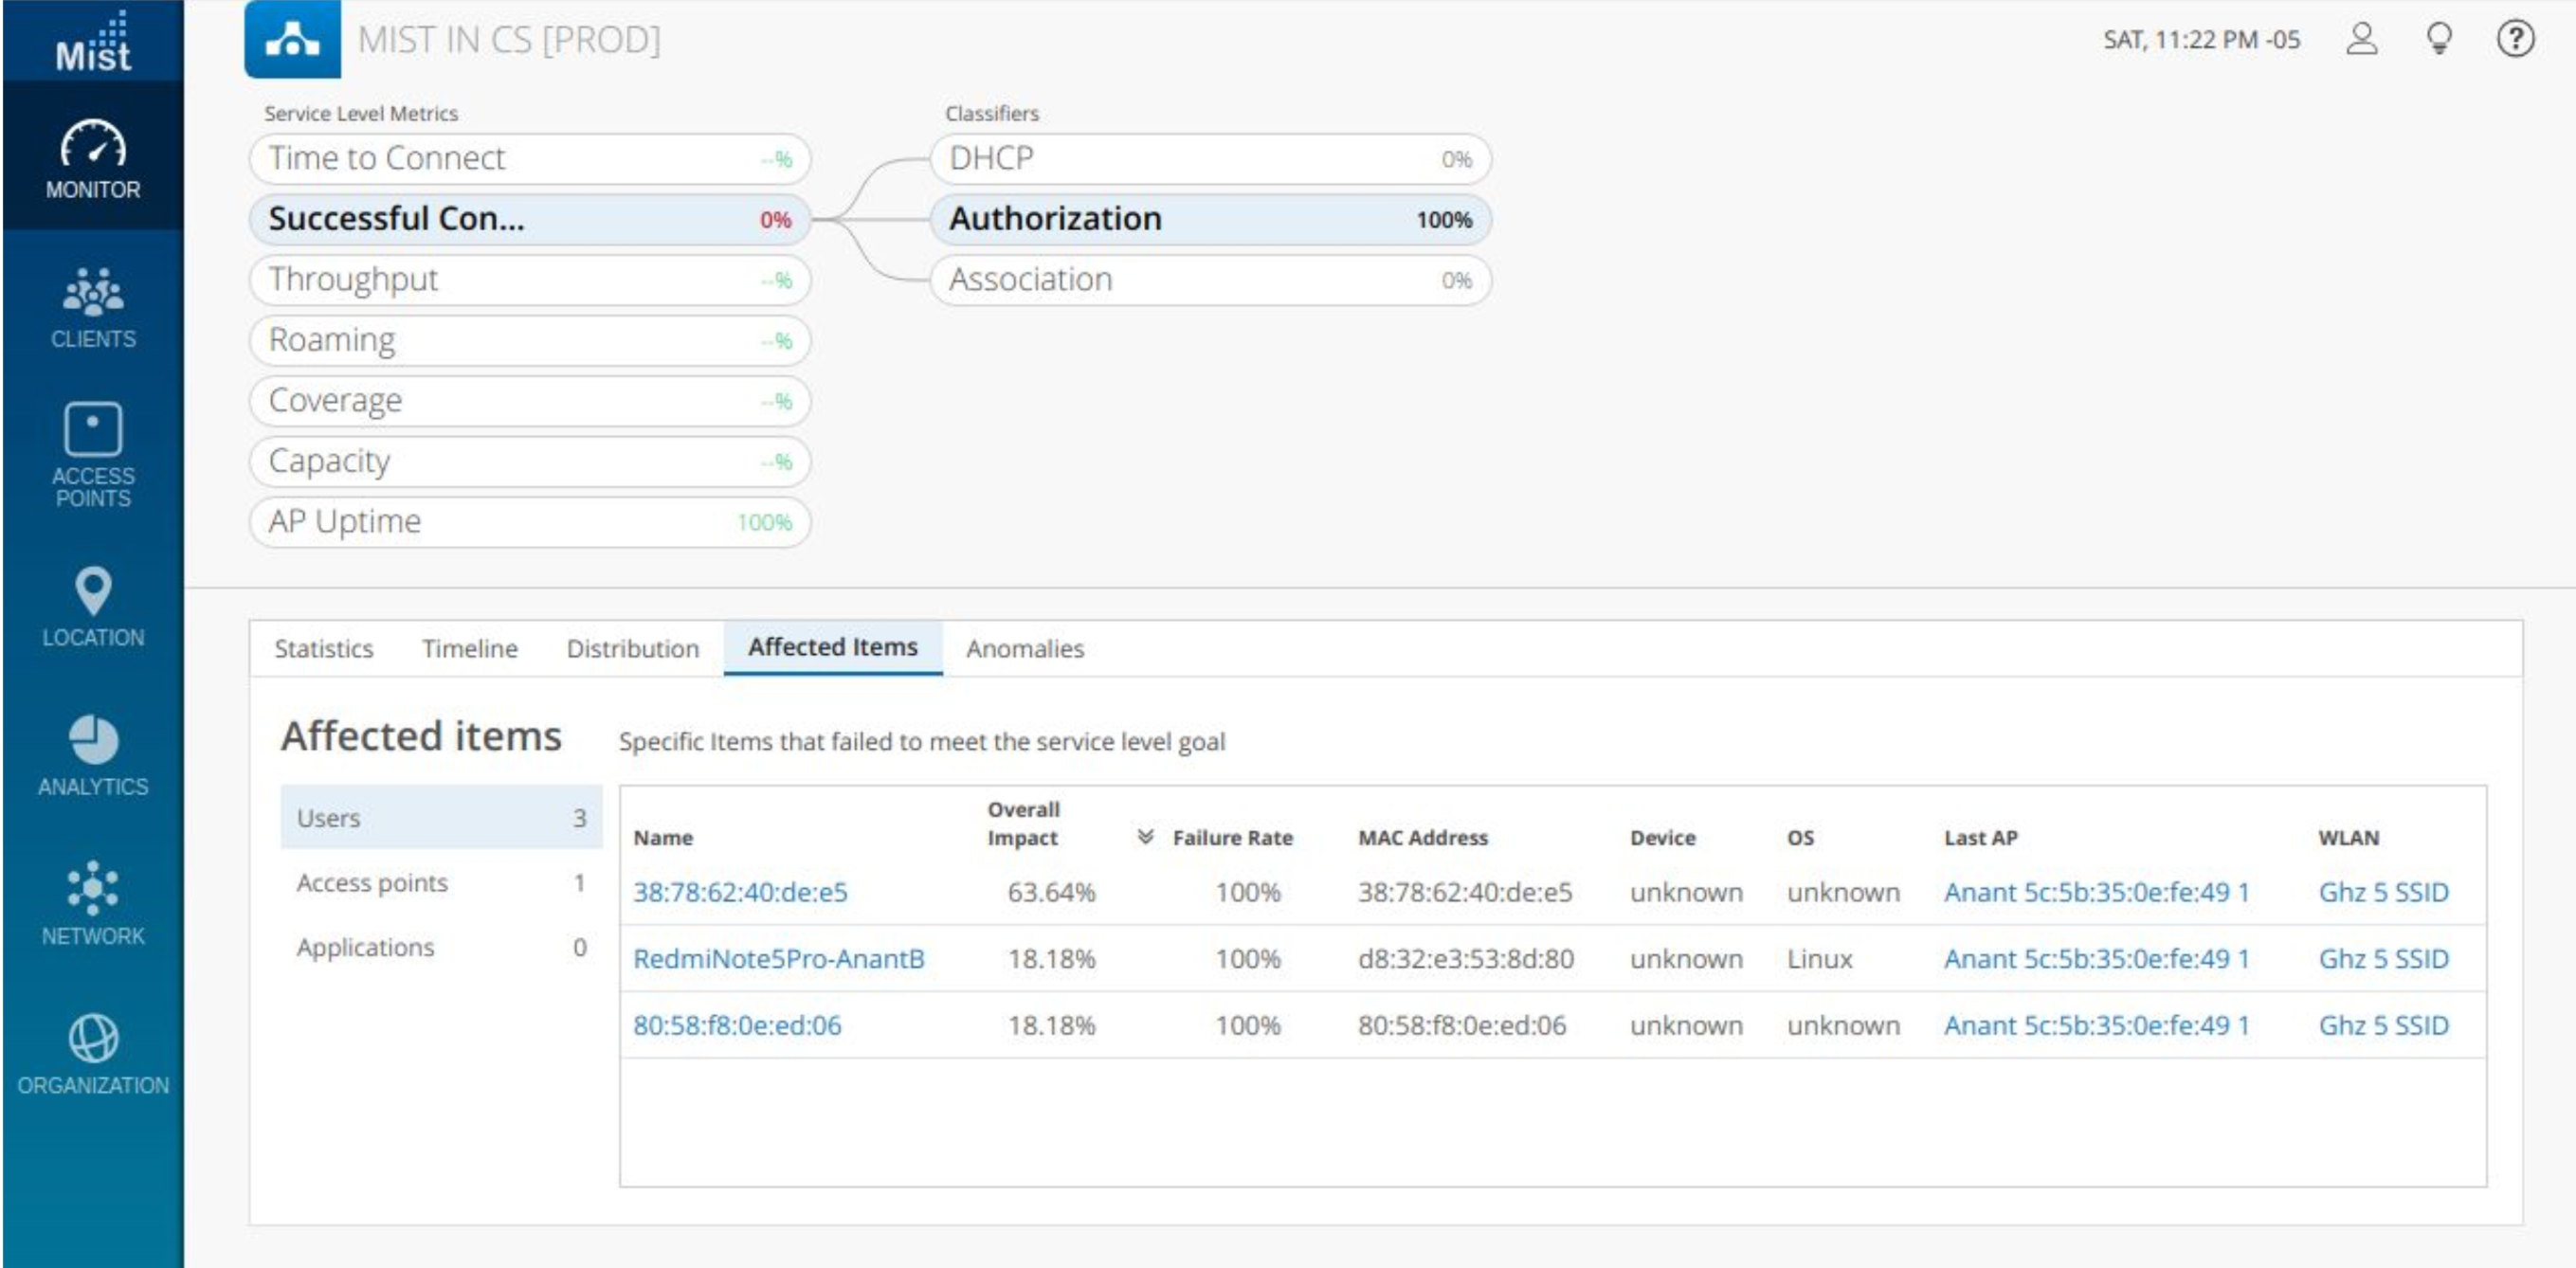
Click the MAC address of client to view insights and the summary of failure. It will take you to Client Events and you can check during the time period when the user was affected.
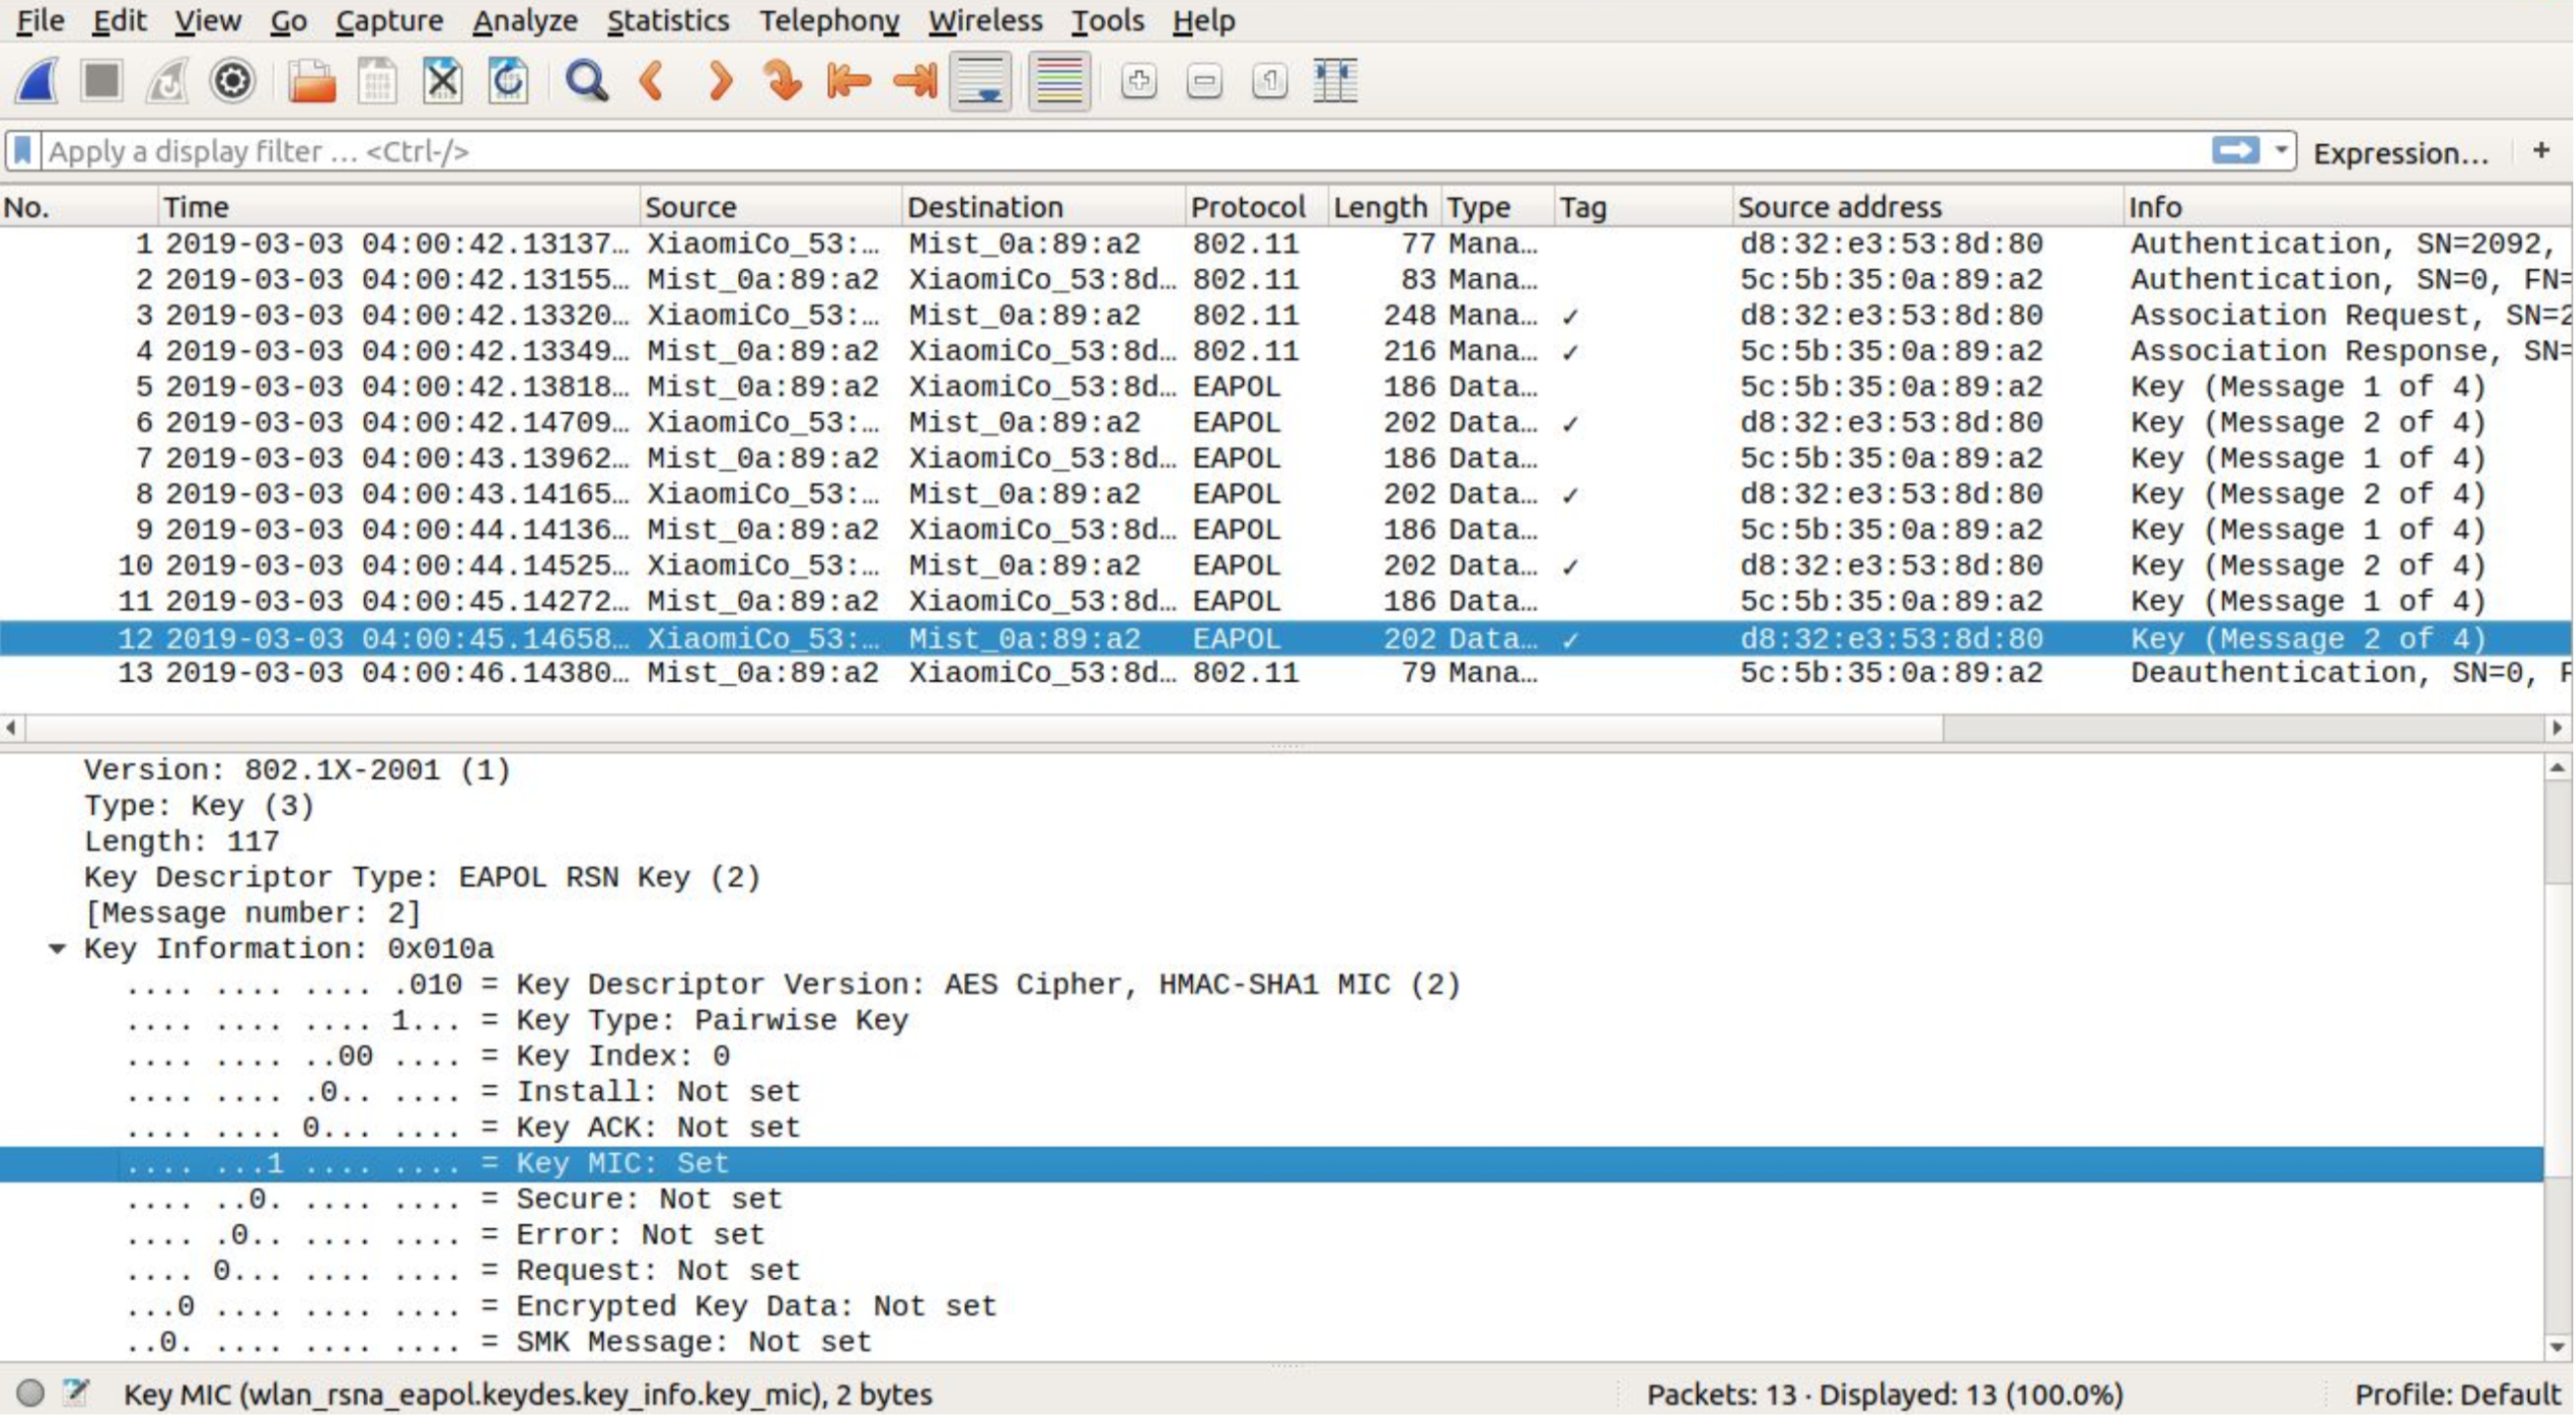
Also one can download the dynamic PCAPs for Bad events to do further analysis.
Failing to get IP address and/or not able to browse
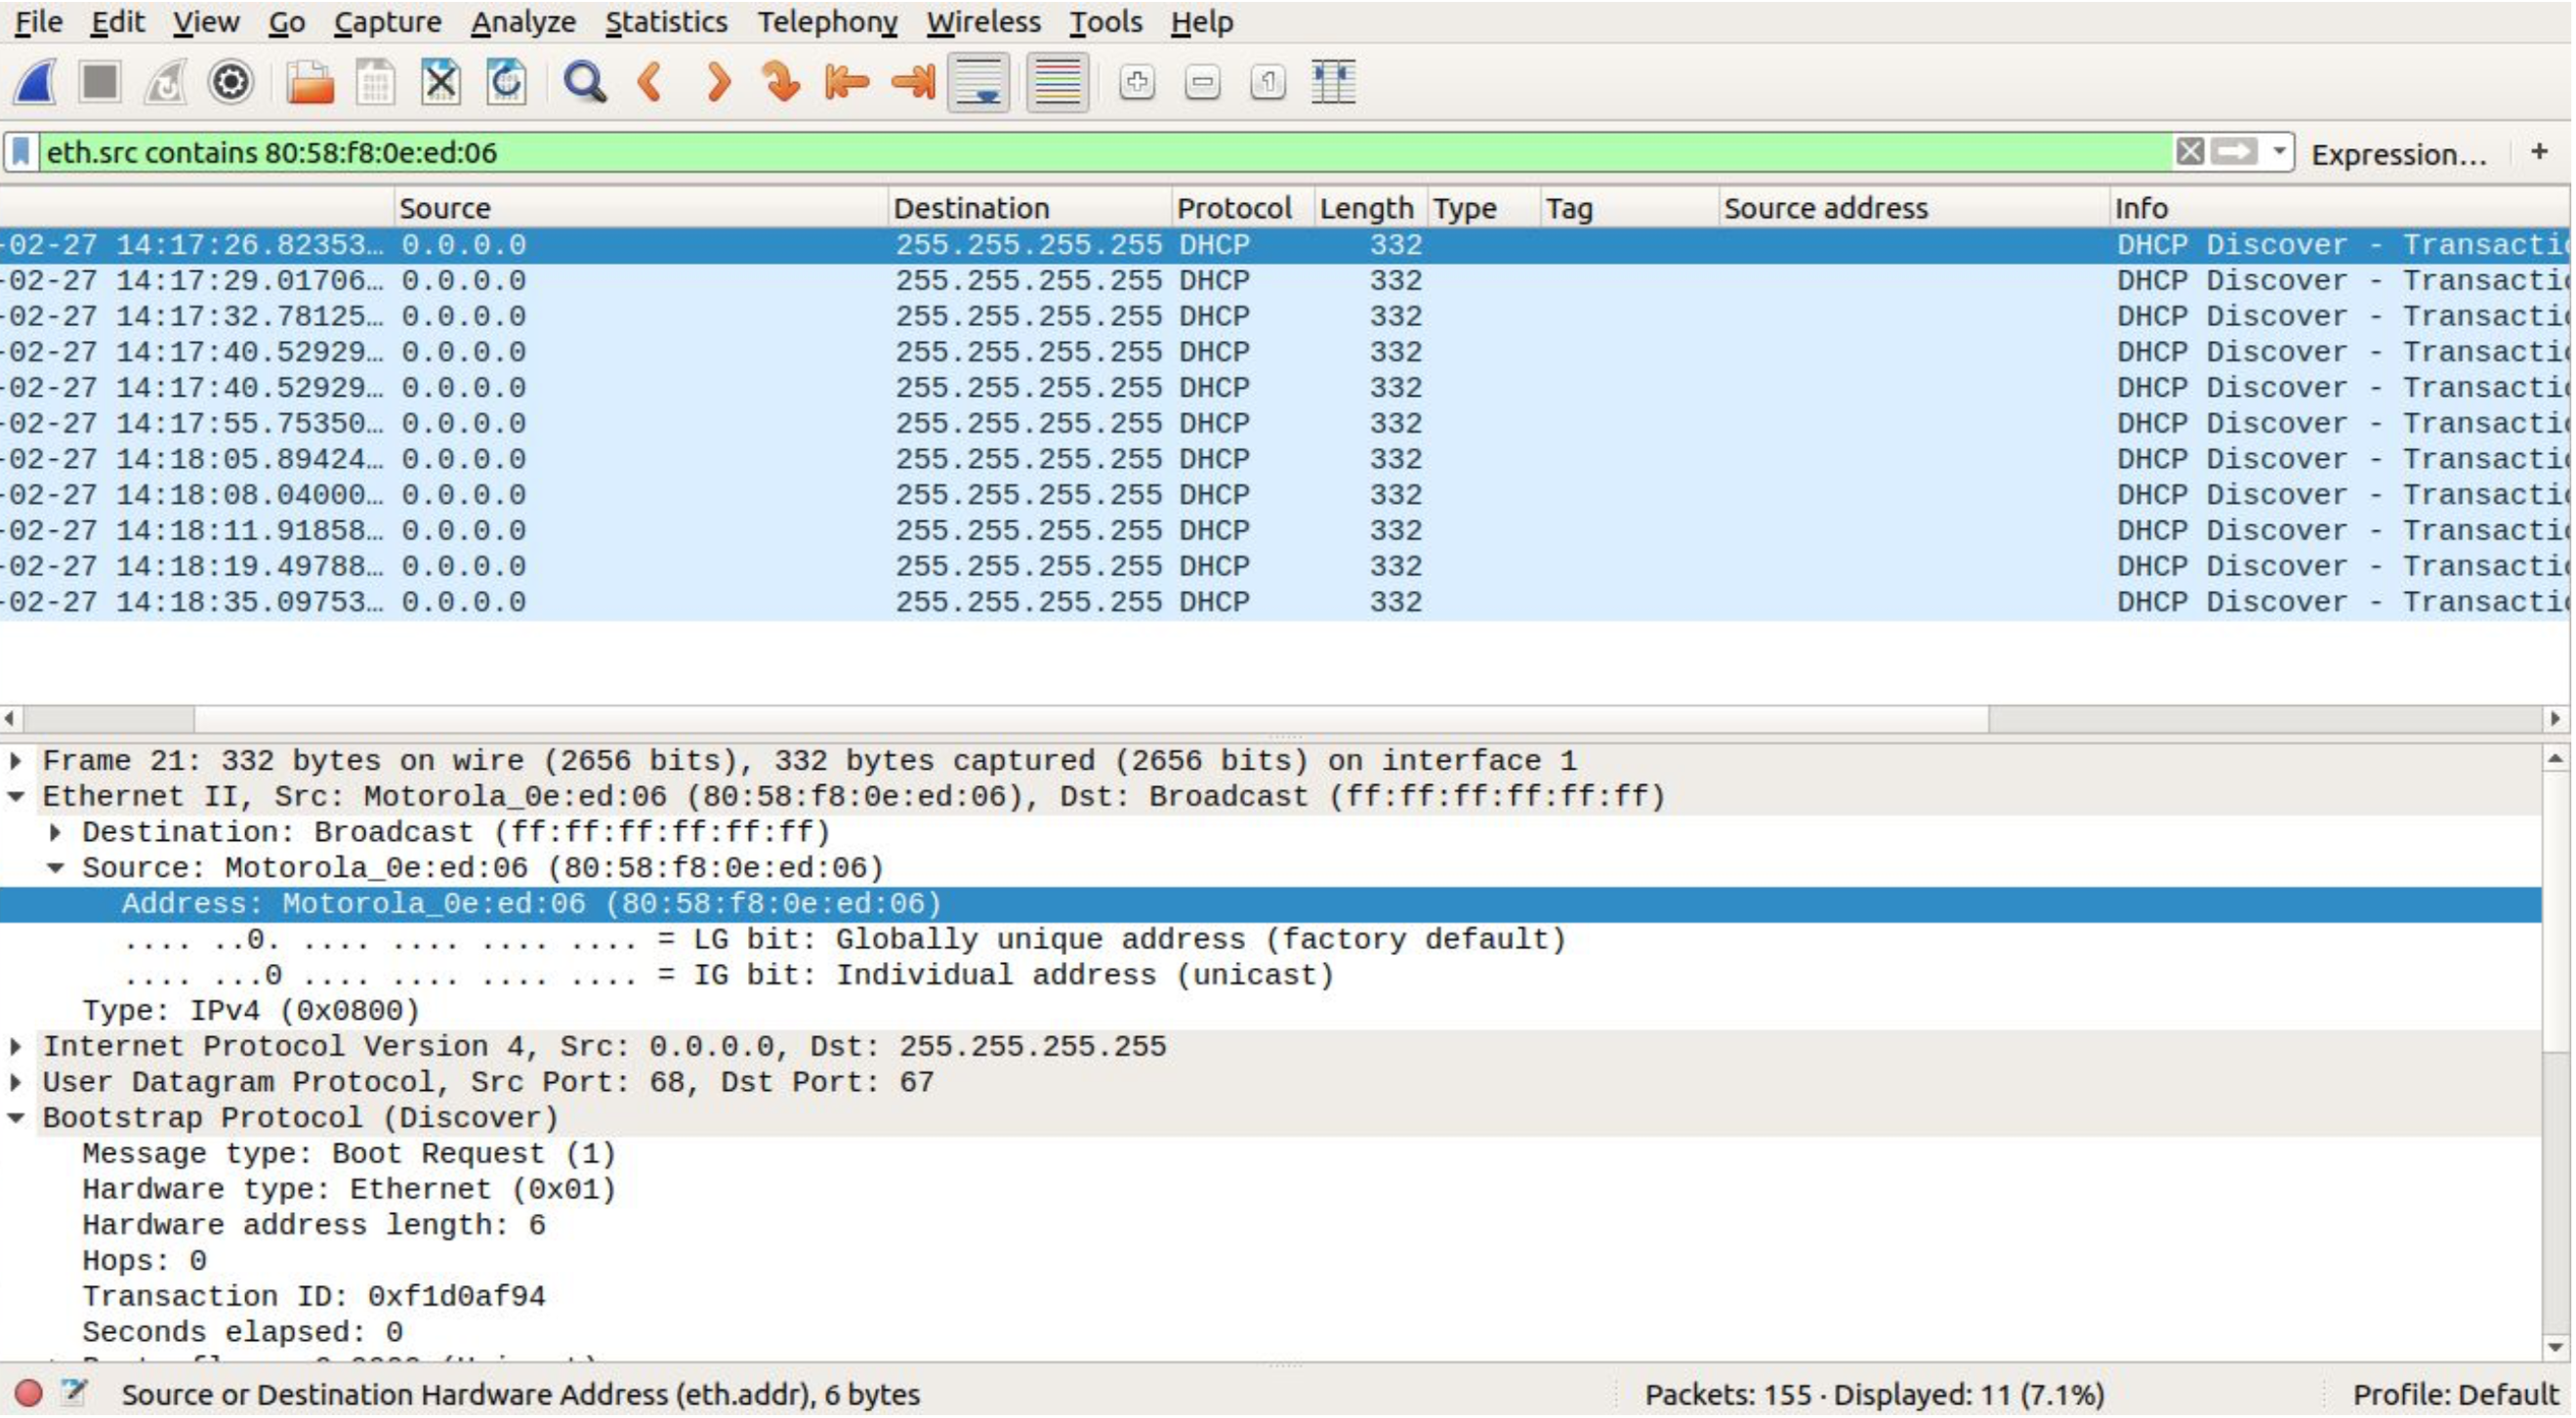
Check Marvis with following query language
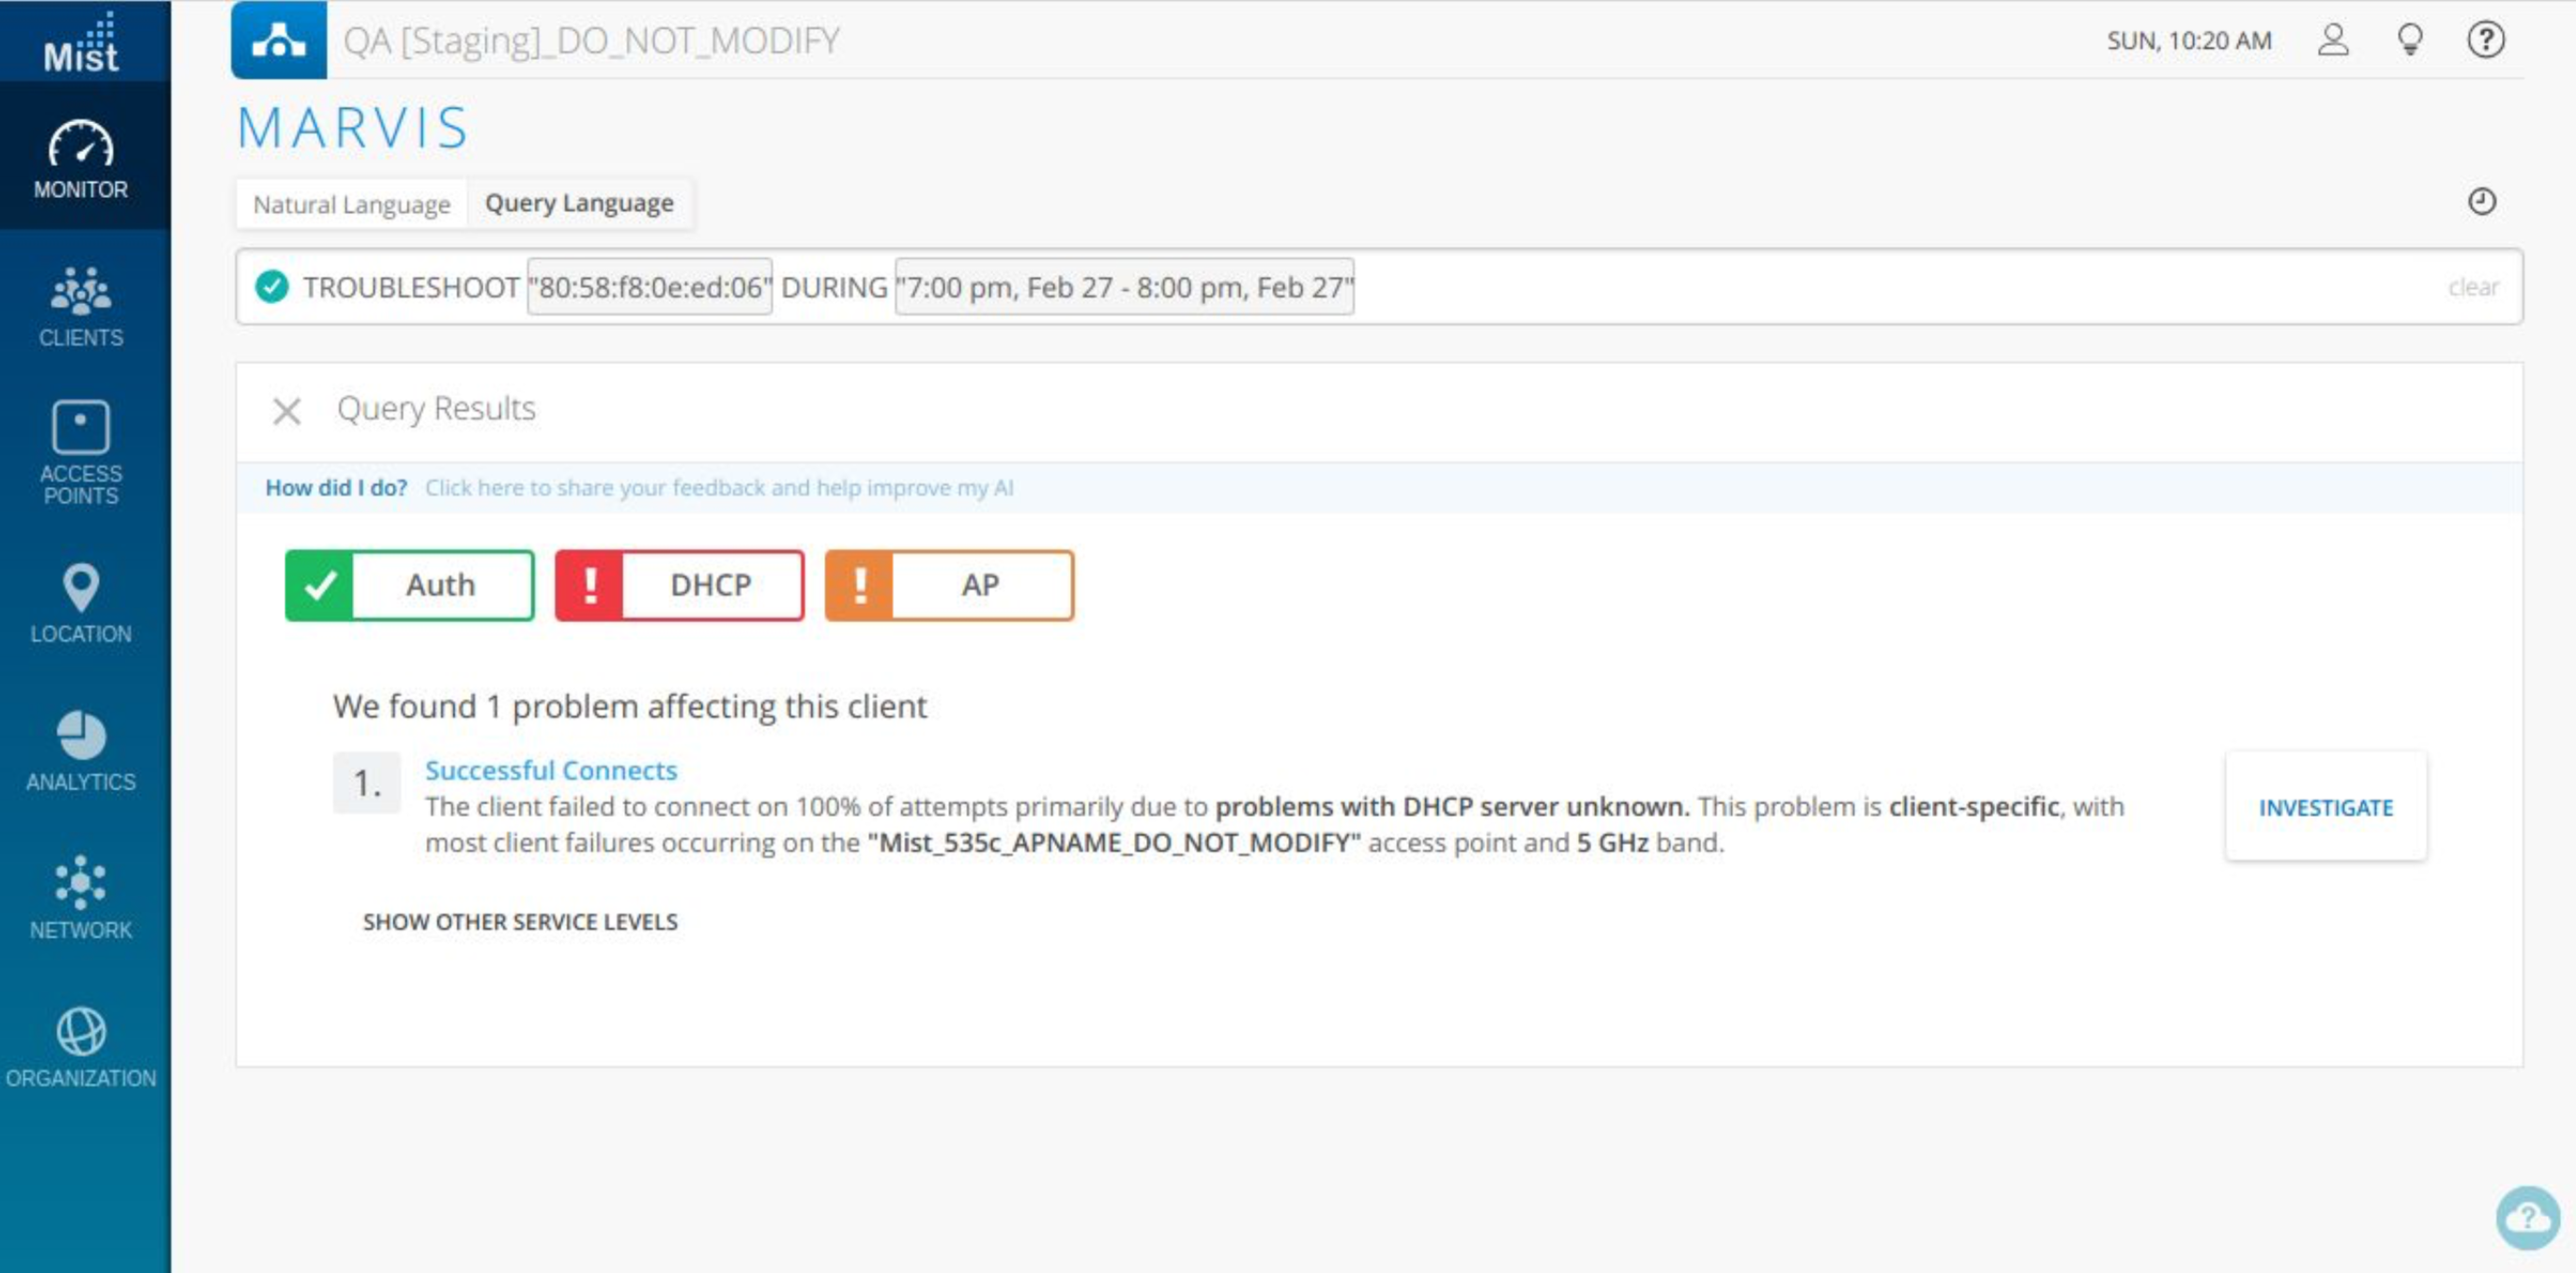
- TROUBLESHOOT “80:58:f8:0e:ed:06” DURING “7:00 pm, Feb 27 – 8:00 pm, Feb 27”
- TROUBLESHOOT “80:58:f8:0e:ed:06” DURING “Today”
This will give you the answer to what is happening to the client for most of the time(The client failed to connect on 100% of attempts primarily due to problems with DHCP server.)
For this section we will be taking a client mac (80:58:f8:0e:ed:06) and disable DHCP server to get the DHCP timeout events.
Next step is to go to Investigate and here you can check
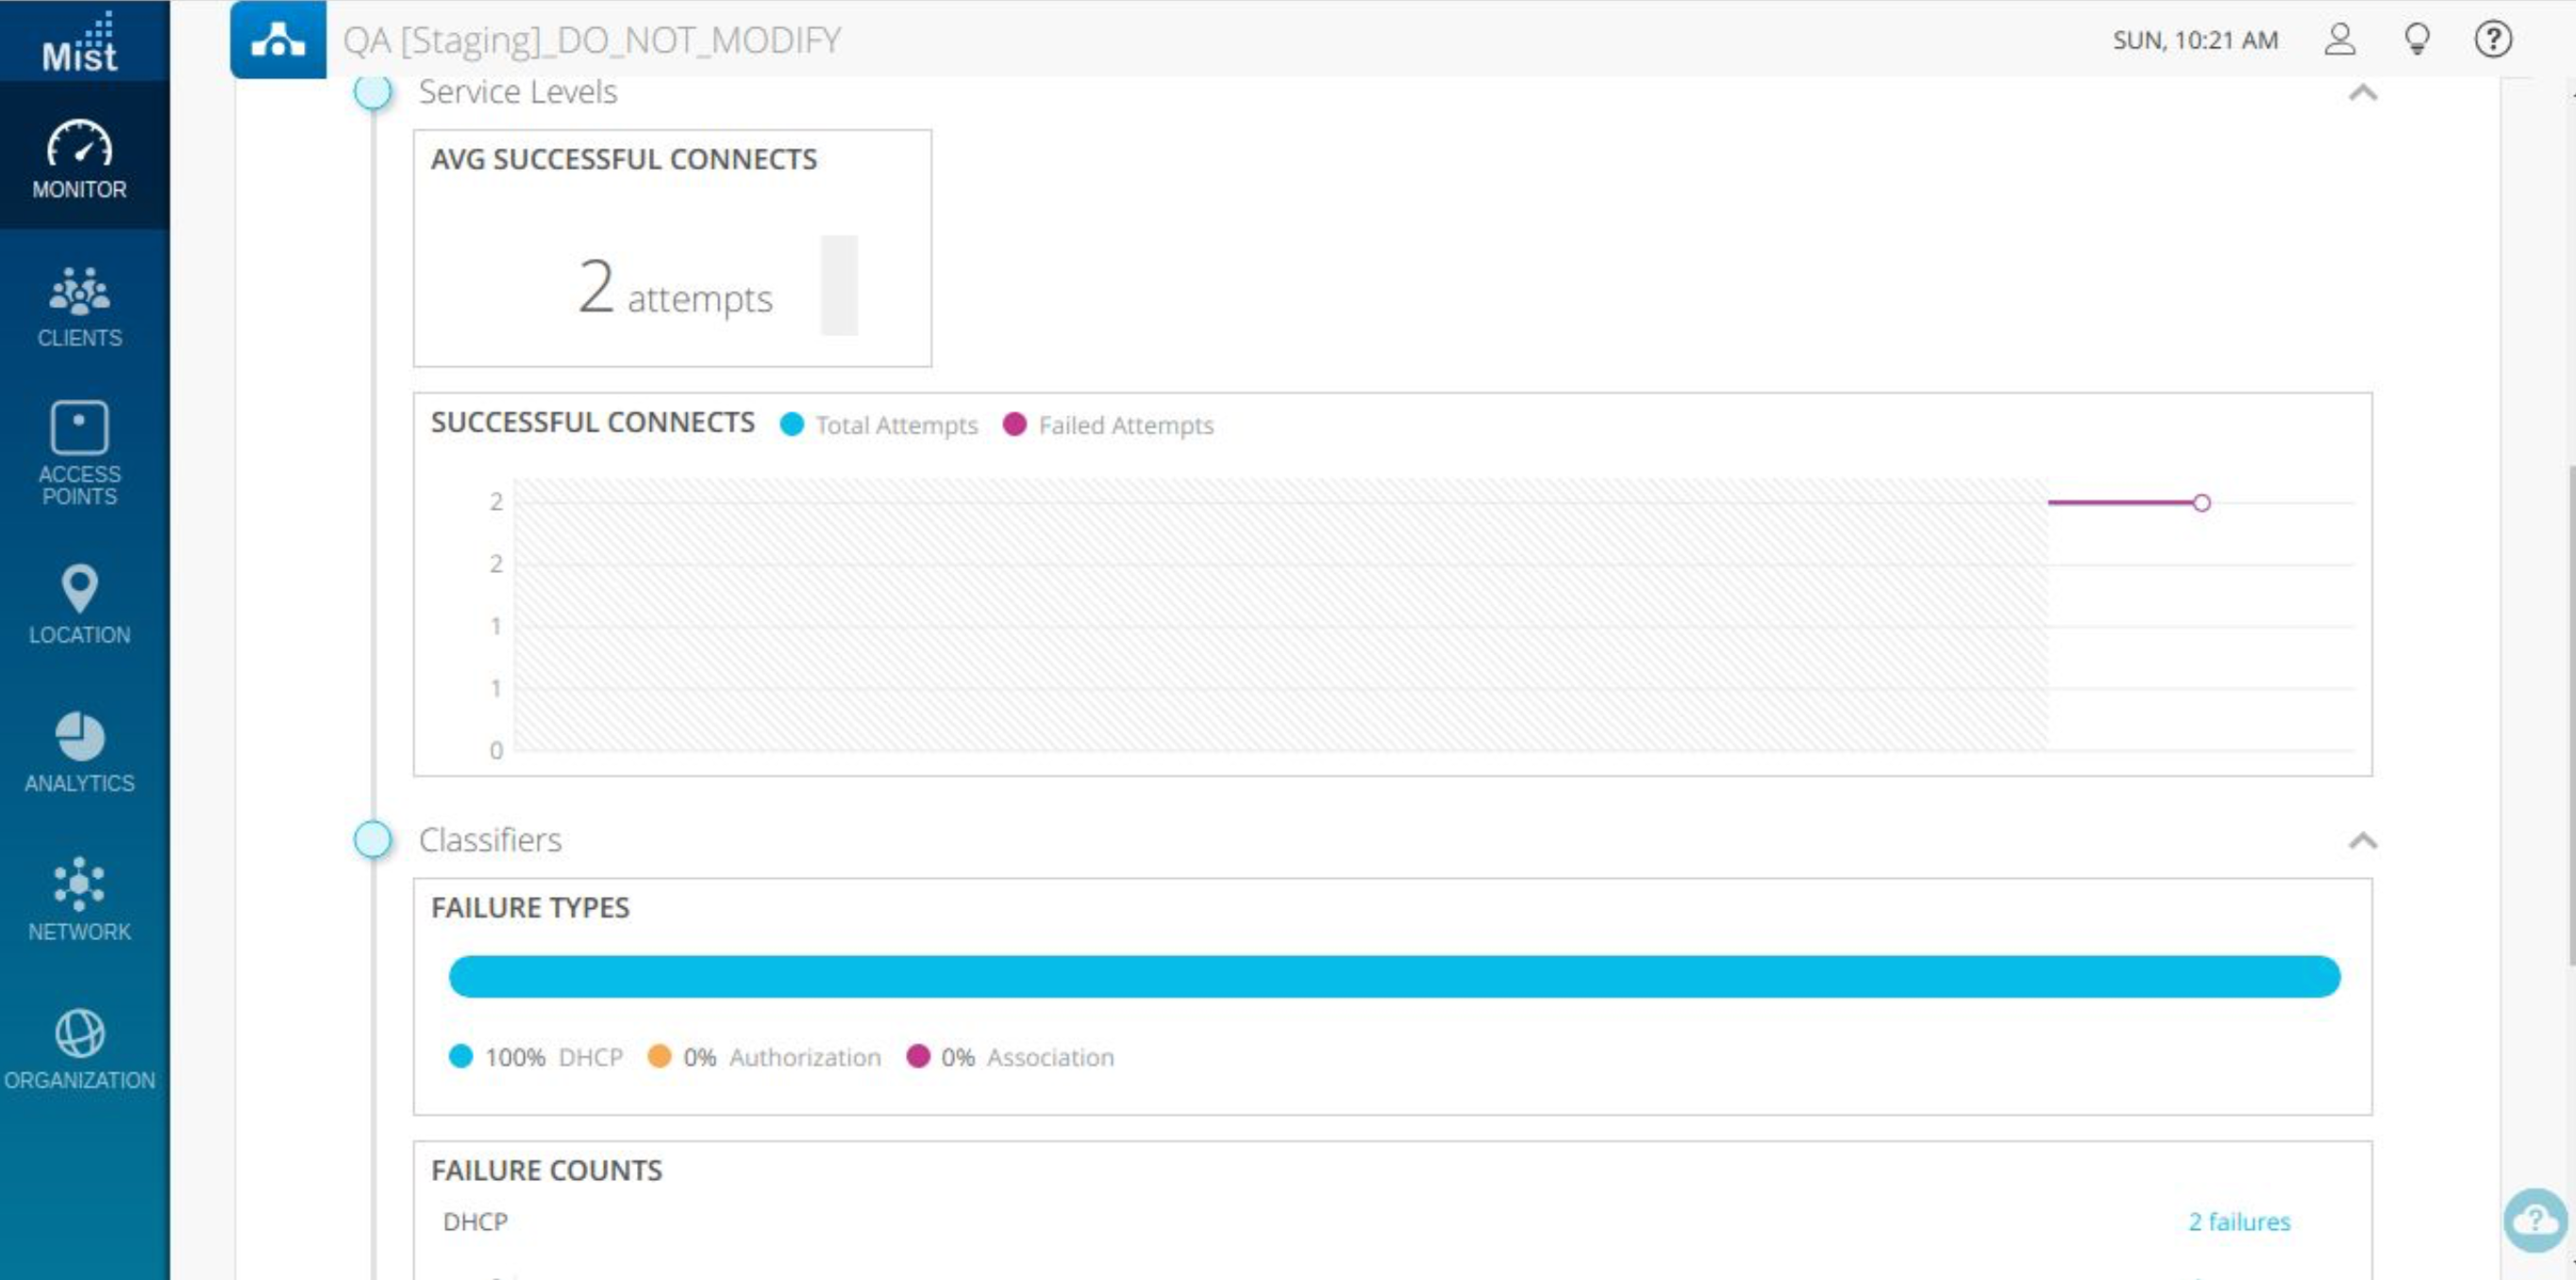
- The Successful connects – Gives information related to number of attempts and failure graph related to your client
- Classifier – Gives the type and count of failure type (DHCP failure in this case)
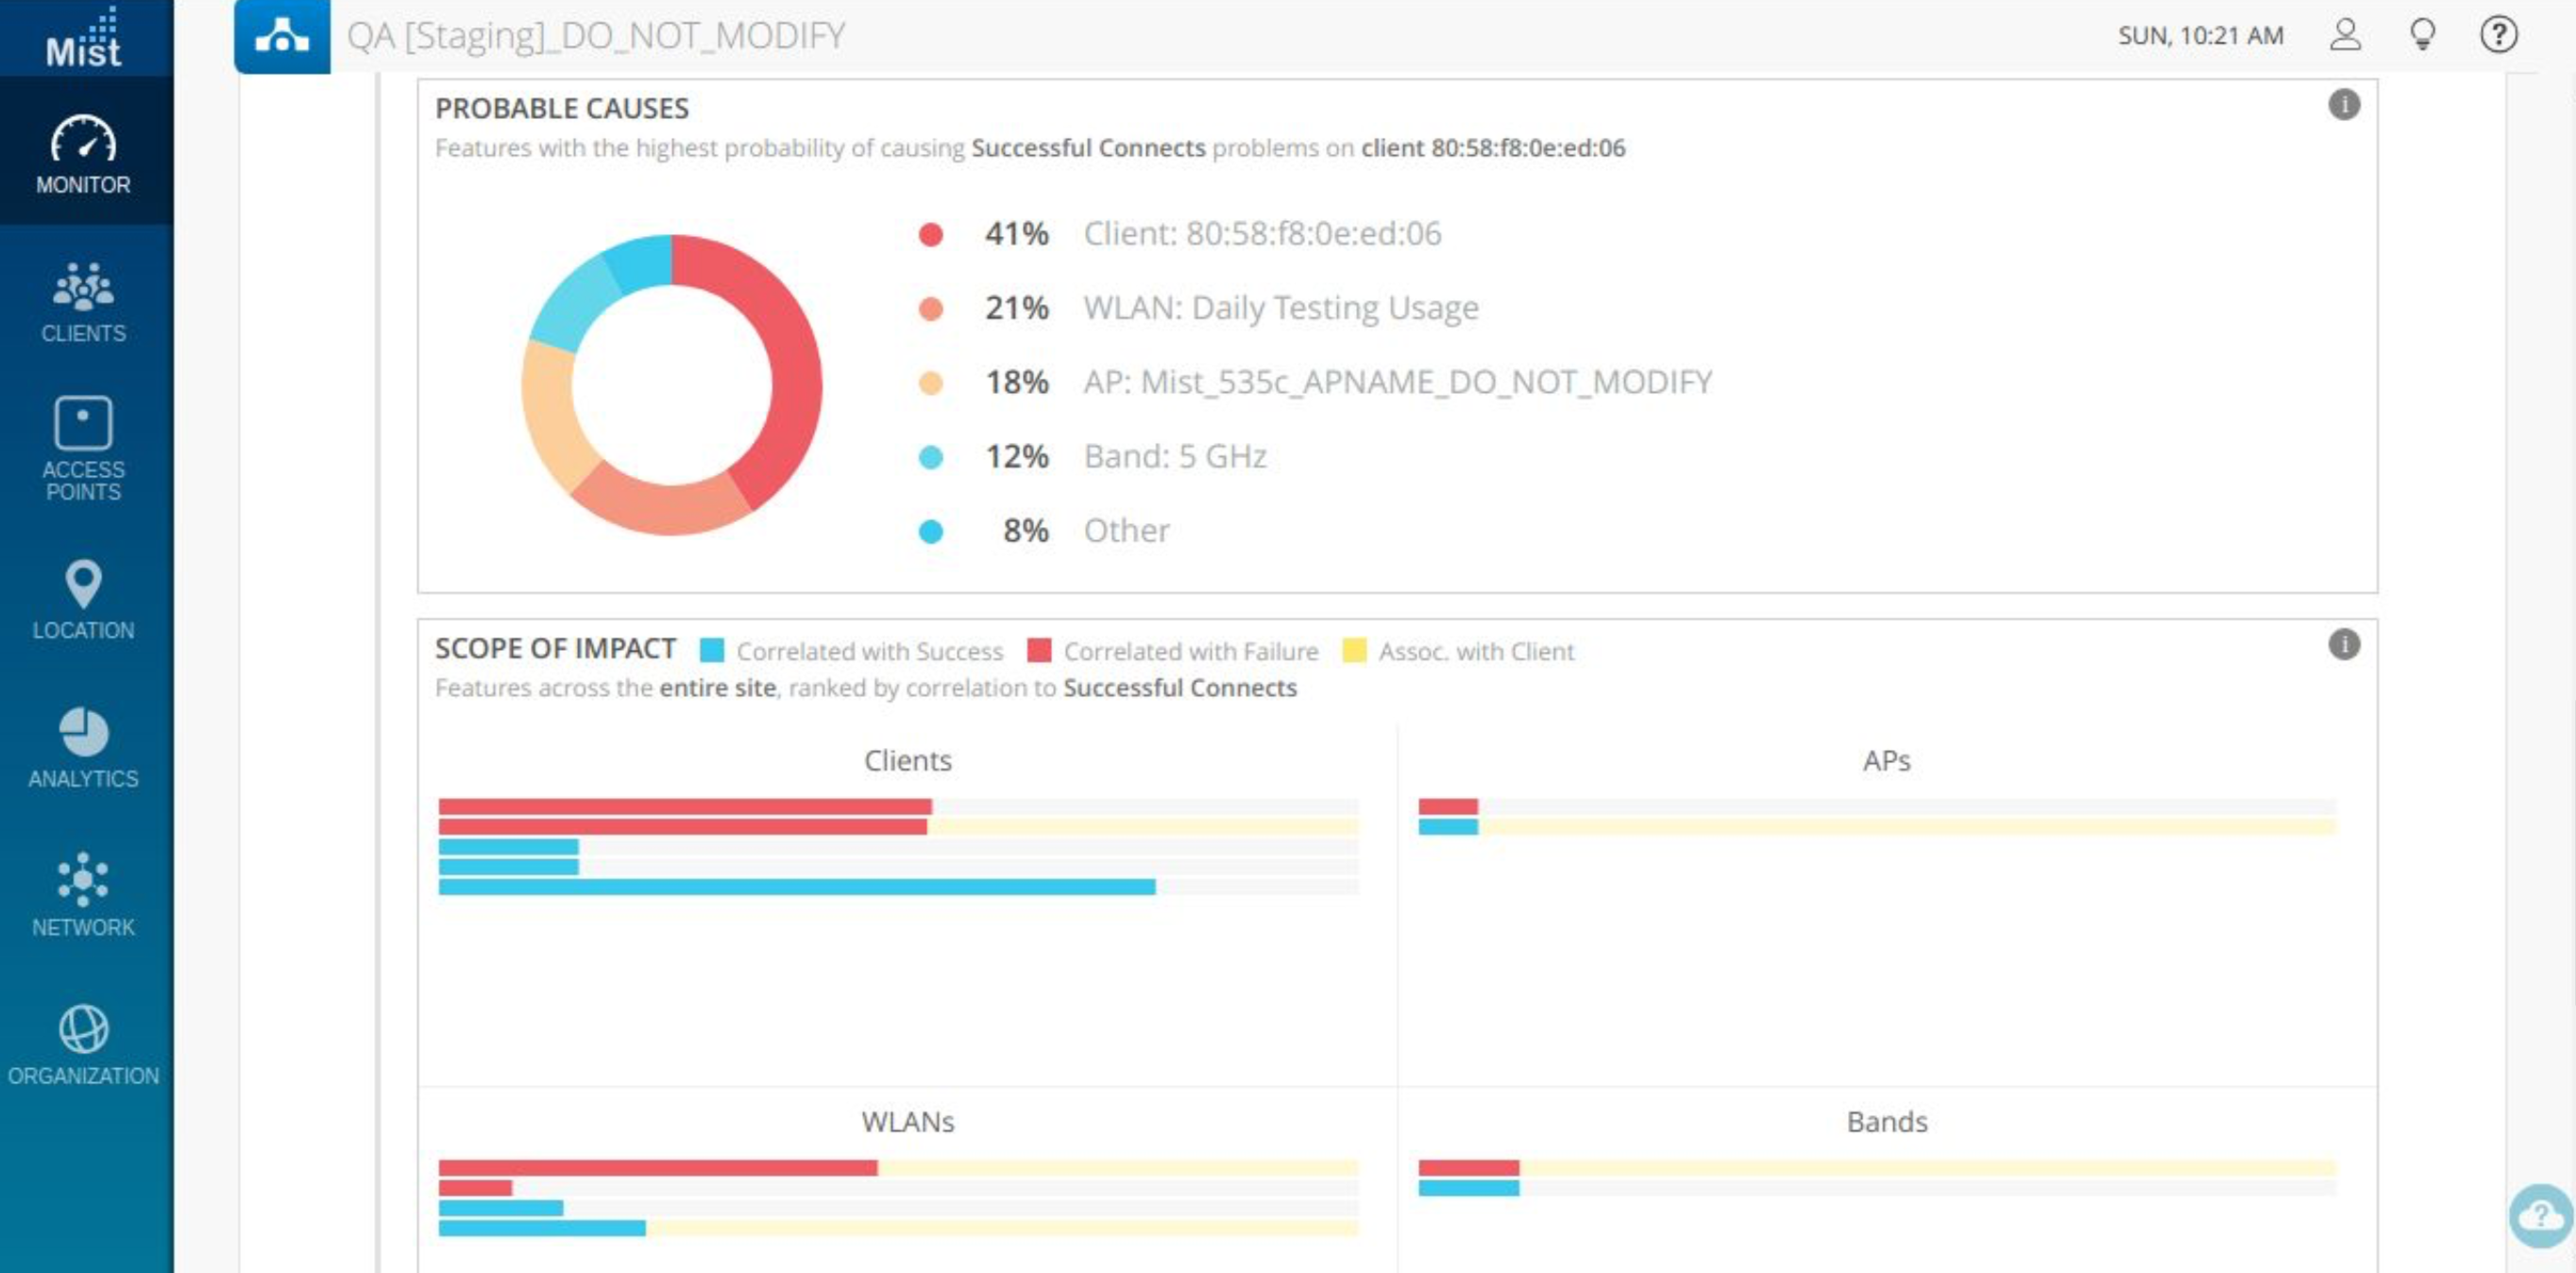
Correlation
Gives you the SCOPE OF IMPACT talks about the Mac address of client, on which SSID on which band it was trying to connect and fails
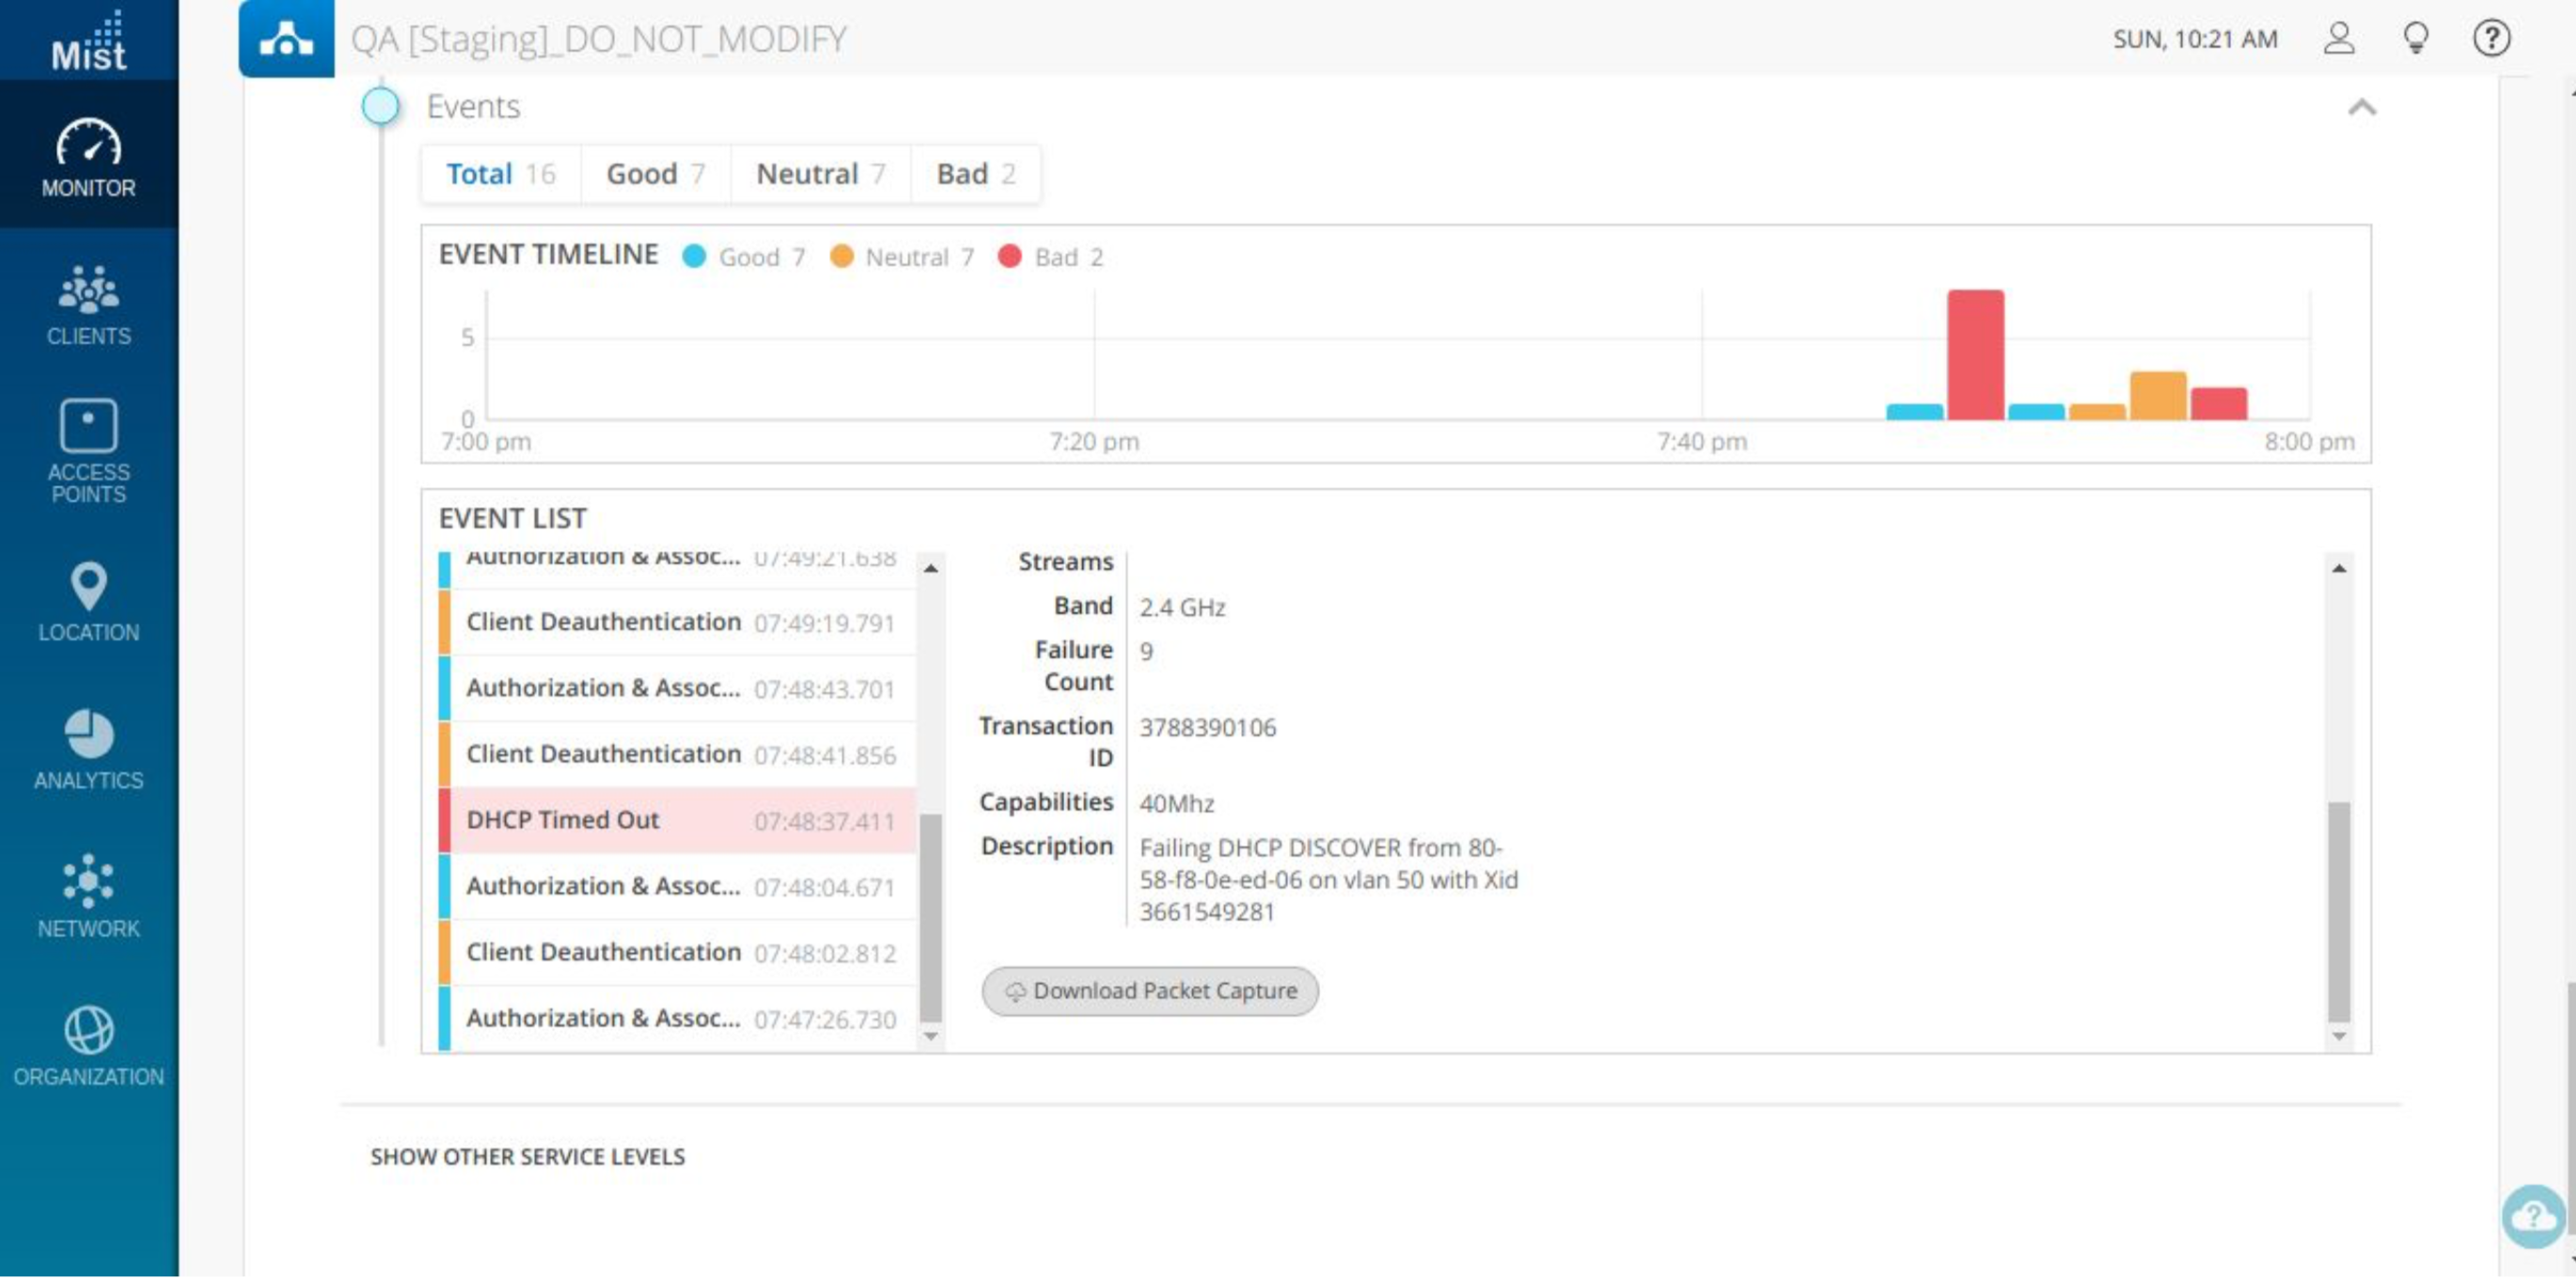
Events
Give you the Good or Bad events related to the client, where you can always download the dynamic PCAPs for the bad events that occurred.
If you have not purchased the VNA subscriptions
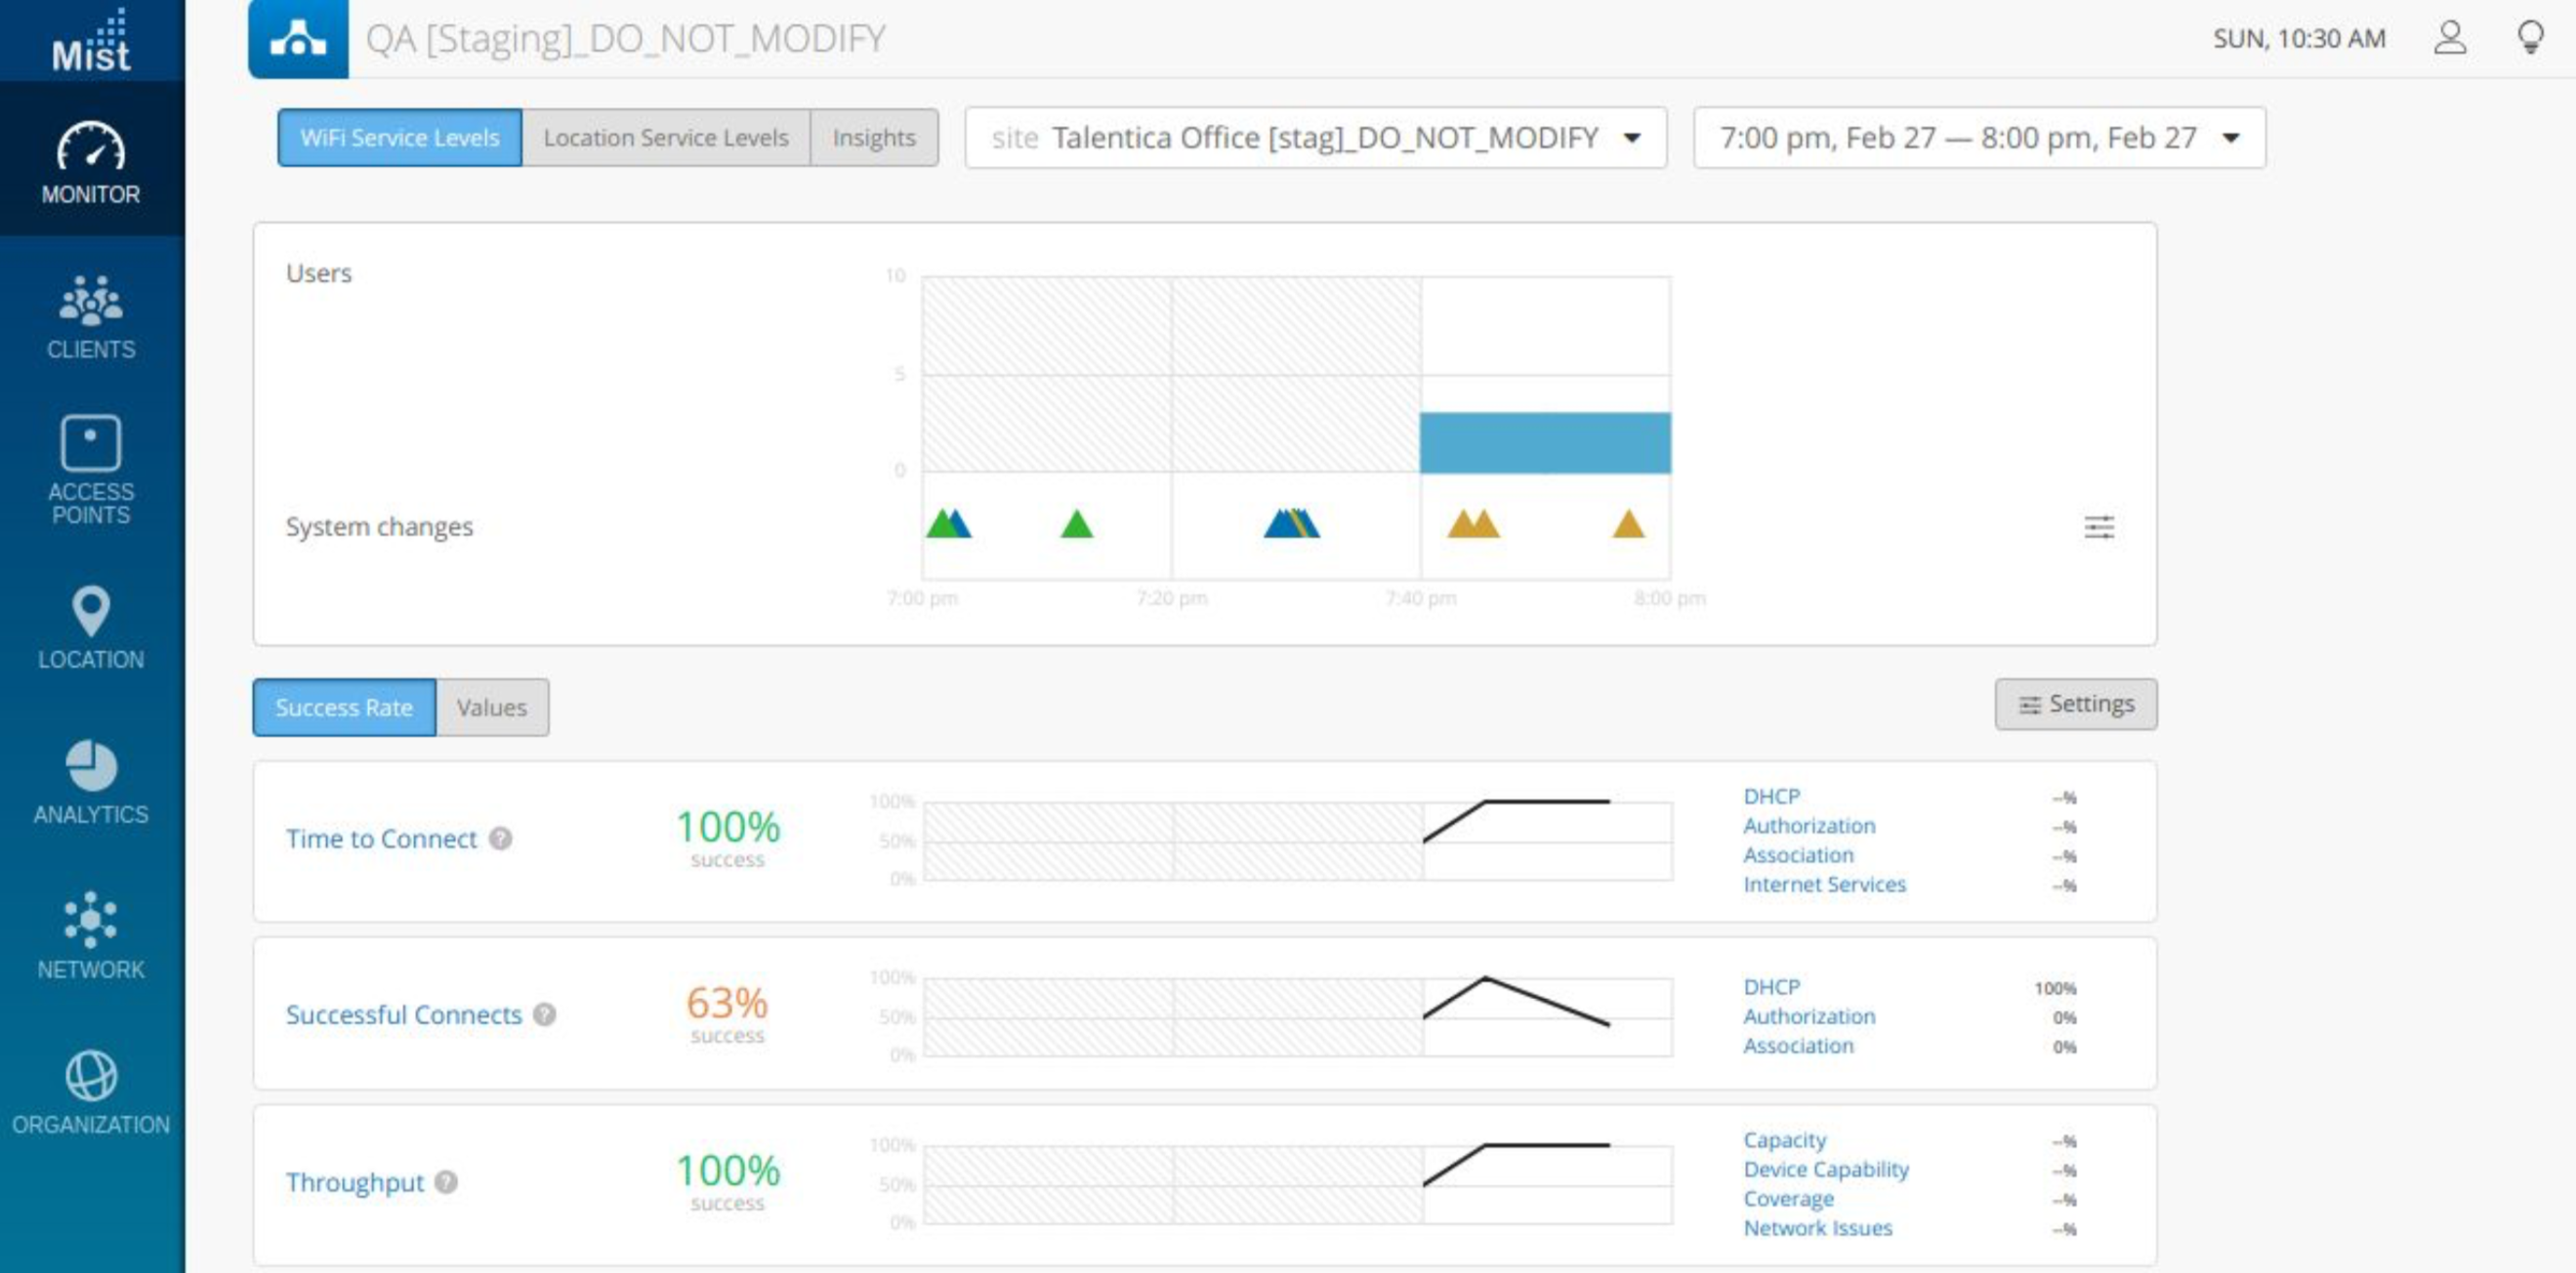
Go to Monitor Page → WiFi Sle → Check which SLE is falling down for a particular time period (In our case it is basically Successful Connect).
Now you know that successful connect is falling for my site, this falling can be because of DHCP issue, Authorization or Association (In our case successful connect is 0% and what is contributing for it’s 0% is due to 100% DHCP.
Click on Successful connect→ Click on the classifier→ Go to affected Item and check for impacted Clients and Access points
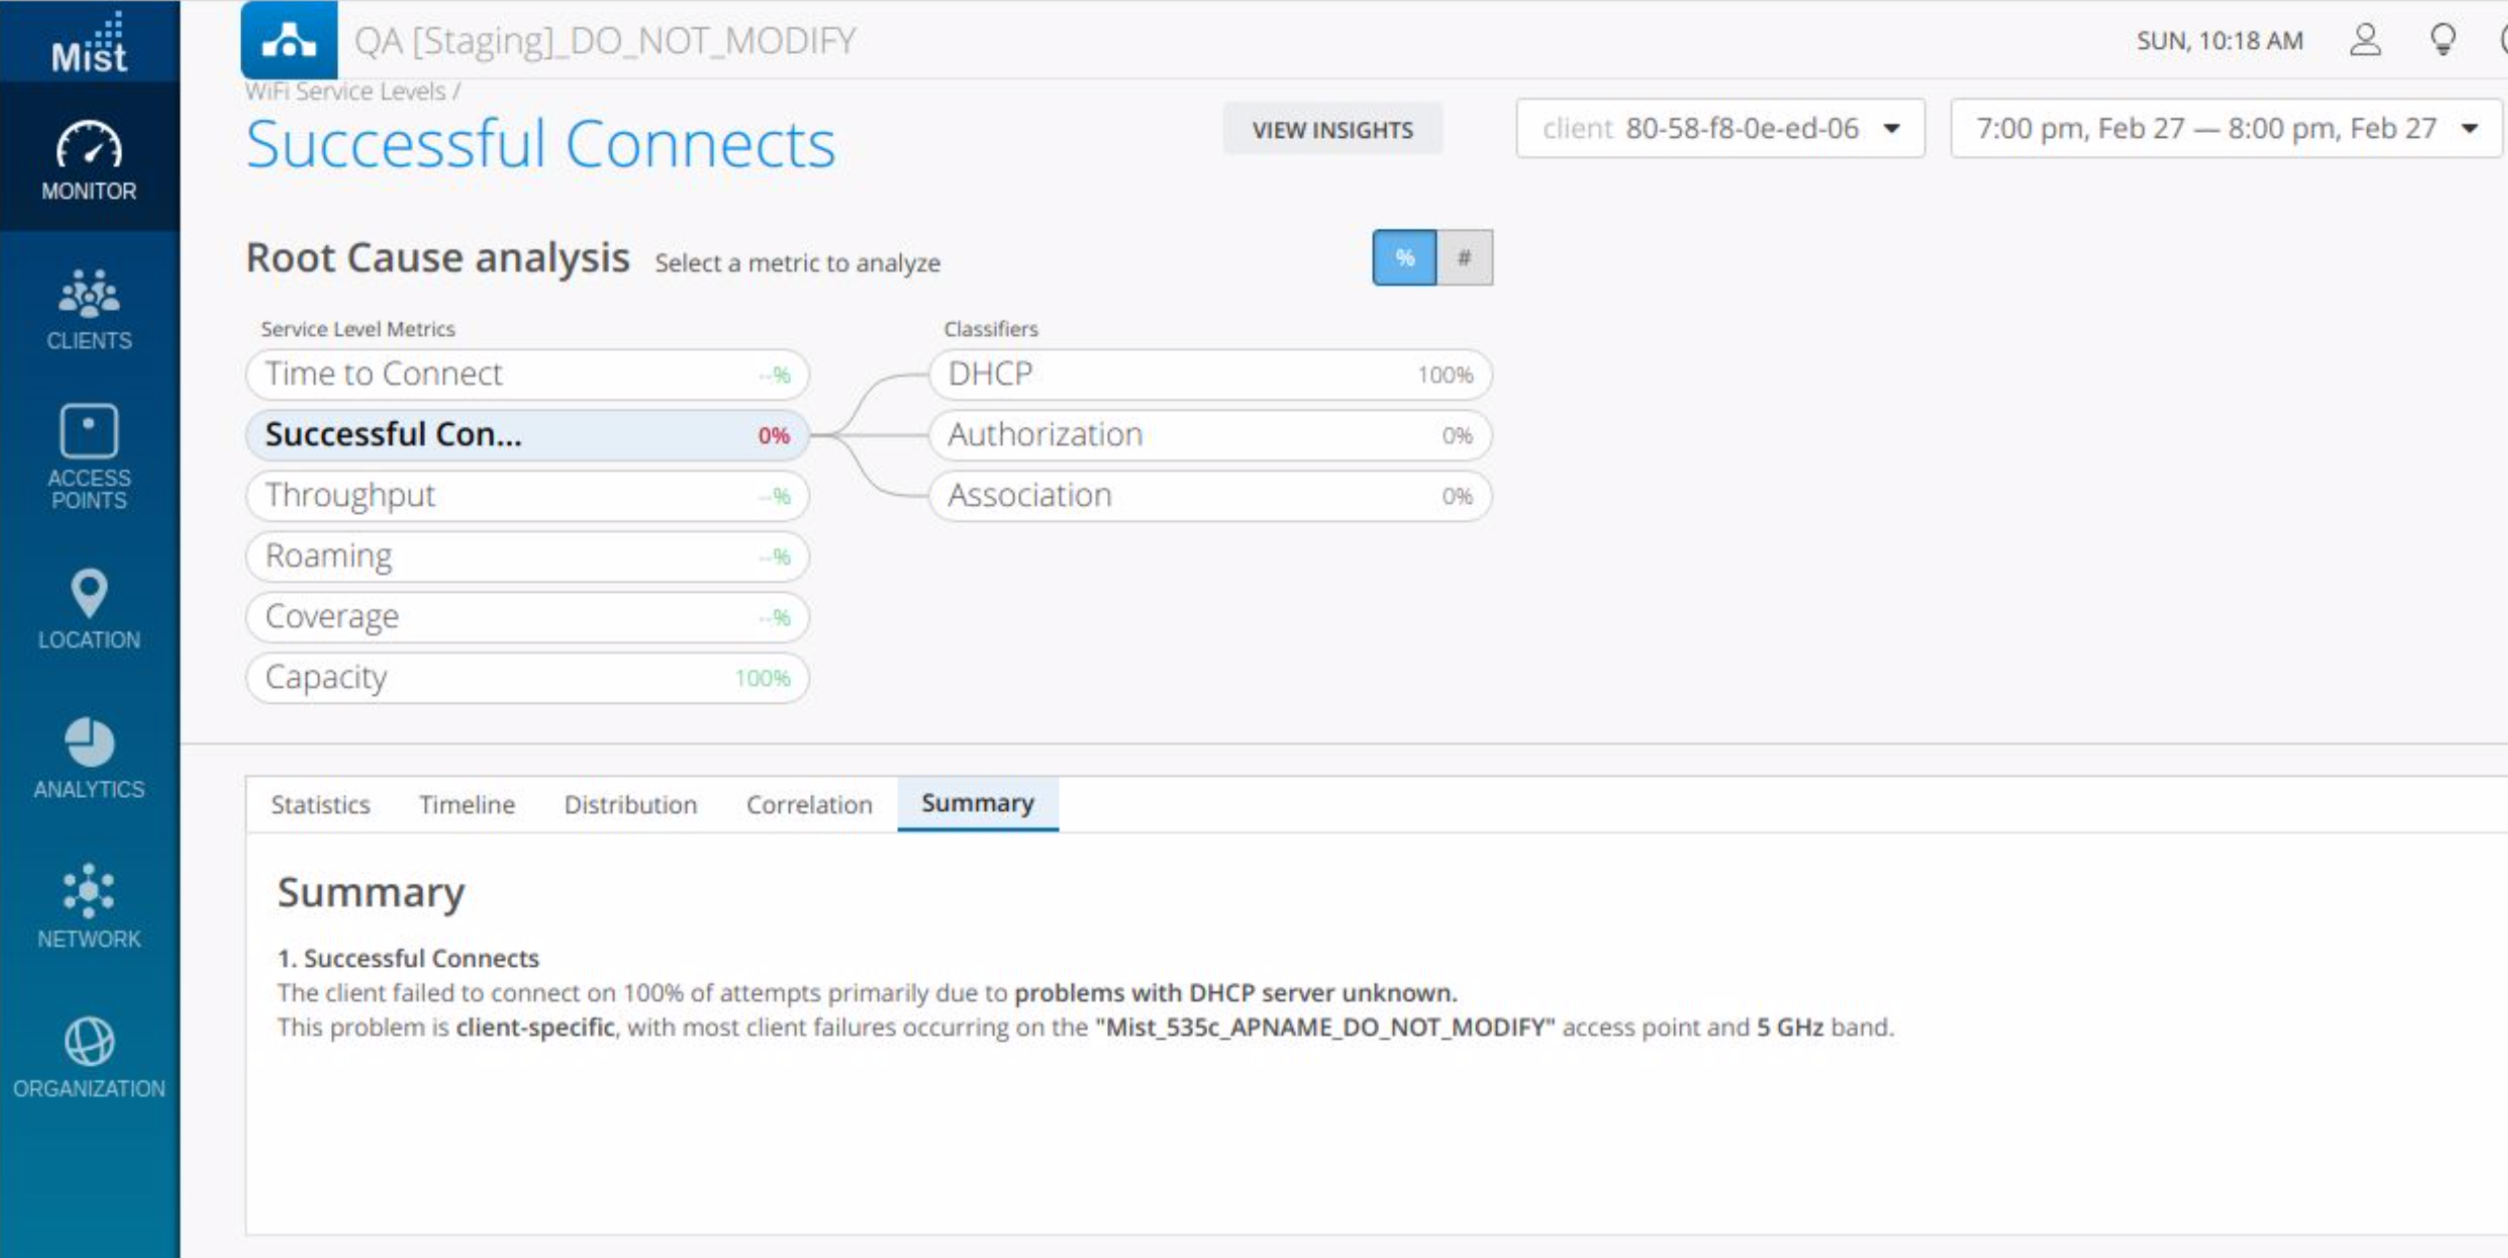
Click the MAC address of client to view it’s insights it will take you to client events and you can check using time period when the user was affected.
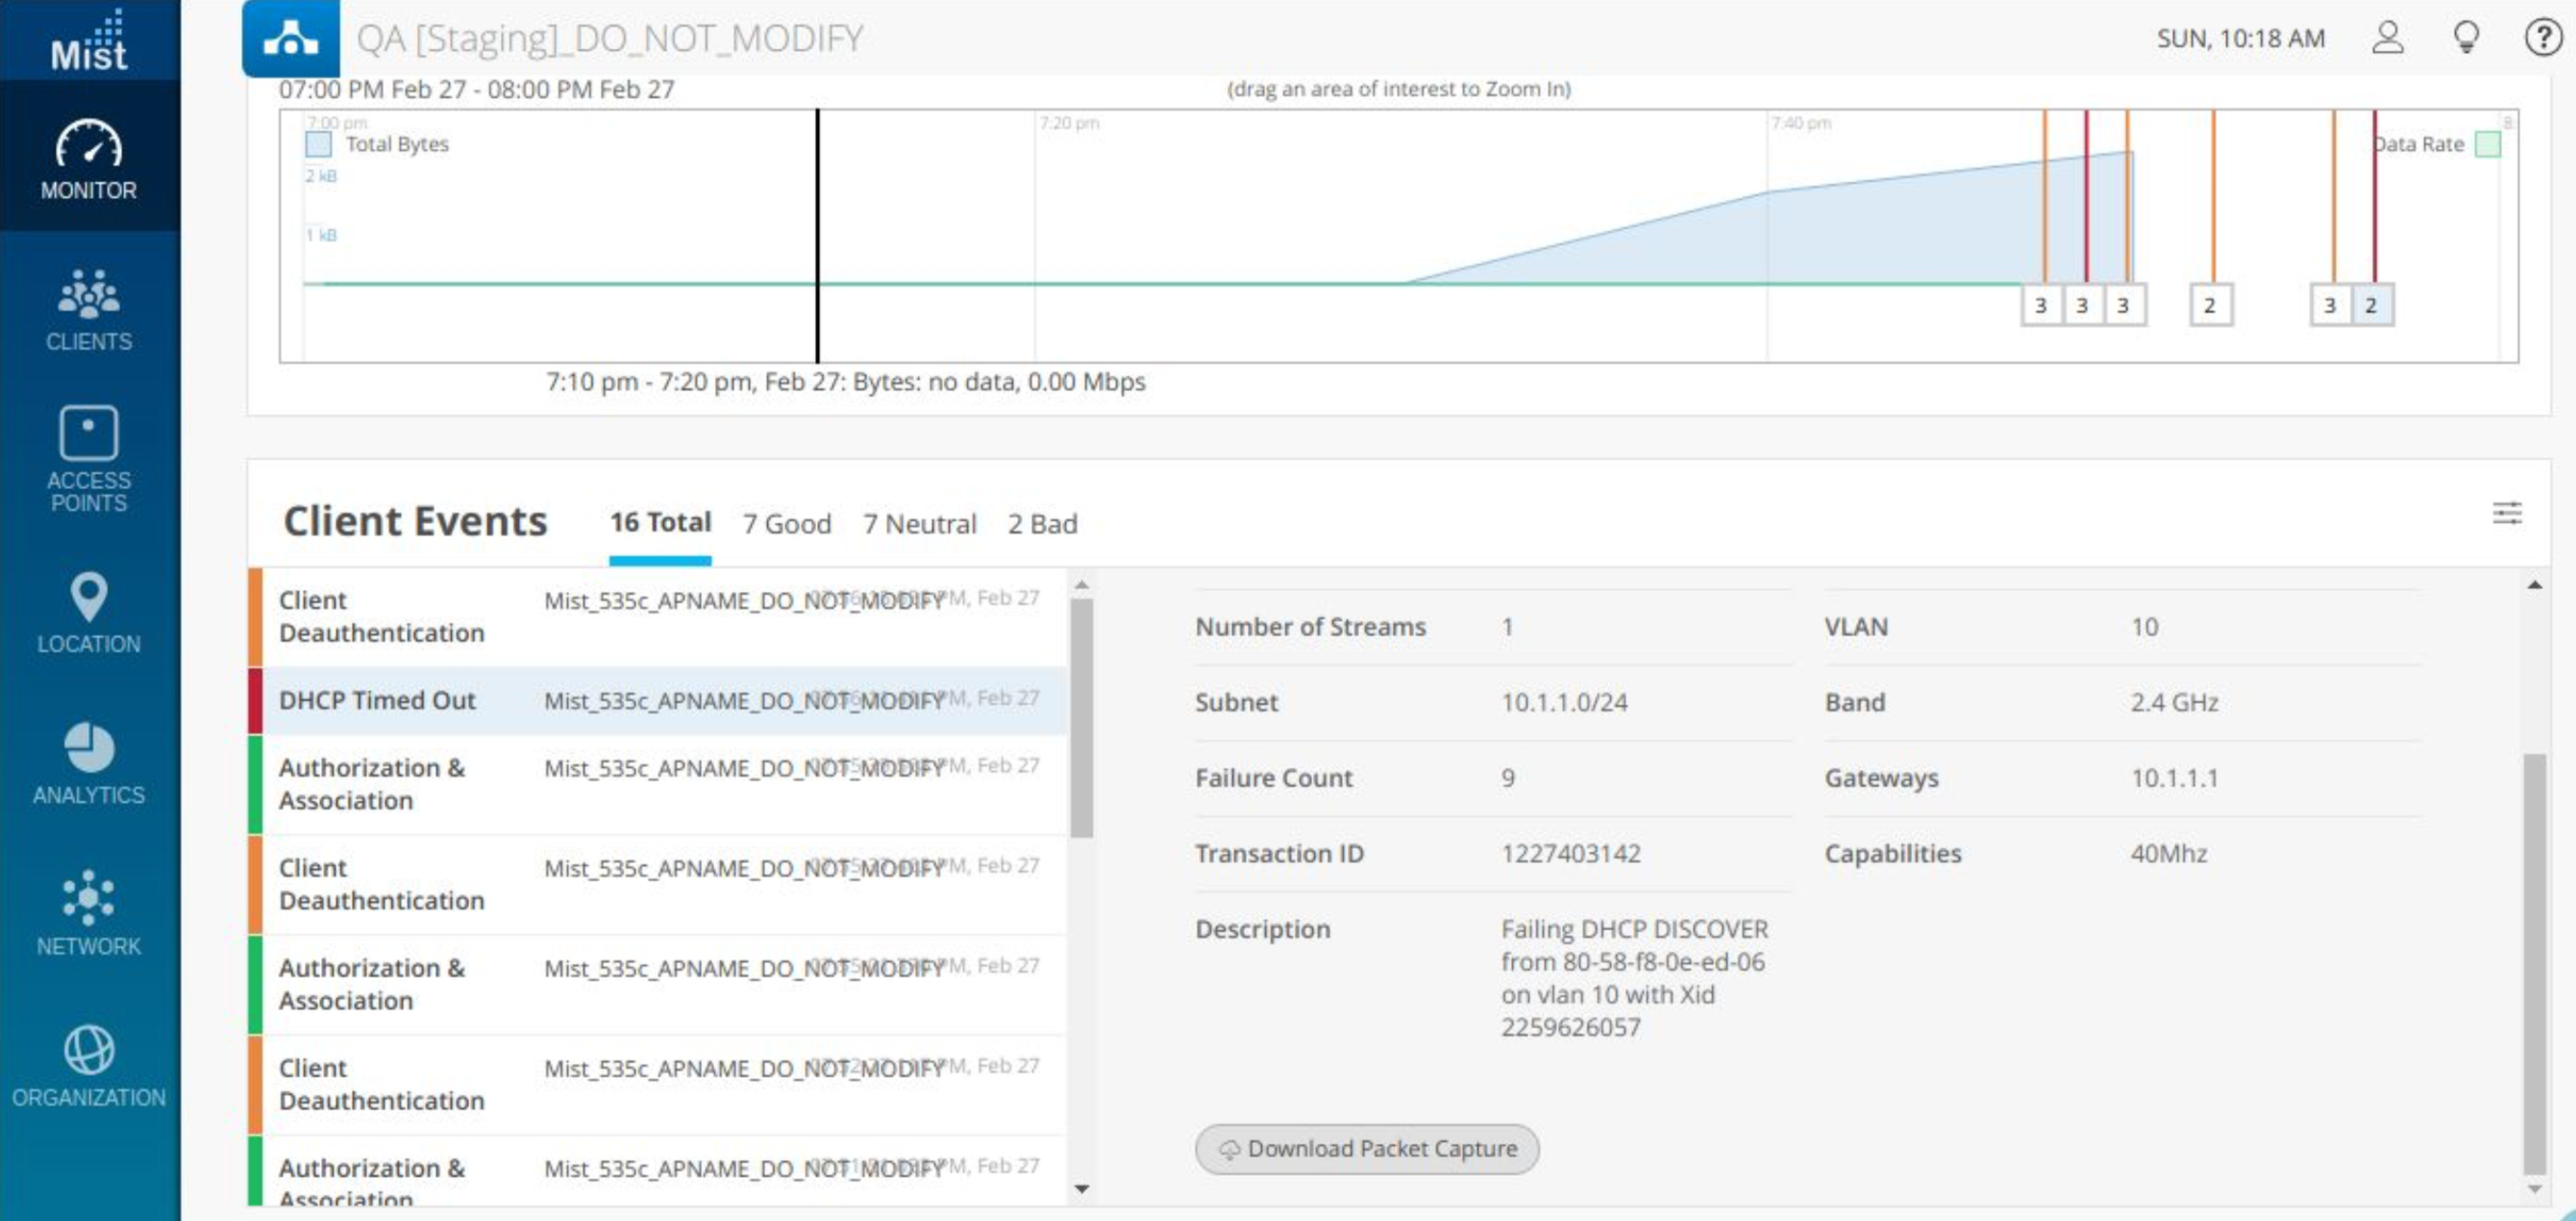
Also can download the PCAPs for bad events and analysis.
RADIUS
1. Check VNA (troubleshoot client) for the client and ensure the Auth is in Green State
- Monitor -> Marvis -> “troubleshoot client 38:f9:d3:74:a5:36”
- And search any client Mac-address in above format.
2. Check the Successful Connect SLE → Authorization → Affected Items → Check overall impacted clients.
3. Select the client → View Insights → Download PCAP for analysis
4. Check if the radius server is responding to the Access-Request sent by the AP
5. Check if the radius server is responding with an Access-Reject
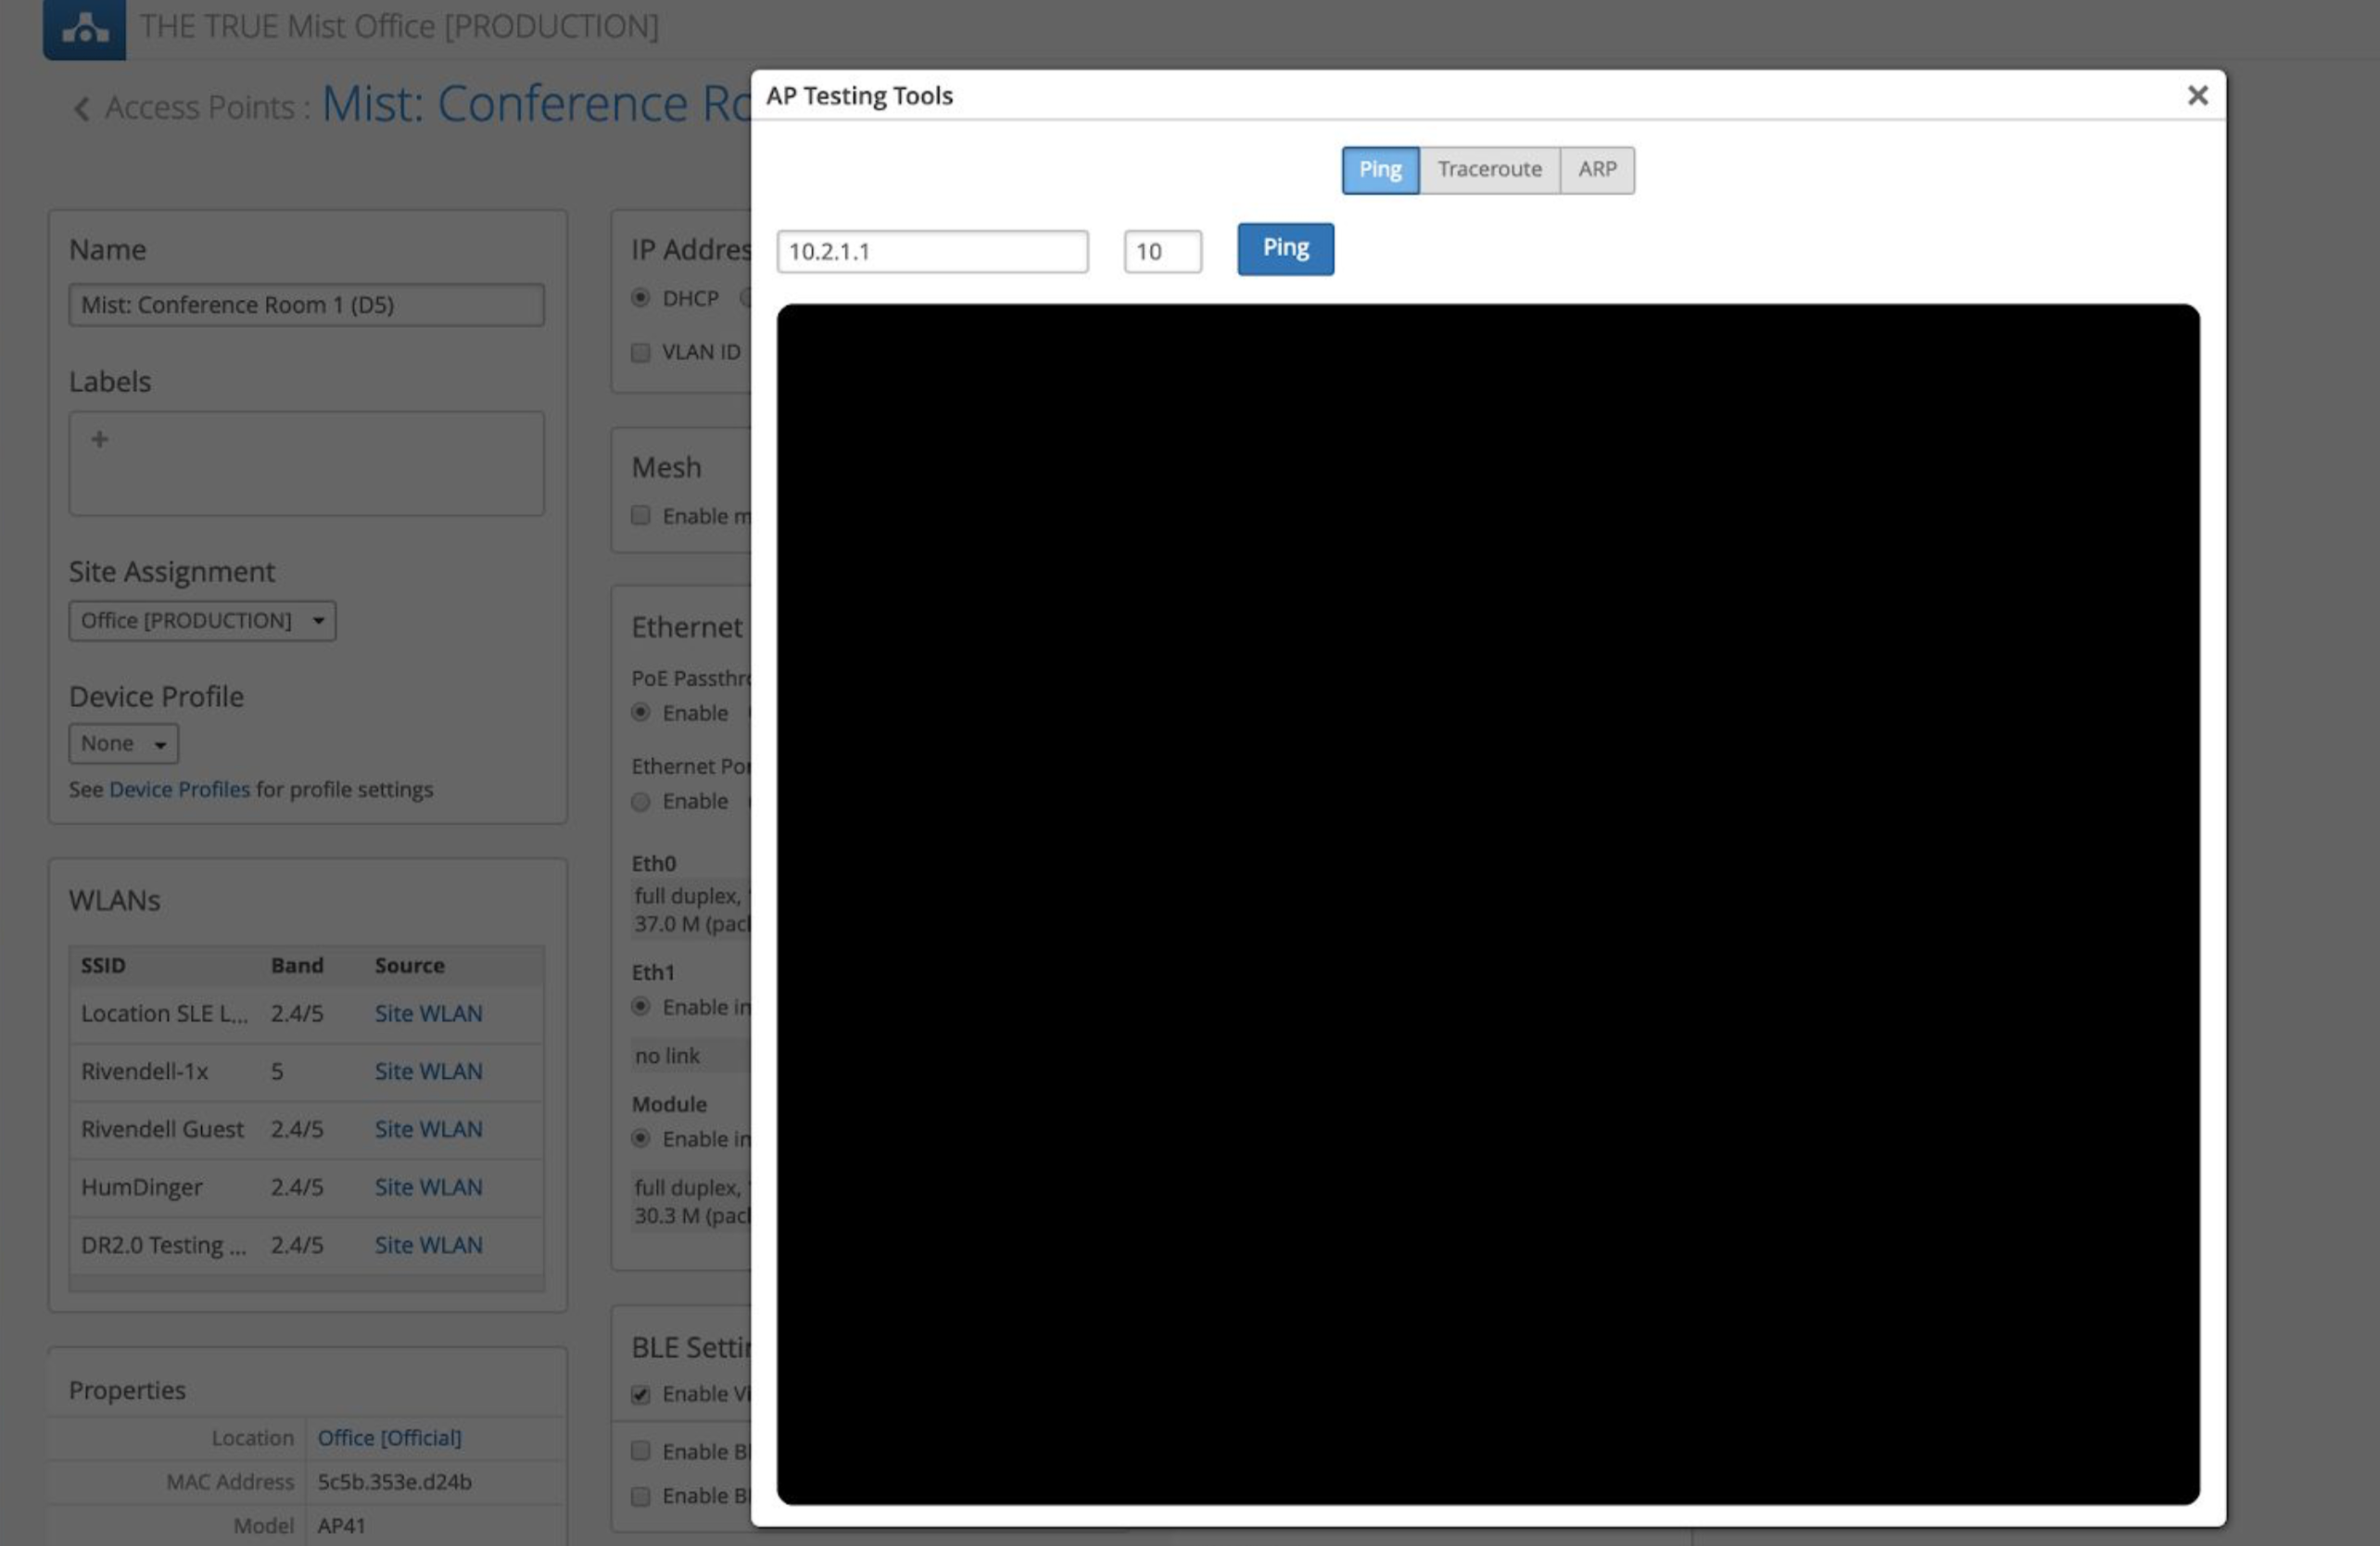
6. Check connectivity between the AP and radius server (Ping tool is available from under the AP -> Utilities ->Testing Tools