Switch Front Panel
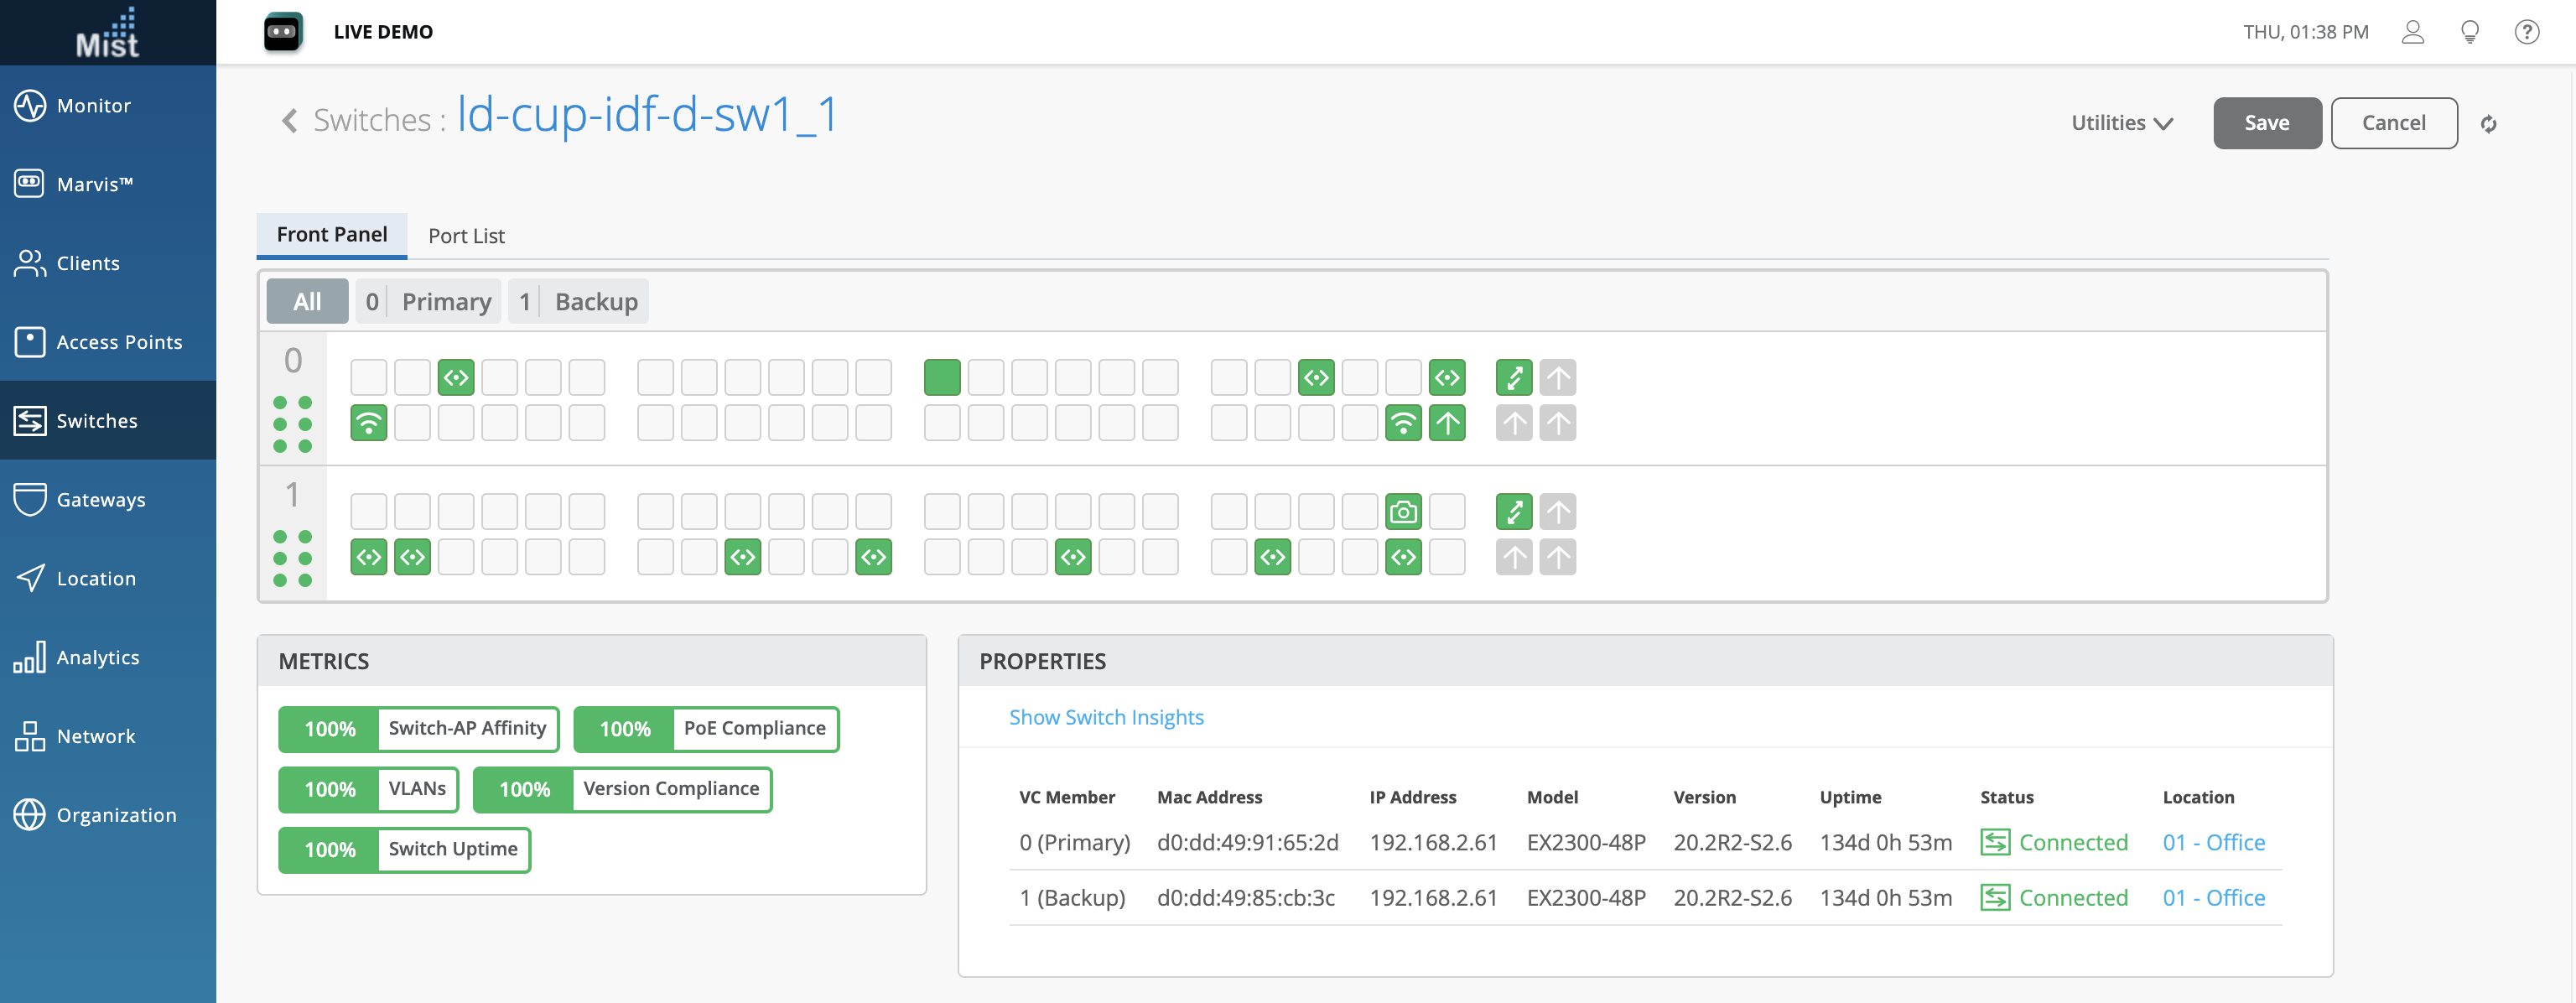
To view your Switch Details directly through the Mist Dashboard, navigate to the Switches tab on the left side of your screen and select a switch from the list that has been adopted to your site.
The EX Switches front panel provides a detailed, logical representation of your switches on our Mist UI. With our front panel view, you can get a better sense of the status and health of your switches, as well as wired clients/APs connected to your switches.
Ports
On each of the ports of the switch you will see a symbol and color, which indicate what is connected, and the status of the connected client/AP. Here is the list of different port indicators:
![]()
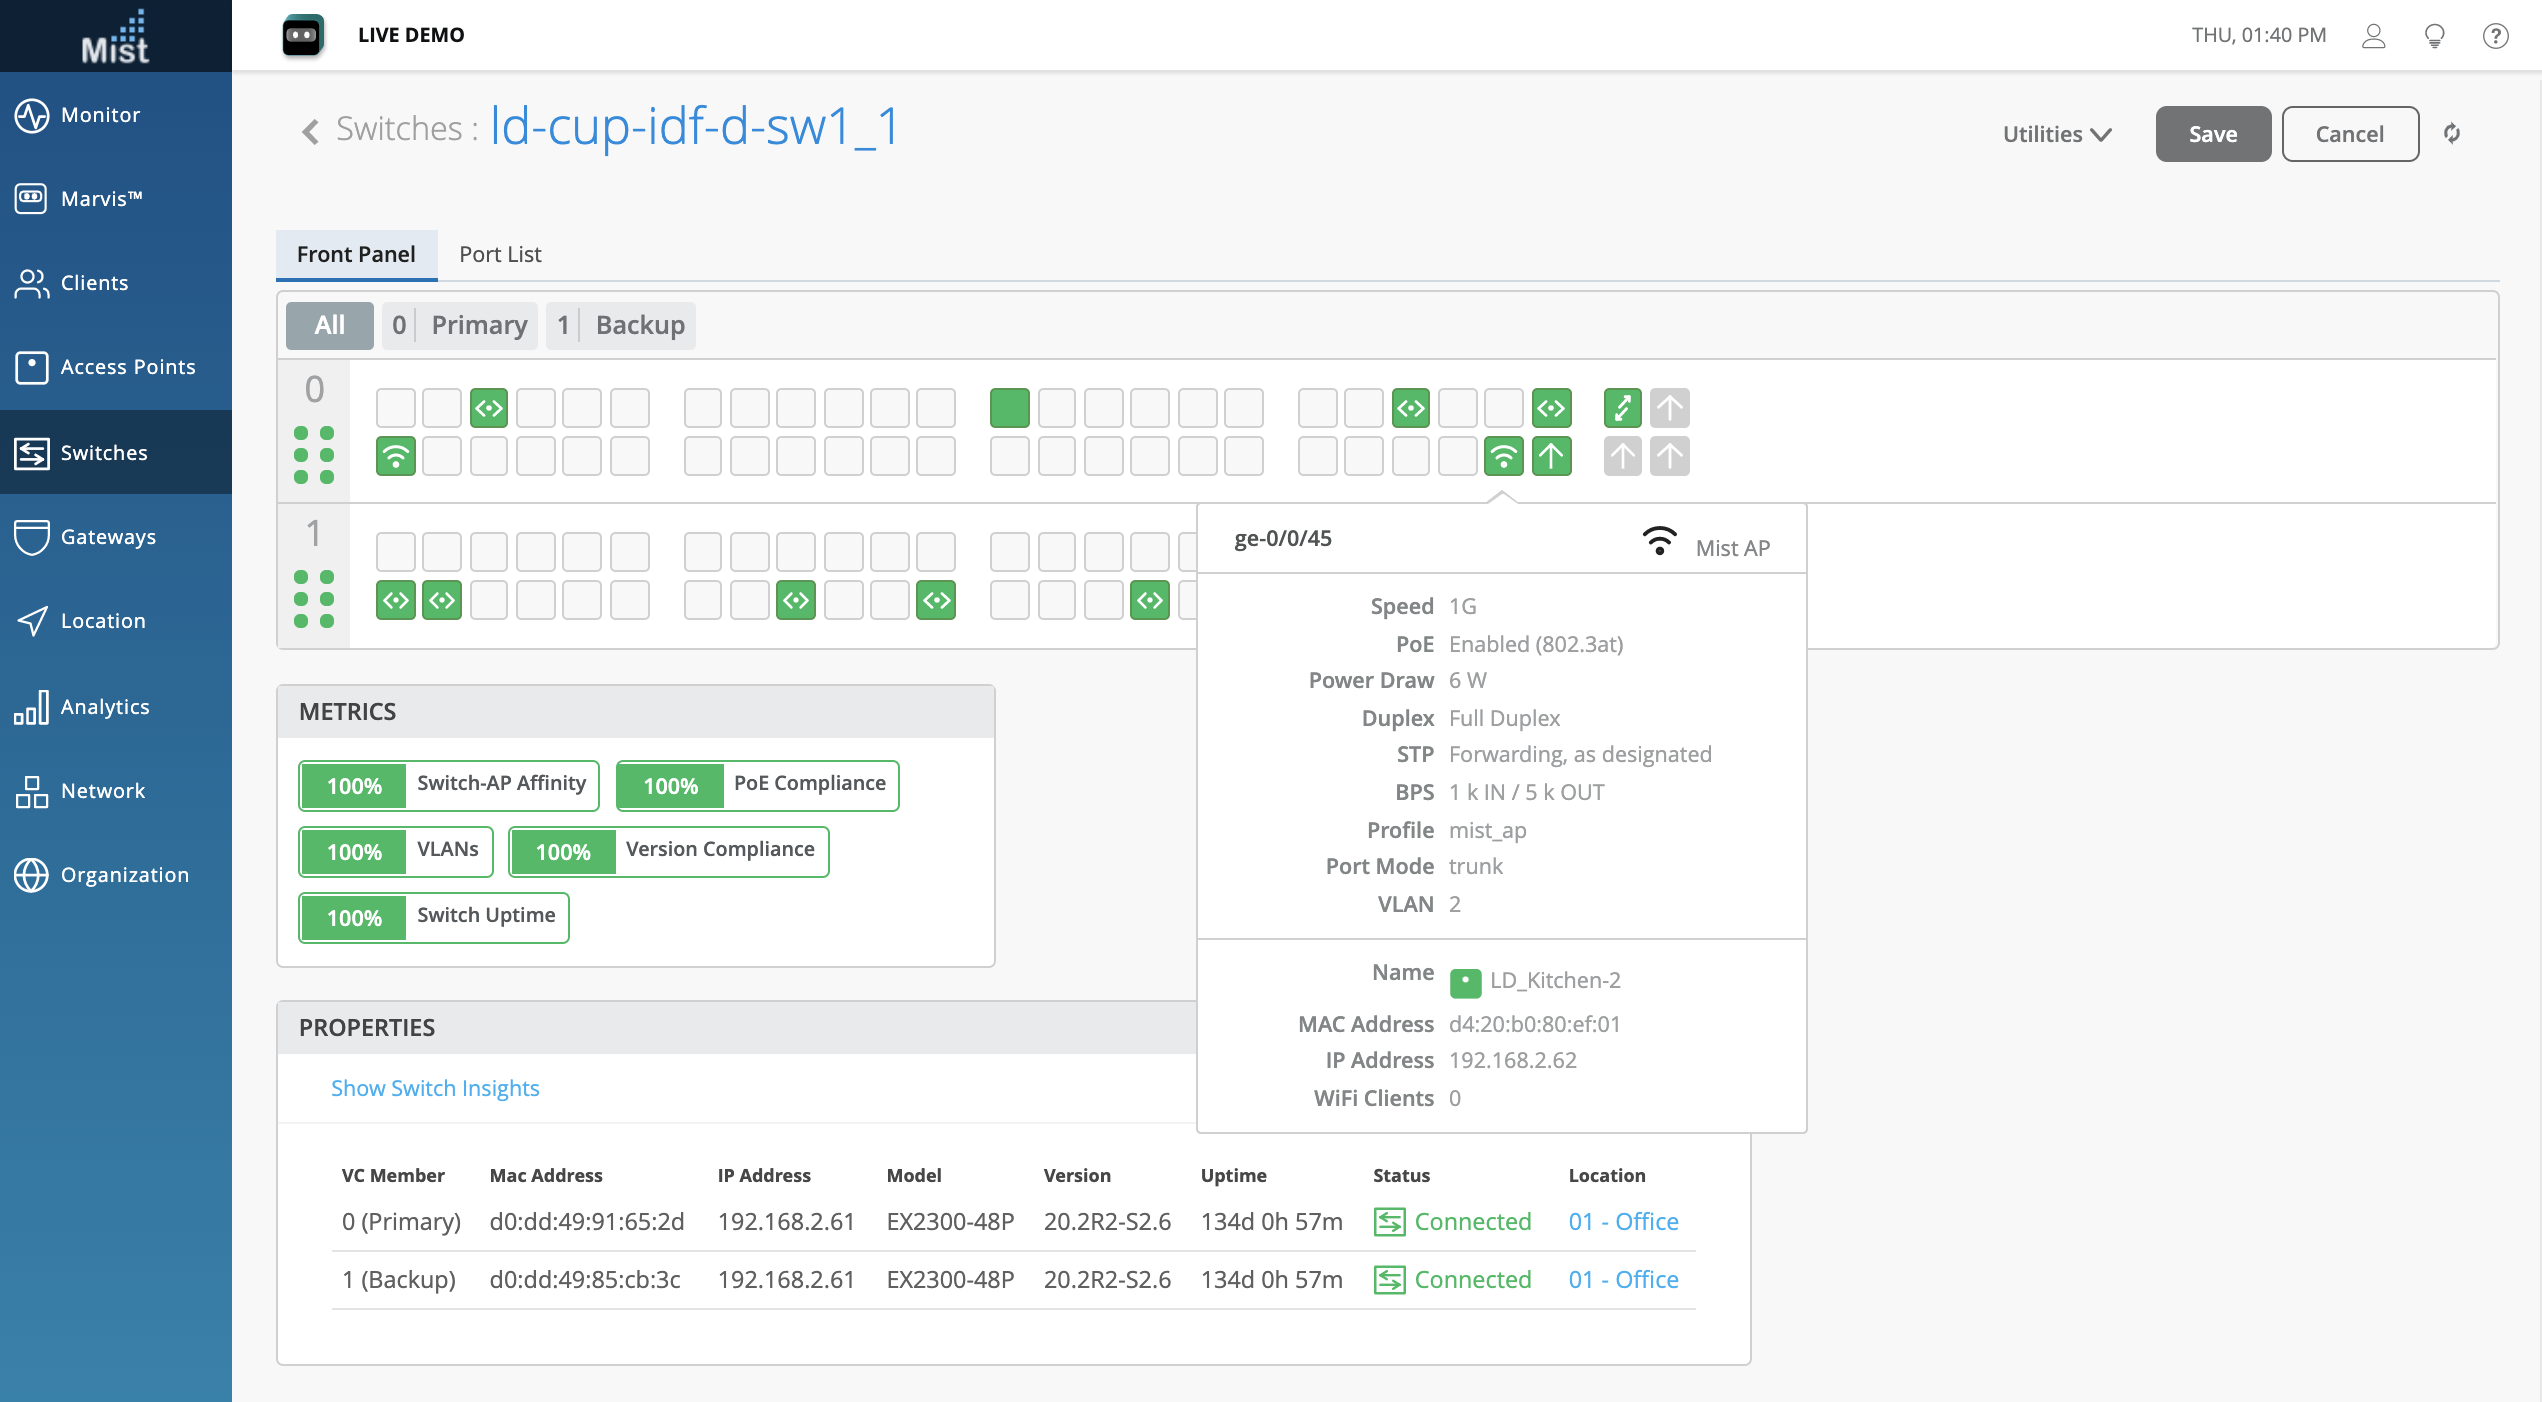
You may hover over the ports to get a more detailed overview of its status. Here, we are hovering over port 44, which indicates that a Mist AP is connected. We can see the full details right from the hover, including information about speed, power, and IP.
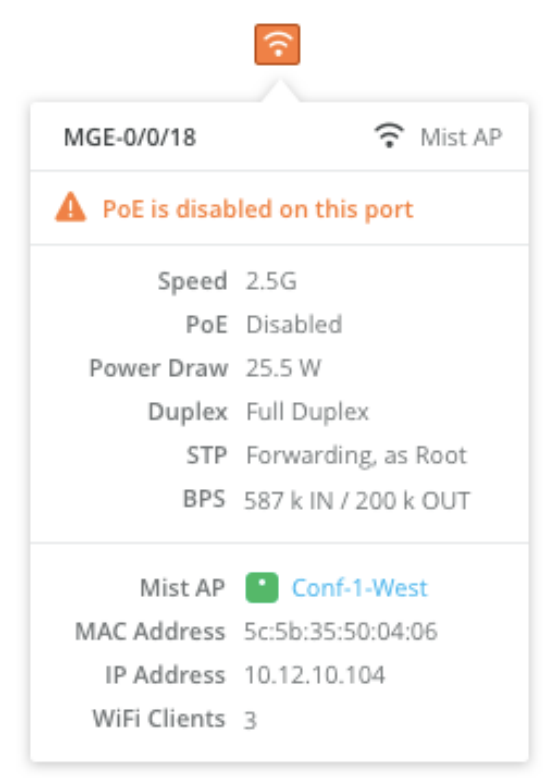
When hovering over a port with active alerts, you will be able to see the exact issue being experienced, as such:
NOTE: When the switch port is learning 2 MAC addresses on the same interface, it wont be able to identify which device’s MAC is connected on the port and to avoid this discrepancy we don’t display it as wired clients. The switch port icon will be a solid green color:

For example: There is a switch connected on one of the interfaces. In this case, all of the MAC addresses which are being learned by the connected switch will be included in the ethernet-switching table with same interface number. We can’t say which MAC is actually connected on this port and therefore don’t show any specific MAC. However, if the connected port has LLDP enabled, then we can be sure that the switch is connected on it.
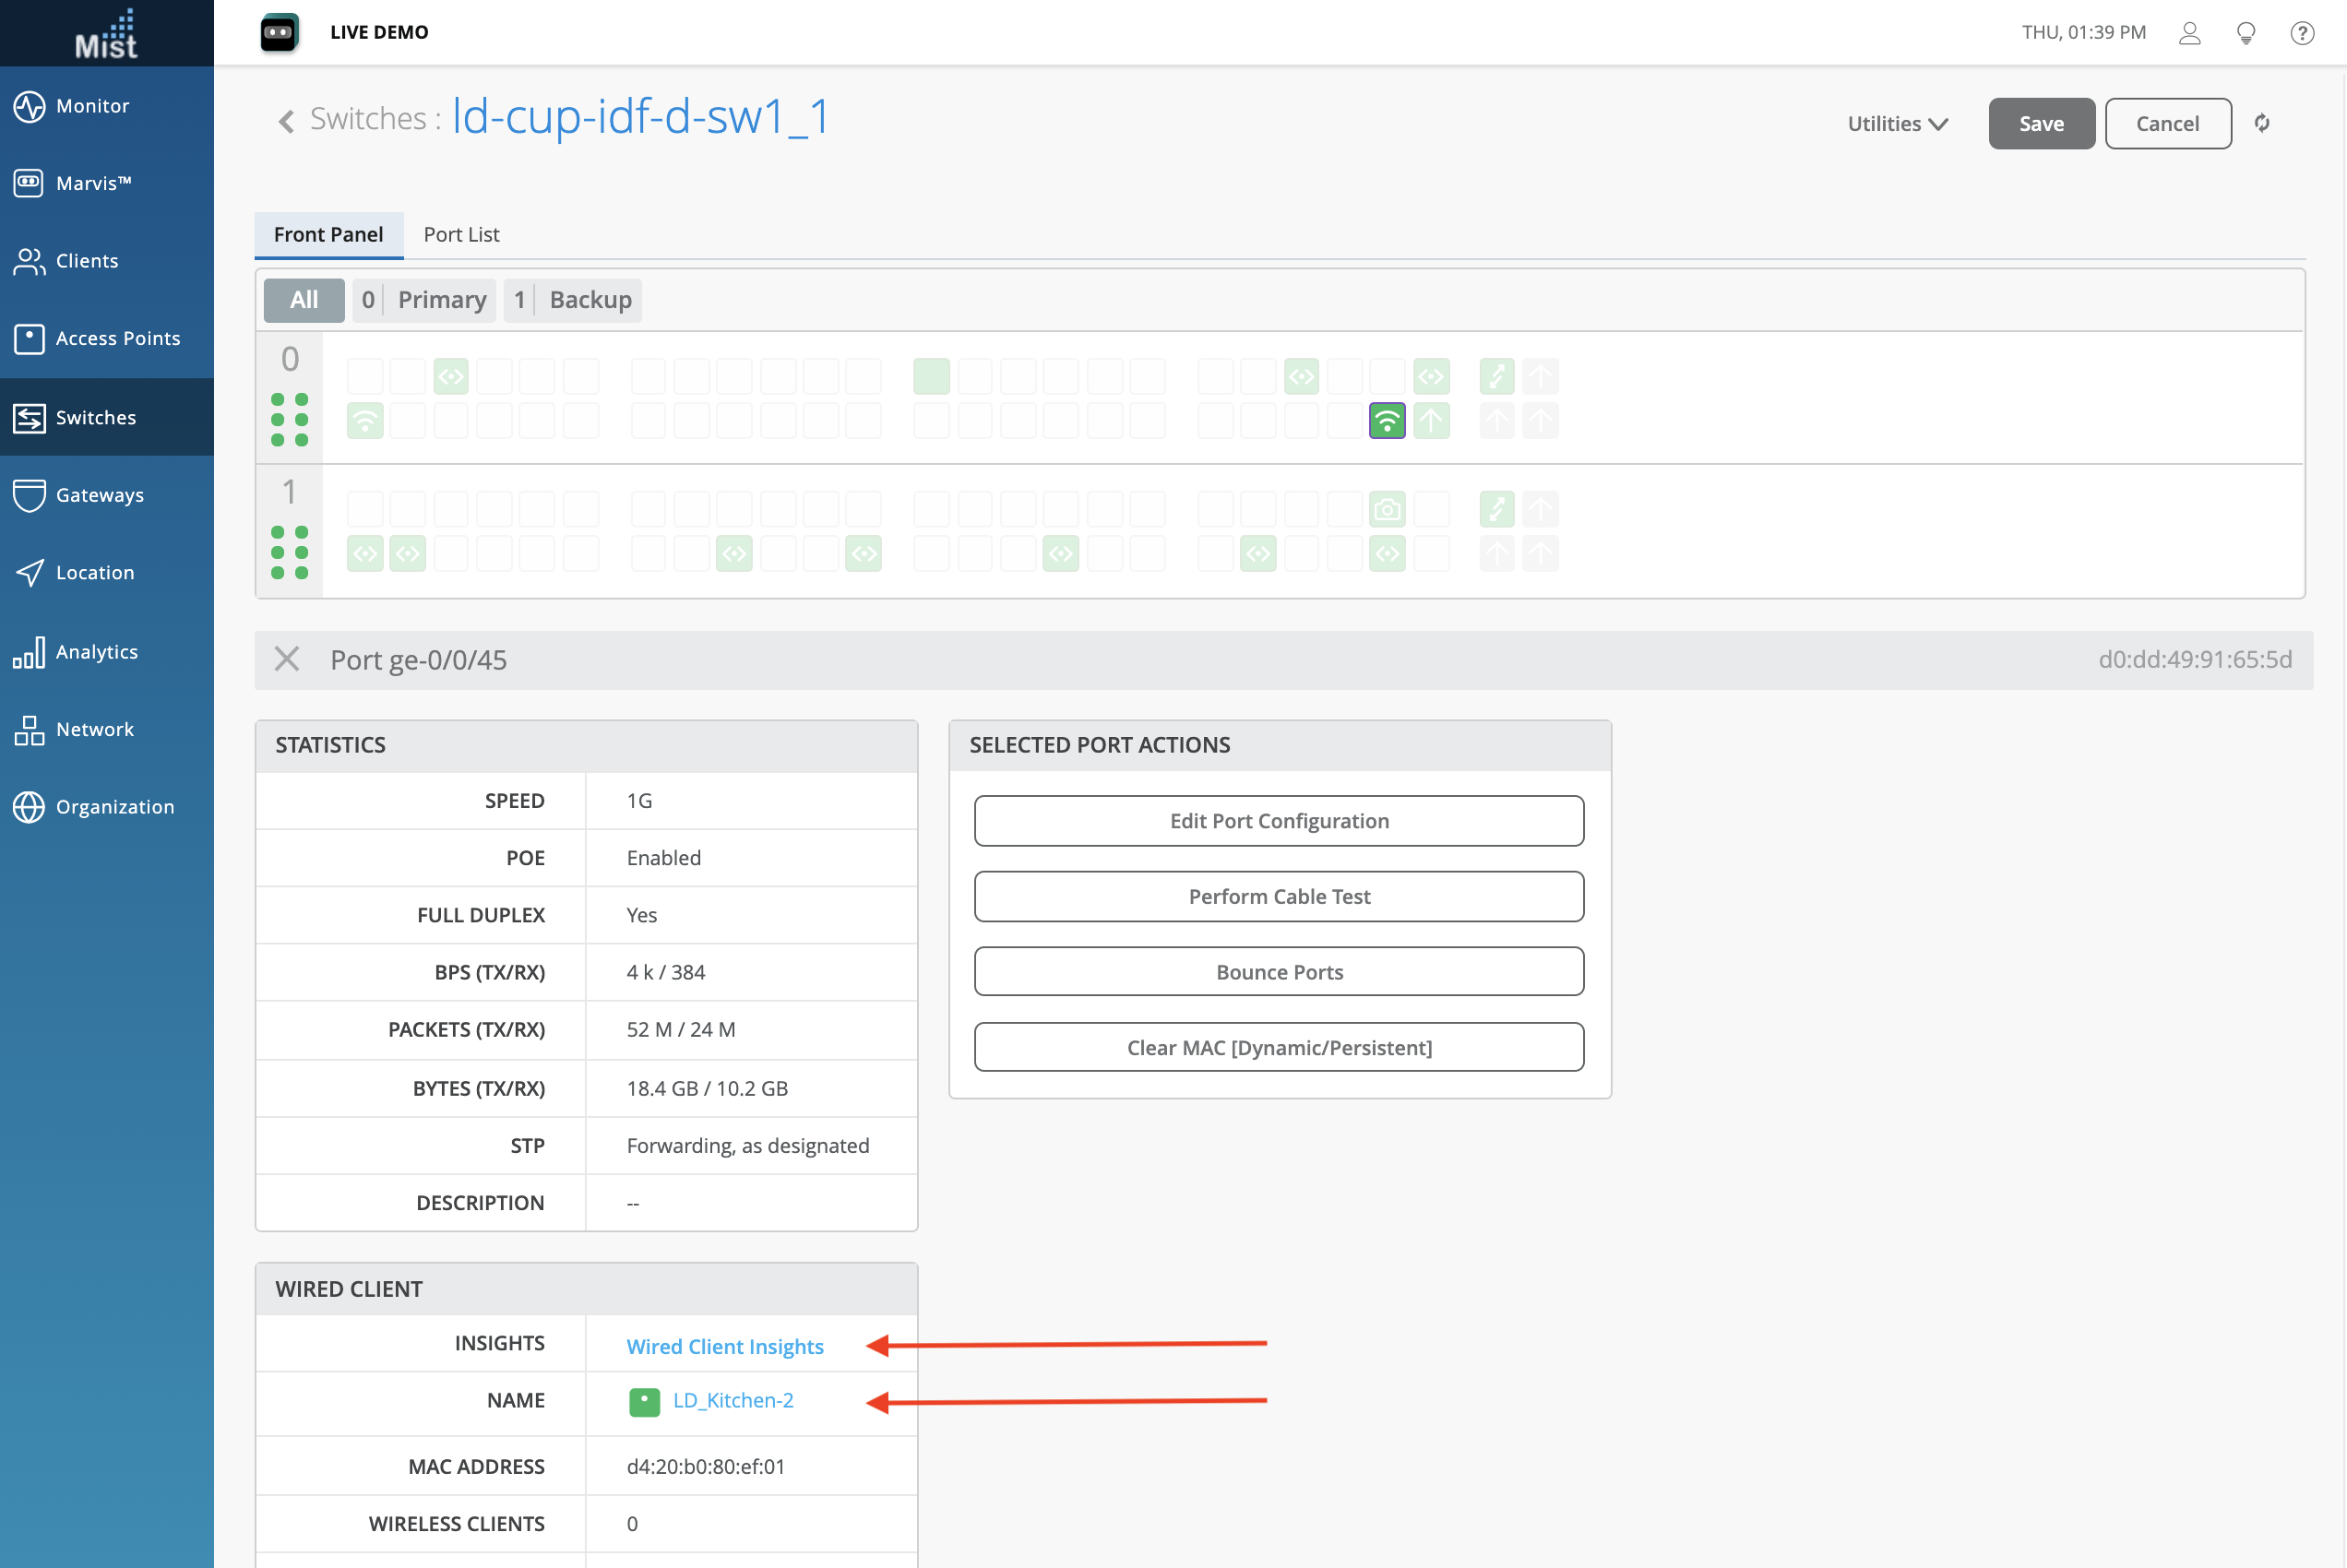
Clicking on the port will highlight the port details directly on this page. From here, you can select Wired Client Insights to go to the Insights page for the AP. Or you click the AP name itself, which will take you to the Access Points Details page of the AP.
Usage Indicators
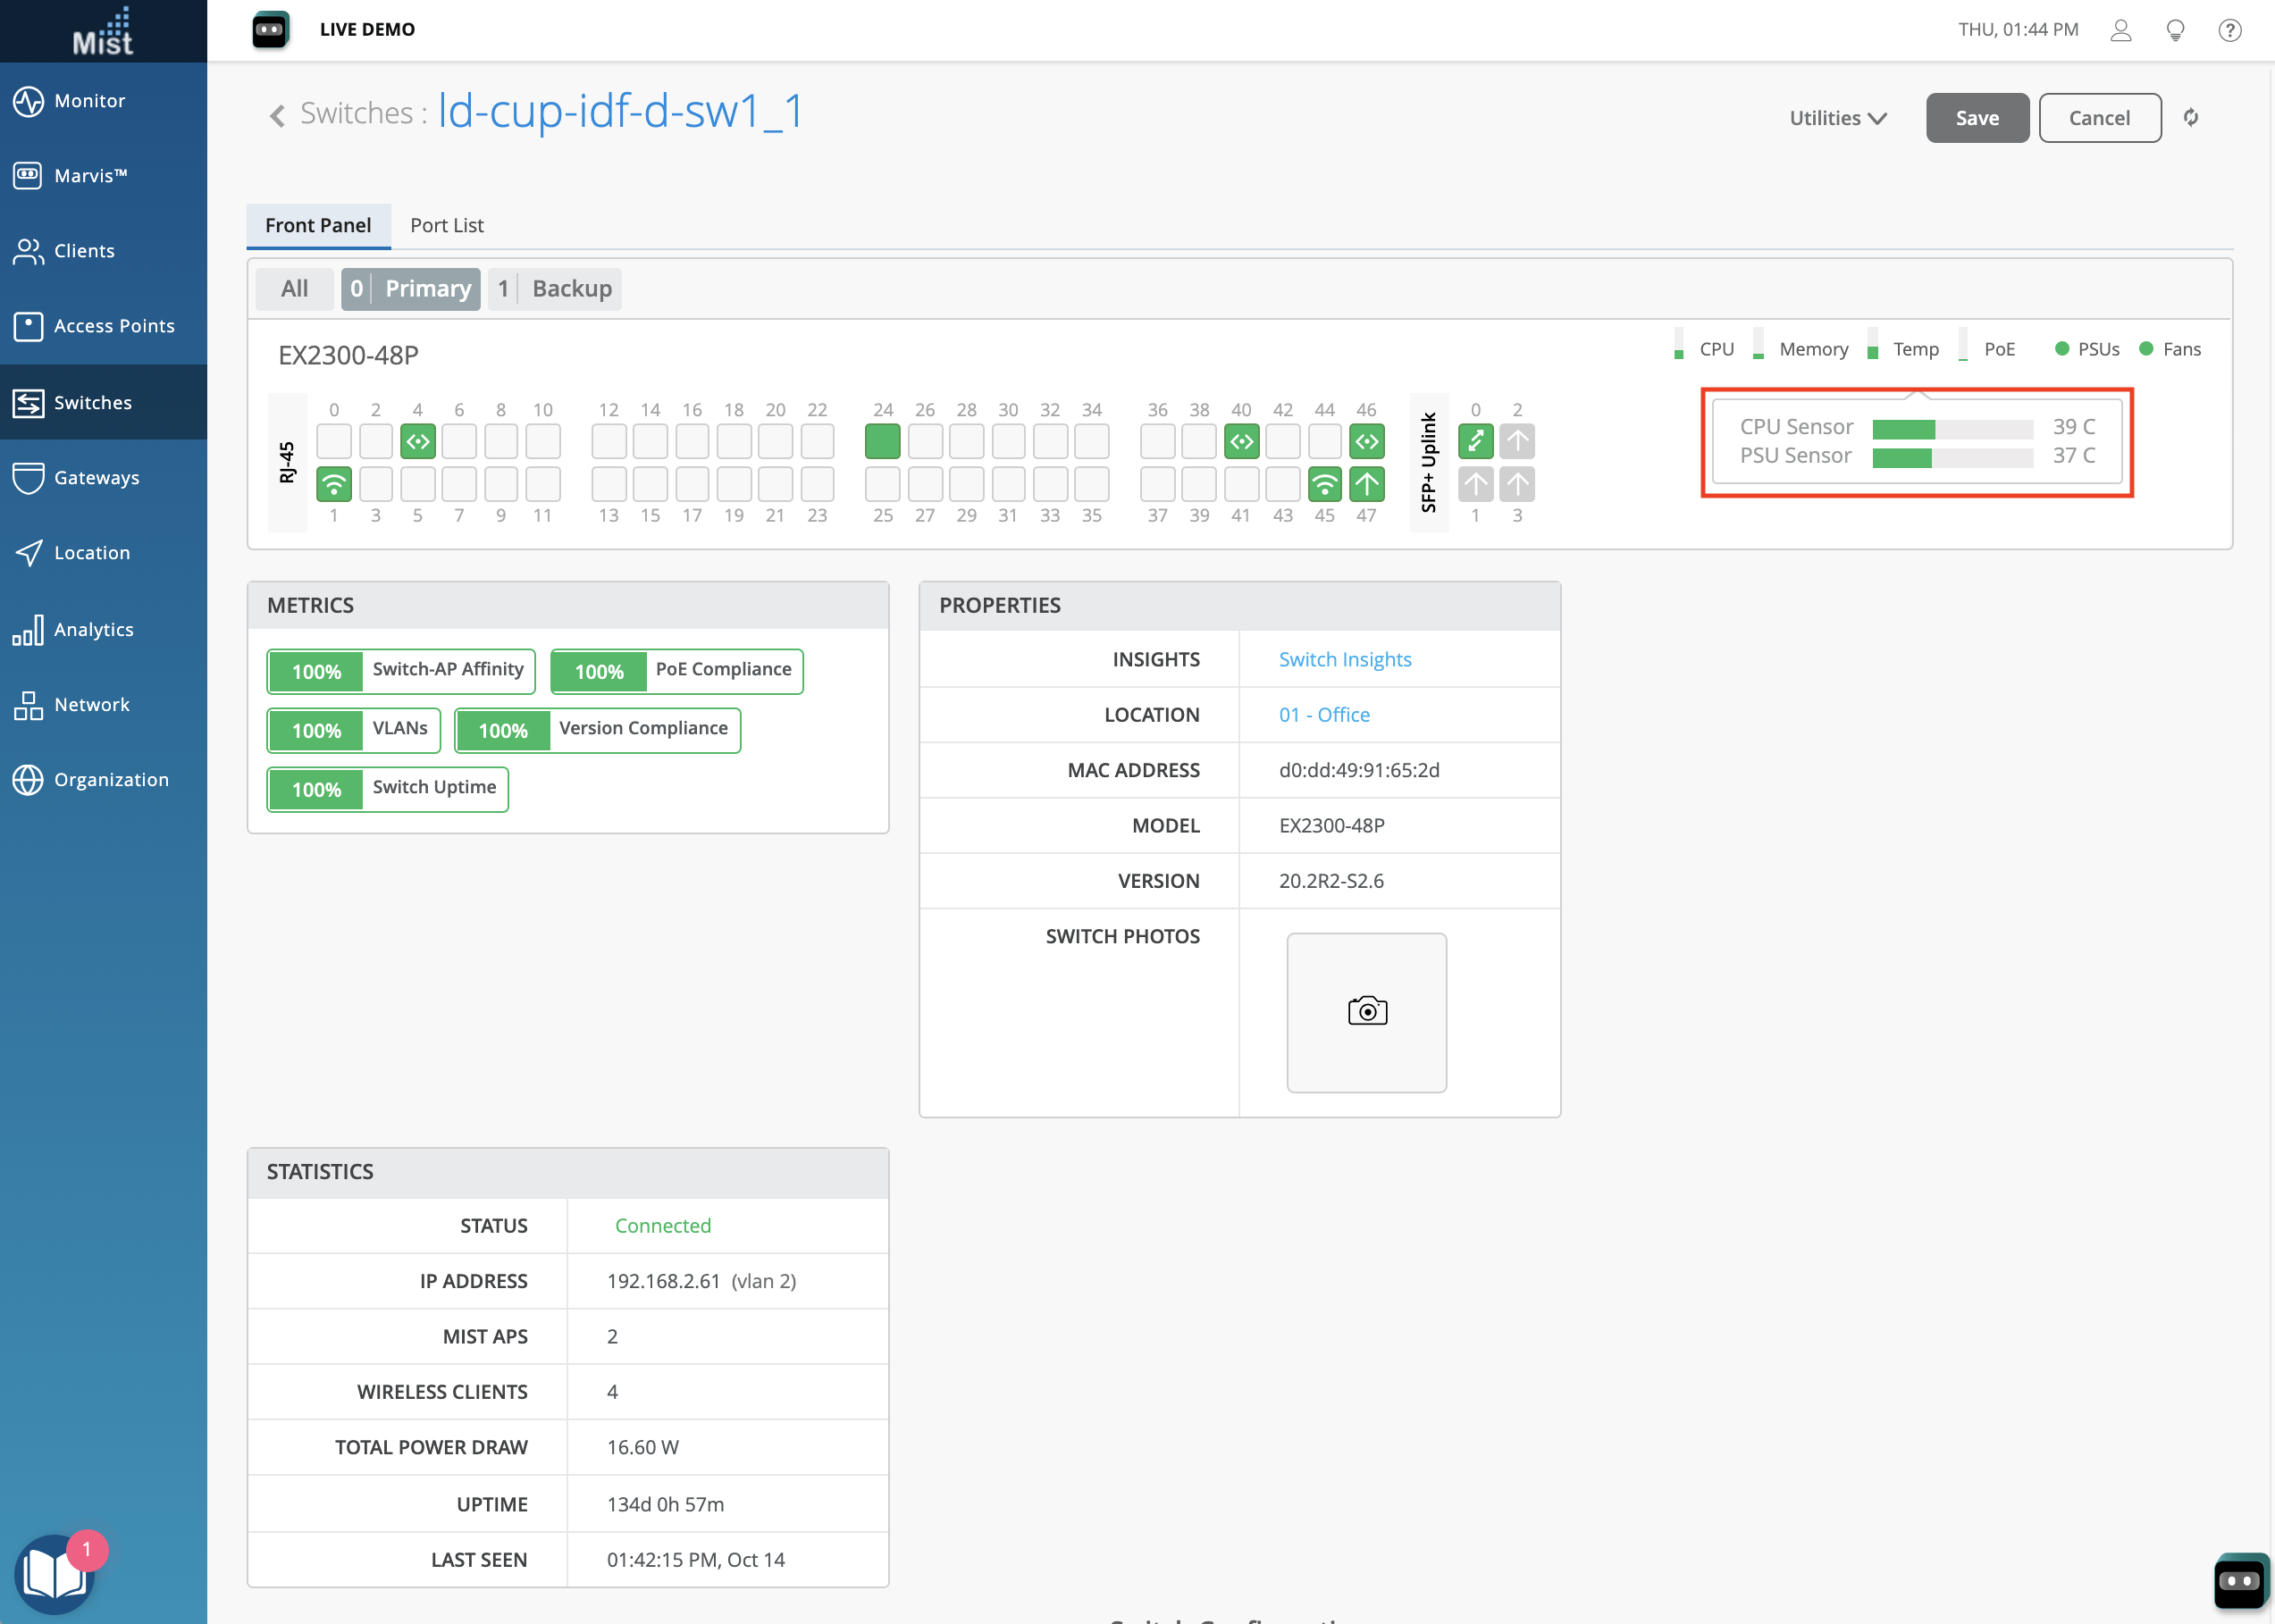
In addition to hovering over the ports to get a more detailed view, you can also hover over the usage indicators of the switch to get the same. Simply hover over any of the elements on the top right of the switch to see more exact metrics on the usage. Here, we can see the temperatures of individual components inside the switch which contribute to the total Temp indicator:
Switch Utilities
In the Utilities dropdown menu on the switch page, you will find our switch troubleshooting tools, which include Reboot Switch, Send Switch Log to Mist, and various Testing Tools.
When experiencing any issues with your switch, use the Send Switch Log to Mist feature to send your switch logs to Mist so that when we help you troubleshoot your problem we can have a more complete picture of what is going on in the backend to give you the best service we can. You may have seen this feature before, since it is also in our AP Utilities dropdown menu.

There are a variety of Switch Testing Tools at your disposal as well. See our Switch Testing Tools page for more details on that: https://www.mist.com/documentation/switch-testing-tools/
Lastly, if you just need to reboot the entire switch you may do so by simply selecting the Reboot Switch button from the Utilities dropdown menu. With Juniper switches integrated directly into our Mist Dashboard, managing your network through the cloud has never been easier.