Monitoring the Mist Service Level Experience (SLE)
API Documentation:
Many endpoints used on the Mist WiFi Service Levels dashboard can be found in the API docs: https://api.mist.com/api/v1/docs/Site#insights (requires valid login)
or https://api.ac2.mist.com/api/v1/docs/Site#insights
Those endpoints which may not be found in the API docs are noted below.
Metrics/Classifiers:
Mist SLEs support metrics and classifiers. Metrics track whether the service level meets the configured threshold value. If a metric does not meet the threshold, then this failure may be attributed to one of the classifiers to further understand where the failure occurred.
The currently supported metrics and their classifiers are as follows:
AP Uptime: ap-availability
- AP Reboot: ap-reboot
- AP Unreachable: ap-unreachable
- Site Down: site-down
Capacity: capacity
- AP Load: AP-load
- Non WiFi Interference: non-wifi-interference
- WiFi Interference: wifi-interference
Coverage: coverage
- Asymmetry Downlink: asymmetry-downlink
- Asymmetry Uplink: asymmetry-uplink
- Weak Signal: weak-signal
Roaming: roaming
- Failed to Fast Roam: No-Fast-Roam
- Slow 11r Roams: Suboptimal-11r-roam
- Slow OKC Roams: Suboptimal-okc-roam
- Slow Standard Roams: Slow-Roam
Successful Connects: failed-to-connect
- Association: association
- Authorization: authorization
- DHCP: DHCP
Throughput: throughput
- Capacity: capacity
- Coverage: coverage
- Device Capability: device-capability
- Network Issues: network-issues
Time to Connect: time-to-connect
- Association: association
- Authorization: authorization
- DHCP: DHCP
- Internet Services: IP-Services
API Endpoints:
The UI utilizes a number of API endpoints to display the SLE data. Most of these endpoints are supported for the Site, AP, or Client scopes.
The key endpoints are as follows:
Metric List: Get the list of metrics for the given scope
- Endpoint: /api/v1/sites/:site_id/sle/scope/:scope_id/metrics
- Site: /api/v1/sites/:site_id/sle/site/:site_id/metrics
- AP: /api/v1/sites/:site_id/sle/ap/:ap_id/metrics
- Client: /api/v1/sites/:site_id/sle/client/:client_mac/metrics
Metric Threshold: Process the SLE threshold
- EP: /api/v1/sites/:site_id/sle/:scope/:scope_id/metric/:metric/threshold
-
- Site: /api/v1/sites/:site_id/sle/site/:site_id/metric/:metric/threshold
- AP: /api/v1/sites/:site_id/sle/ap/:ap_id/metric/:metric/threshold
- Client: /api/v1/sites/:site_id/sle/client/:client_mac/metric/:metric/threshold
Metric Histogram: Get the histogram for the SLE metric
- EP: /api/v1/sites/:site_id/sle/:scope/:scope_id/metric/:metric/histogram
-
- Site: /api/v1/sites/:site_id/sle/site/:site_id/metric/:metric/histogram
- AP: /api/v1/sites/:site_id/sle/ap/:ap_id/metric/:metric/histogram
- Client: /api/v1/sites/:site_id/sle/client/:client_mac/metric/:metric/histogram
- Parameters:
- start (ie: 1540591200)
- end (ie: 1540594800)
Metric Summary: Get the summary for the SLE metric
- EP: /api/v1/sites/:site_id/sle/:scope/:scope_id/metric/:metric/summary
- Site: /api/v1/sites/:site_id/sle/site/:site_id/metric/:metric/summary
- AP: /api/v1/sites/:site_id/sle/ap/:ap_id/metric/:metric/summary
- Client: /api/v1/sites/:site_id/sle/client/:client_mac/metric/:metric/summary
- Parameters:
- start
- end
Metric Impact Summary: Get impact summary counts optionally filtered by classifier and failure type
- EP: /api/v1/sites/:site_id/sle/:scope/:scope_id/metric/:metric/impact-summary
- Site: /api/v1/sites/:site_id/sle/site/:site_id/metric/:metric/impact-summary
- AP: /api/v1/sites/:site_id/sle/ap/:ap_id/metric/:metric/impact-summary
- Parameters:
- start
- end
- fields=wlan,device_type,device_os,band
- classifier=:classifier (optional)
Classifier Summary: Get SLE classifier details
- EP: /api/v1/sites/:site_id/sle/:scope/:scope_id/metric/:metric/classifier/:classifier/summary
- Site: /api/v1/sites/:site_id/sle/site/:site_id/metric/:metric/classifier/:classifier/summary
- AP: /api/v1/sites/:site_id/sle/ap/:ap_id/metric/:metric/classifier/:classifier/summary
- Parameters:
- start
- end
Metric Impacted Ap List: Get impacted APs optionally filtered by classifier and failure type
- EP (Site): /api/v1/sites/:site_id/sle/site/:site_id/metric/:metric/impacted-aps
- Parameters:
- start
- end
- classifier=:classifier (optional)
Metric Impacted User List: Get impacted users optionally filtered by classifier and failure type
- EP: /api/v1/sites/:site_id/sle/:scope/:scope_id/metric/:metric/impacted-users
- Site: /api/v1/sites/:site_id/sle/site/:site_id/metric/:metric/impacted-users
- AP: /api/v1/sites/:site_id/sle/ap/:ap_id/metric/:metric/impacted-users
- Parameters:
-
- start
- end
- classifier=:classifier (optional)
Calculating SLE Percentages:
The SLE metric success rate is calculated as a percentage of how often the threshold was met during the selected timeframe. Classifiers are also calculated as percentages, but these values indicate their impact towards the parent failure.
For example, the below screenshot shows Time to Connect succeeded 96% of the time; all clients who successfully connected from 3:00-4:00pm completed the connection process within the 4 second threshold.
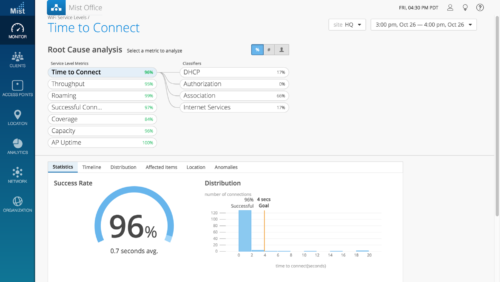
This metric’s success rate (%) is derived from the “Metric Summary” API endpoint: /api/v1/sites/:site_id/sle/site/:site_id/metric/time-to-connect/summary?start=1540591200&end=1540594800
{
“start”: 1540591200,
“end”: 1540594800,
“sle”: {
“x_label”: “seconds”,
“y_label”: “seconds”,
“interval”: 600,
“name”: “time-to-connect”,
“samples”: {
“degraded”: [
0.0,
0.0,
3.0,
0.0,
3.0,
0.0
],
“total”: [
19.0,
14.0,
34.0,
8.0,
20.0,
43.0
]
}
}
}
The metric failure rate is calculated by dividing the failures (sle.samples.degraded) by the total (sle.samples.total). This is then translated to the success rate percentage. Using the above API response payload, the calculation would look as follows:
ceil(1-[(0.0+0.0+3.0+0.0+3.0+0.0)/(19.0+14.0+34.0+8.0+20.0+43.0)])*100=
ceil(1-[6/138])*100=
ceil(1-0.04347826086)*100=
ceil(0.95652173914)*100=
0.96*100=
=96%
The below screenshot drills down into Time to Connect to understand which classifiers contributed to the metric failures:
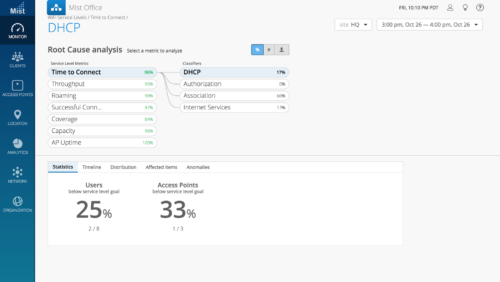
The classifier’s impact (%) is derived from the same “Metric Summary” API endpoint: /api/v1/sites/:site_id/sle/site/:site_id/metric/time-to-connect/summary?start=1540591200&end=1540594800
{
“start”: 1540591200,
“end”: 1540594800,
“classifiers”: [
{
“name”: “DHCP”,
“samples”: {
“degraded”: [
0,
0,
0,
0,
1.0,
0
]
}
},
{
“name”: “authorization”,
“samples”: {
“degraded”: [
0,
0,
0,
0,
0,
0
]
}
},
{
“name”: “association”,
“samples”: {
“degraded”: [
0,
0,
3.0,
0,
1.0,
0
]
}
},
{
“name”: “IP-Services”,
“samples”: {
“degraded”: [
0,
0,
0,
0,
1.0,
0
]
}
}
]
}
The classifier impact is calculated by dividing the classifier’s failures (classifiers[n].samples.degraded) by the sum of all failures (classifiers[].samples.degraded). This is then translated to a percentage. Using the above API response payload, the calculation for DHCP would look as follows:
ceil([0+0+0+0+1.0+0]/[(0+0+0+0+1.0+0)+(0+0+0+0+0+0)+(0+0+3.0+0+1.0+0)+(0+0+0+0+1.0+0)])*100=
ceil(1/[1.0+0+4.0+1.0])*100=
ceil(1/6)*100=
ceil(0.16666666666)*100=
0.17*100=
=17%
Monitoring SLEs:
SLE data is updated every 10 minutes. However, the SLEs are prone to fluctuations when monitoring at this granularity. Thus it is recommended to query for 1-hour intervals using the explicit start/end time, and polling only once per hour.