Mist Predictive Analytics and Correlation Engine (PACE) provides the Industry’s true first attempt at applying data science and machine learning to understand the actual end user experience on the network.
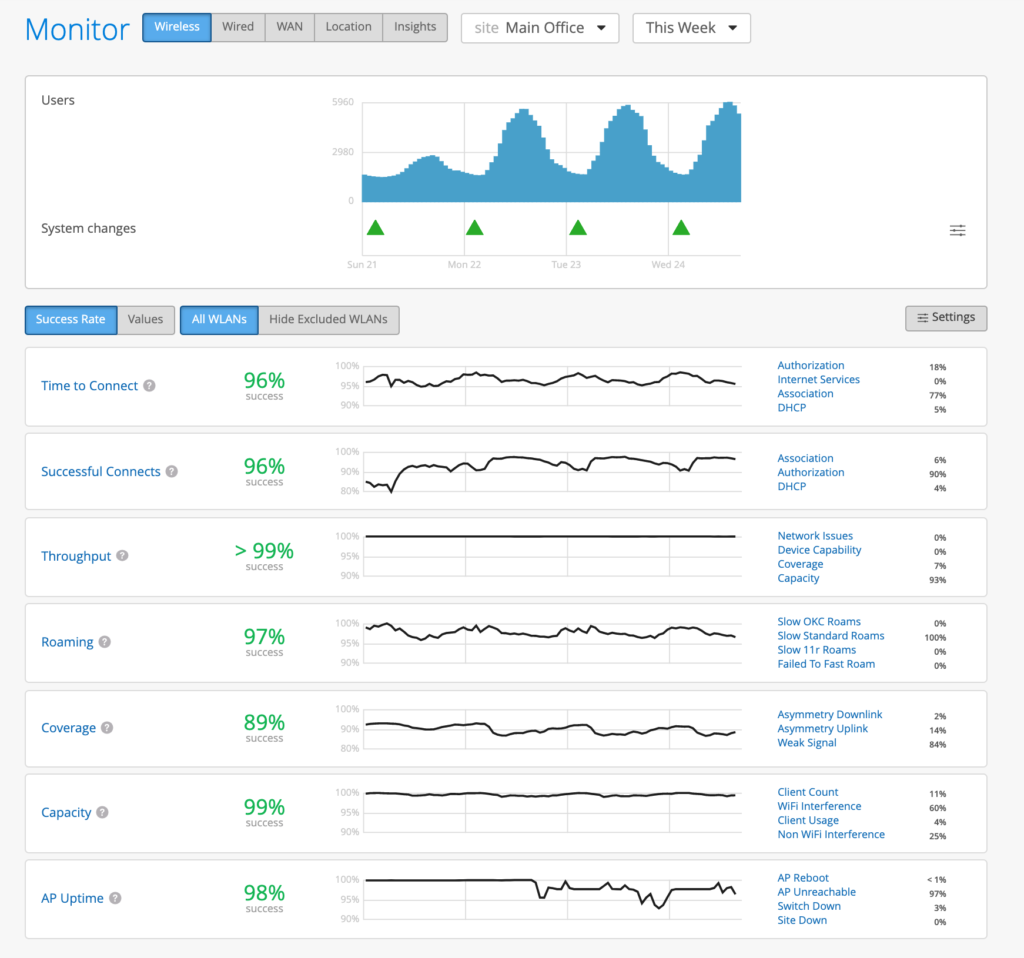
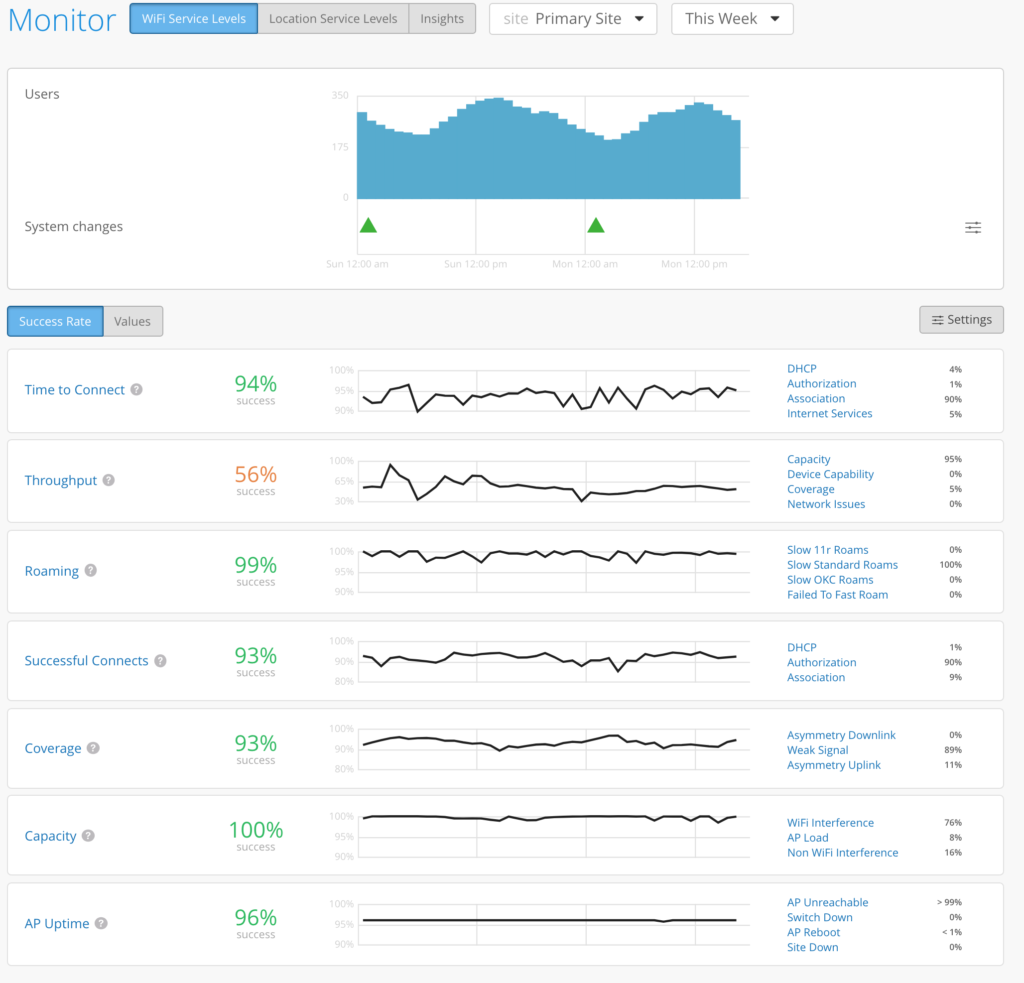
The primary Mist dashboard presents the results of the PACE engine, in the form of Service Level Experience metrics (SLE) Metrics.
Mist PACE monitors 7 Services Level Experience (SLE) metrics.
- Time to Connect
- Throughput
- Coverage
- Capacity
- Roaming
- Successful Connects
- AP Health
SLE Metric: Time to Connect:
This SLE metric tracks the number of connections that took longer than the specified threshold to connect to the internet. The time to connect to the internet is calculated as the time from the start of the association packet from the mobile client to the point where the client is able to successfully move data.
time_to_connect = tconnected – tfirst-assoc
The classifiers for this metric are fired if the time_to_connect exceeds threshold.
note:
If the client fails to connect to the internet, this metric does not count the connection towards the connect-time metric. That is tracked by a separate service level metric. Current implementation has the classifiers divide up the time_to_connect into various buckets.
time_to_connect = sum(all tclassifier)
Classifiers
- Association Latency
- This classifier is assigned if a users’s time to go past the “association” state is more than 2 sigma from the average association latency, for this site
- Authentication Latency
- This classifier is assigned if a user’s time to go past the “authentication” state is more than 2 sigma from the average authentication latency, for this site.
- DHCP Latency
- This classifier is assigned if a user’s DHCP time is more than 2 sigma from the average DCHP time of fully completed successful connections for this site.
- IP Services Latency
- This classifier is triggered if the time between dhcp and the first dns packet is more than 2 sigma from the moving average for this site.
SLE Metric: Throughput
This SLE metric tracks the amount of time, that a client’s estimated throughput is below the threshold configured by the customer in the graph.
A client’s estimated throughput is defined as the probabilistic throughput given the clients, current wireless conditions. The estimator consider many effects, such as AP bandwidth, load, interference events, the type of wireless device (protocol, number of streams), signal strength, and wired bandwidth. It is calculated on a per client basis for the whole site.
Four classifiers are defined for low throughput. These four are the likely causes for potential low throughput.
Classifiers
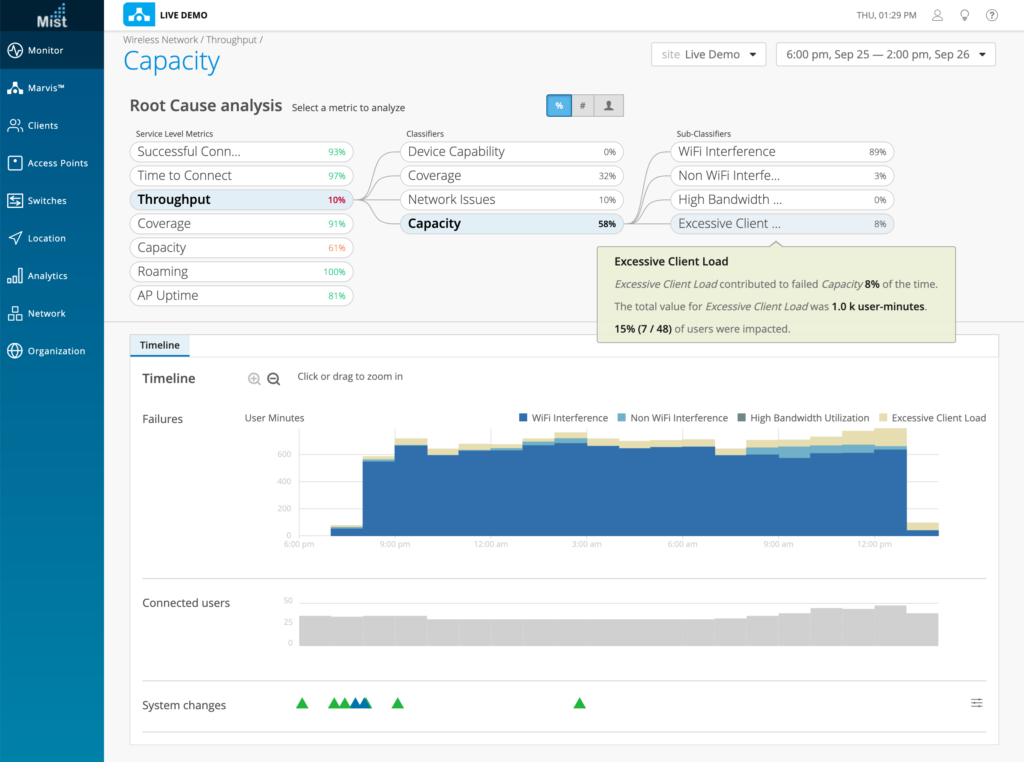
We have improved the data accuracy and visible information for our Throughput SLE Metric. The Capacity classifier can now be expanded to reveal four sub-classifiers to provide a more granular view into specific reasons for Capacity issues in your Throughput metric. The sub-classifiers for Throughput > Capacity are:
- Device Capability
- This metric tracks the user minutes that client’s throughput is below the configured threshold, primarily due to the capacity of device.
- Capacity
- WiFi Interference
- Non WiFi Interference
- High Bandwidth Utilization
- Excessive Client Load
- Coverage
- This metric tracks the user minutes that client’s throughput is below the configured threshold, primarily due to the client’s weak signal strength.
- Network Issues
- This metric tracks the user minutes that client’s predicted throughput is below the configured threshold, primarily by the capacity of wired network.
- This classifier estimates WAN throughput based on max throughput seen across all APs in the site. As well as monitors for abnormal latency and jitter.
In these sub-classifiers, you may examine Users and Access Points below the service level goal, the Timeline of failures and system changes, as well as the distribution of failures and affected items relating to the sub-classifier.
SLE Metric: Coverage
This SLE metric tracks the number of user minutes that a client’s RSSI as measured by the access point is below the threshold configurable by IT. This metric accounts for client activity – if the client is not active, the classifiers are not fired. The Asymmetry classifiers display bad coverage between the client and the AP. This field is usually displayed in minutes (Number of minutes of bad coverage). Asymmetry indicates there is a power level mismatch between the client & AP. Since APs are capable of higher power levels than a client, if power levels are set too high, then there is a chance that the low powered client is not heard by the AP, resulting in an asymmetry uplink issue. Asymmetry measurements are divided into 2 Classifiers: Asymmetry Uplink and Asymmetry Downlink.
Classifiers
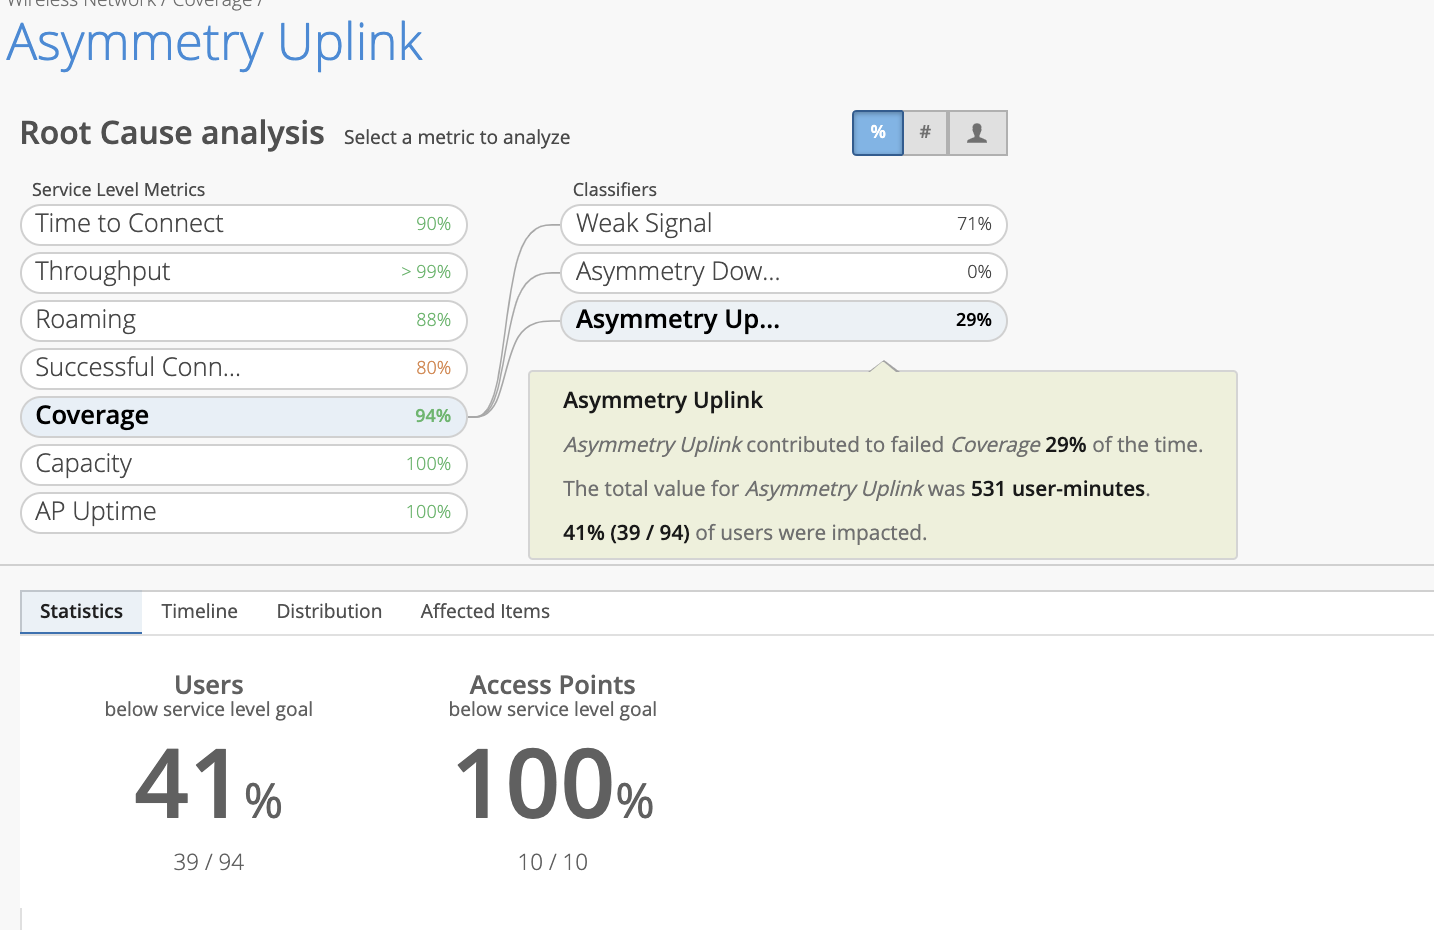
- Asymmetry Uplink
- This classifier tracks the number of user minutes that a client experiences bad coverage that can be attributed to asymmetric uplink transmit powers between the AP and client device. Meaning, the AP hears a weak signal from the clients for a number of minutes. There are various reasons causing this, like clients being too far from the AP. The traffic going from the client to the AP, and then to Internet is called uplink traffic.
- Asymmetry Downlink
- This classifier tracks the number of user minutes that a client experiences bad coverage that can be attributed to asymmetric downlink transmit powers between the AP and client device. Meaning, clients are hearing a weak signal from the AP. The traffic going from the AP to the client is called downlink traffic.
- Weak Signal
- This classifier tracks all other user minutes below the RSSI threshold.
In this example, we see that Asymmetry Downlink is zero and Asymmetry Uplink is 29%

The below says the AP was detecting weak signal strength from the clients for 531 minutes. Out of the 94 users, 39 users were far away from the AP, causing the AP to detect low signal strength.
SLE Metric: Capacity
The SLE metric tracks the user minutes that a client experiences bad capacity. This metric tracks the per-user available channel capacity and fires off classifiers when the available capacity drops below the specified SLE threshold.
Classifiers
- WiFi interference
- This classifier tracks the number of user minutes that a client experiences low capacity that can be attributed to interference.
- Non-WiFi interference
- This classifier tracks the number of user minutes that a client experiences low capacity that can be attributed to interference.
- Client Count
- This classifier tracks the number of user minutes that a client experiences low capacity that can be attributed to the number of attached clients.
- Client Usage
- This classifier tracks the number of user minutes that a client experiences low capacity that can be attributed to client load.
SLE Metric: Roaming
This SLE metric tracks the percentage of successful roams between 2 access points for clients that are within the prescribed thresholds. The user defines the threshold as a target time it takes for a client to roam. Fast roaming as defined by 802.11r and OKC are for clients using RADIUS based authentication.
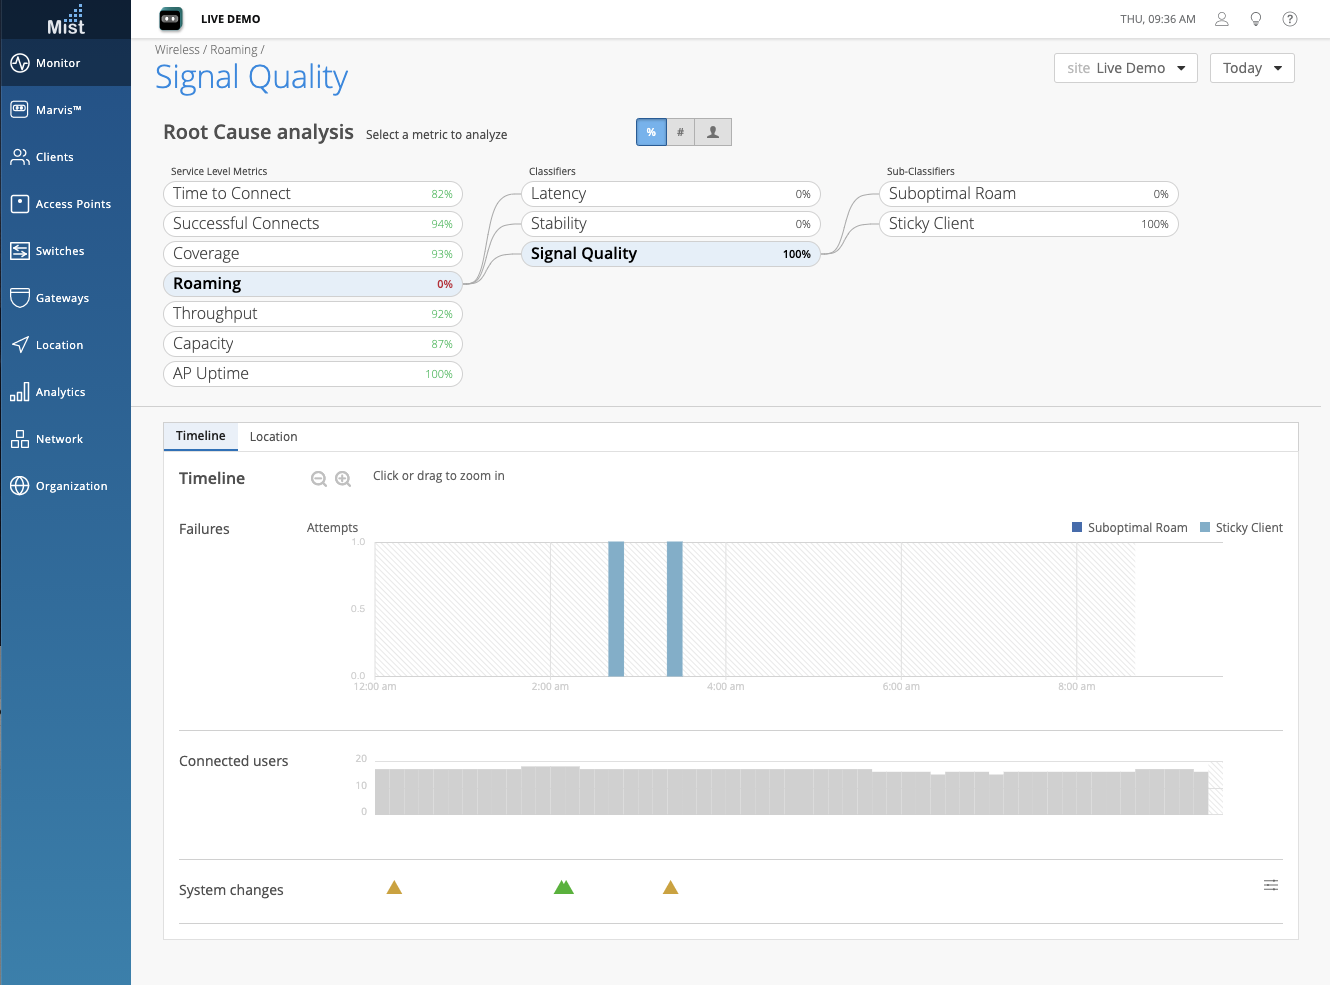
The Latency Classifier tracks the delta time between clients roaming across APs. The Sub-classifiers that make up the Latency Classifier should look familiar, as they were all present in the previous iteration of our Roaming SLE. These Sub-classifiers are: Slow OKC Roams, Slow 11r Roams, and Slow Standard Roams. Slow OKC and 11r roams occur when the roam time exceeds 400 ms. Slow standard roams occur when the roam time exceeds two seconds.
The Stability Classifier tracks the consistency of AP choice and 11r usage during client roams. For now, this contains one Sub-classifier: Failed to fast Roam. This classifier is assigned if a fast roam capable user on a fast roam enabled SSID experienced a slow roam that took more than 2 seconds.
The Signal Quality Classifier is all new and tracks the RSSI of clients during a roam event. Here, we have the new Sub-classifiers Suboptimal Roam, and Sticky Client. Suboptimal Roam tracks when clients roam to an AP with more than a 6 dB decrease in RSSI from the previous AP, and if the new association RSSI is worse than the configured coverage SLE threshold (default -72 dBm). Sticky Client tracks when a client remains connected to an AP even when there are more roaming options available to improve the RSSI by more than 6 dB.
Additionally, the Roaming SLE success threshold has changed from time based to severity based. Severity is the score from 1 to 5, where 1 is excellent roaming in the site and 5 is poor roaming in the site. The default is a severity score of 2. Severity score of 3 is considered average, 4 is considered bad, and 5 is the worst.
SLE Metric: Successful Connects
This SLE metric tracks the percentage of successful Authorization, Association, DHCP, ARP, and DNS attempts during the initial connection by a client to the network, when a client roams from one AP to the next, and on an on-going basis.
AP Health
This is the latest SLE. Now, this Metric will be calculated using AP Reboots, AP Unreachable events, and Site Down events. AP Unreachable is when your AP loses cloud connectivity. This can be due to a WAN issue, or just when the AP is unplugged from the switch. Site Down events occur when all APs on your site are unreachable. Disconnected APs age-out of the SLE after seven days from the last seen time.