Simplified Operations
Metrics for Access Point Summary
We are excited to announce a summary view for the APs per site for your AP page! This new section is displayed at the top of the AP list view and outlines some basic stats and metrics of the APs on your site. Reference this area to get a nice breakdown of your different AP models and calculated metrics. 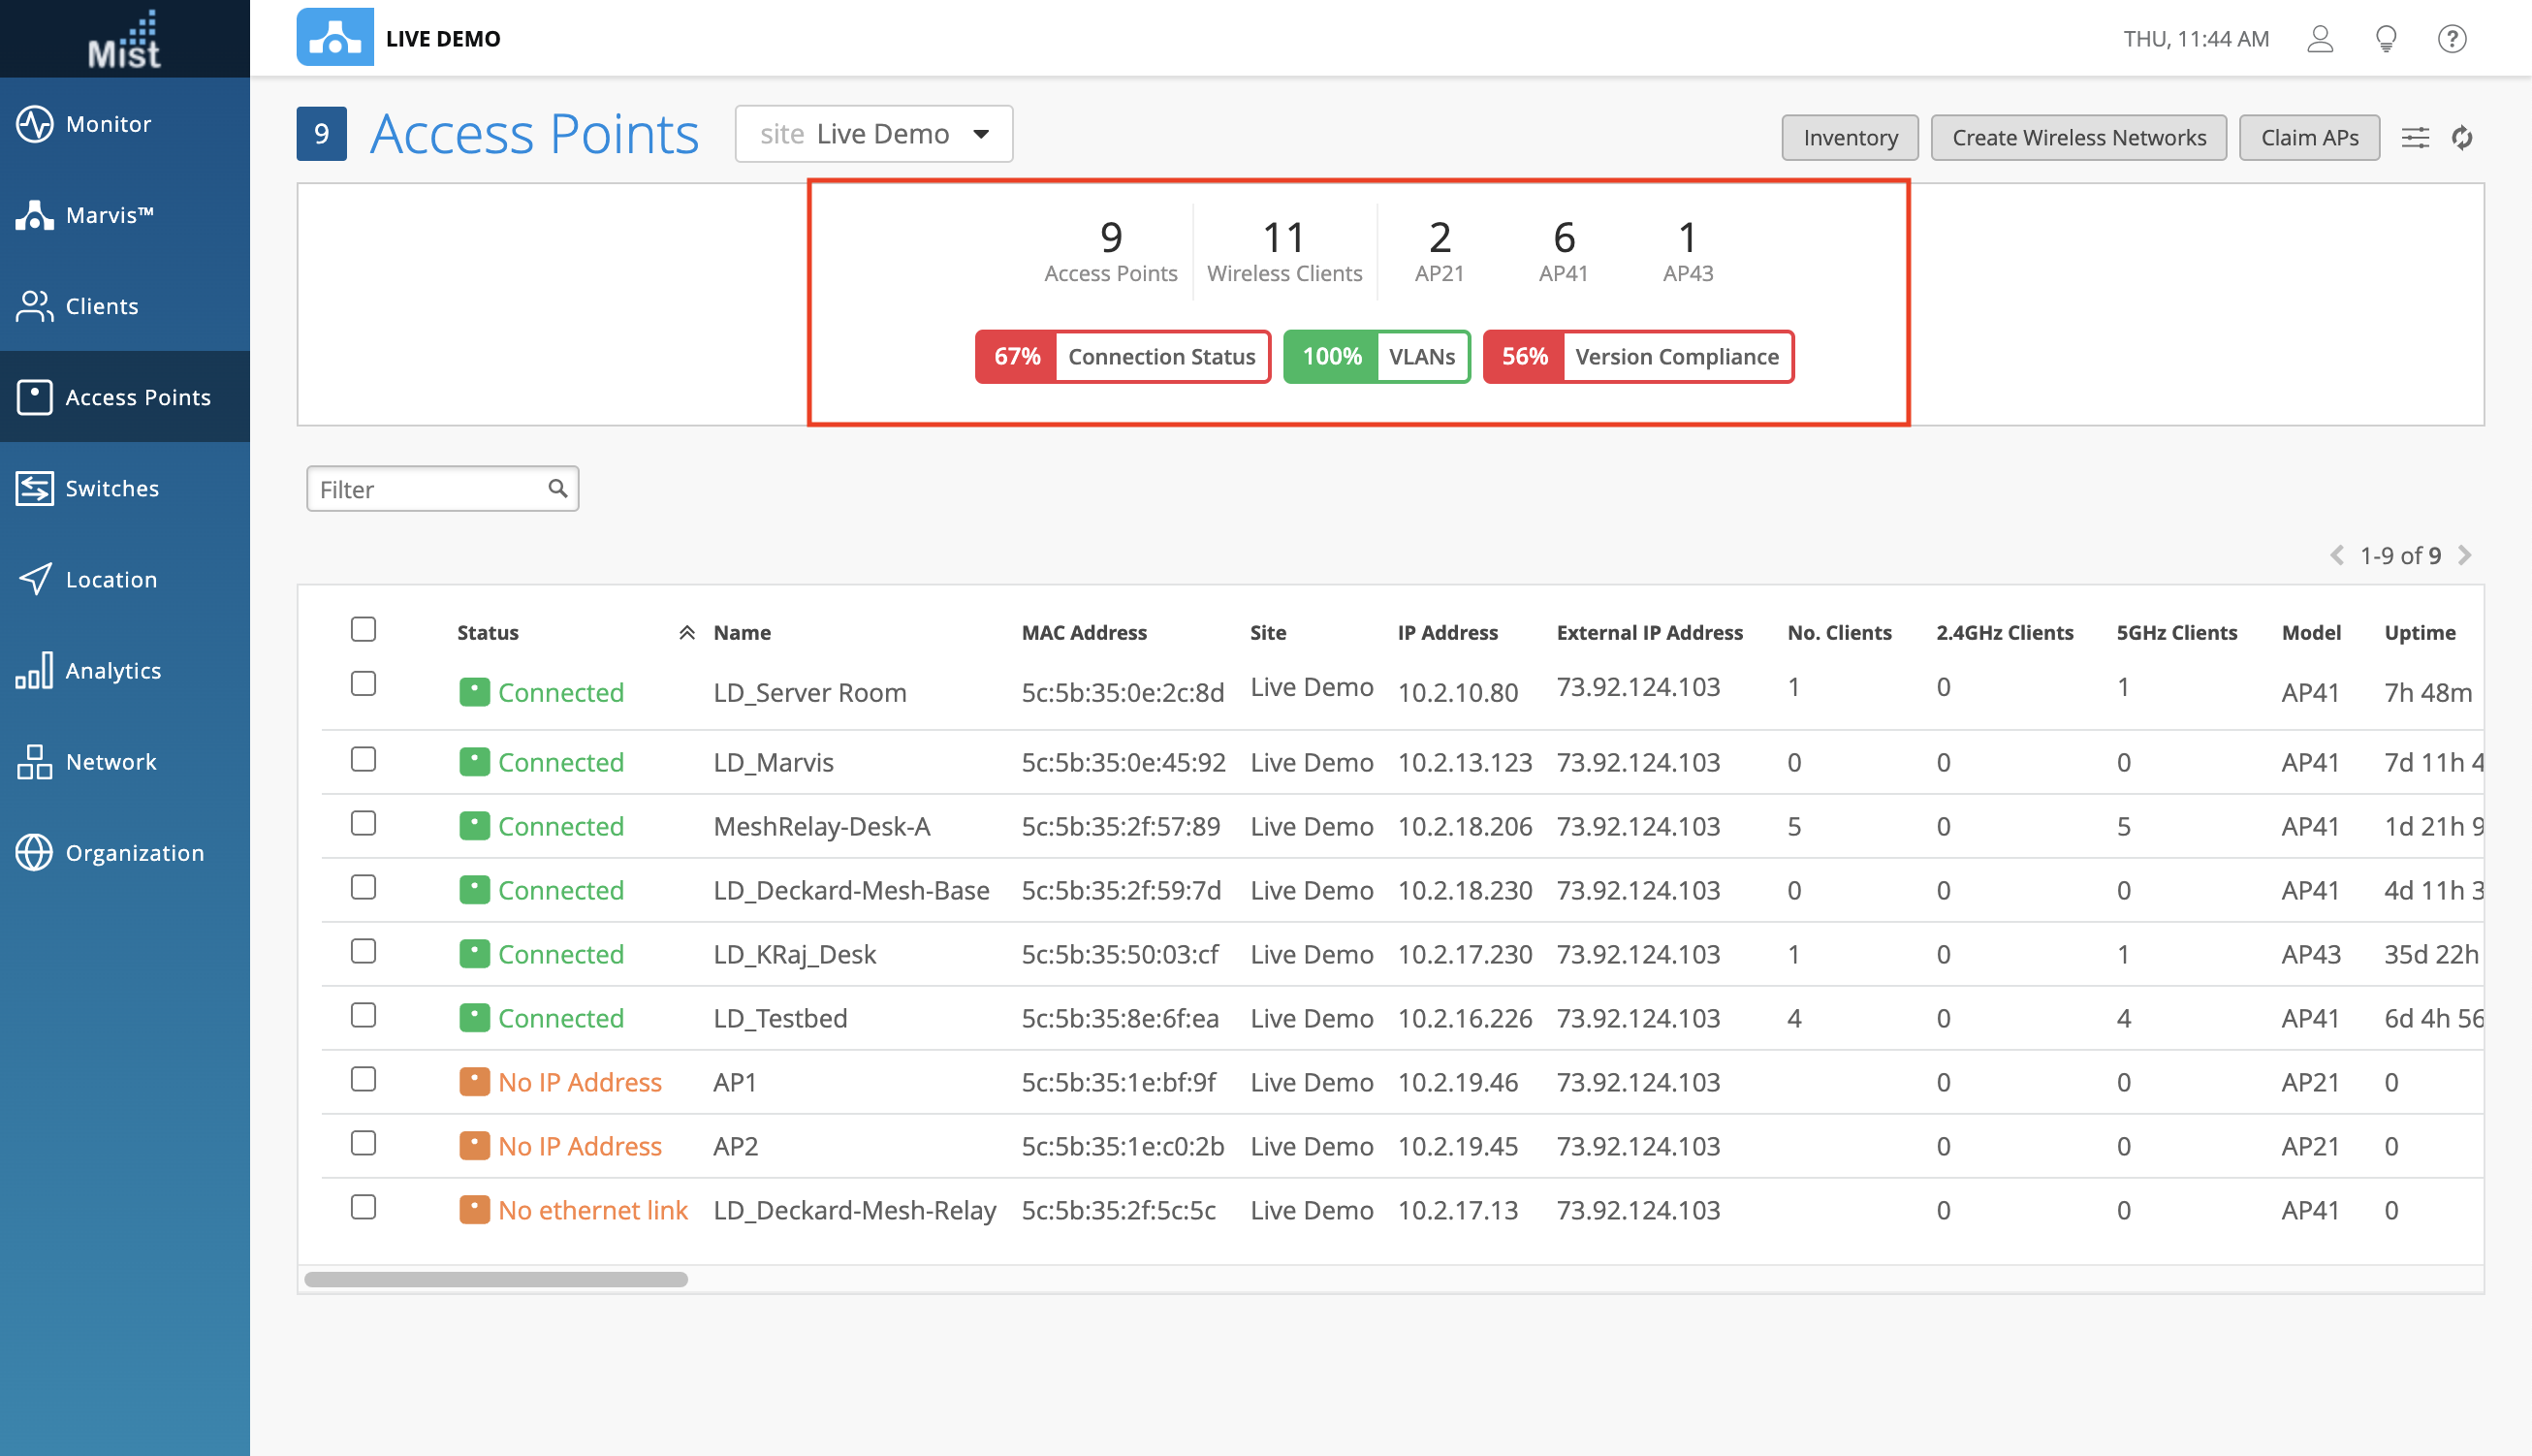
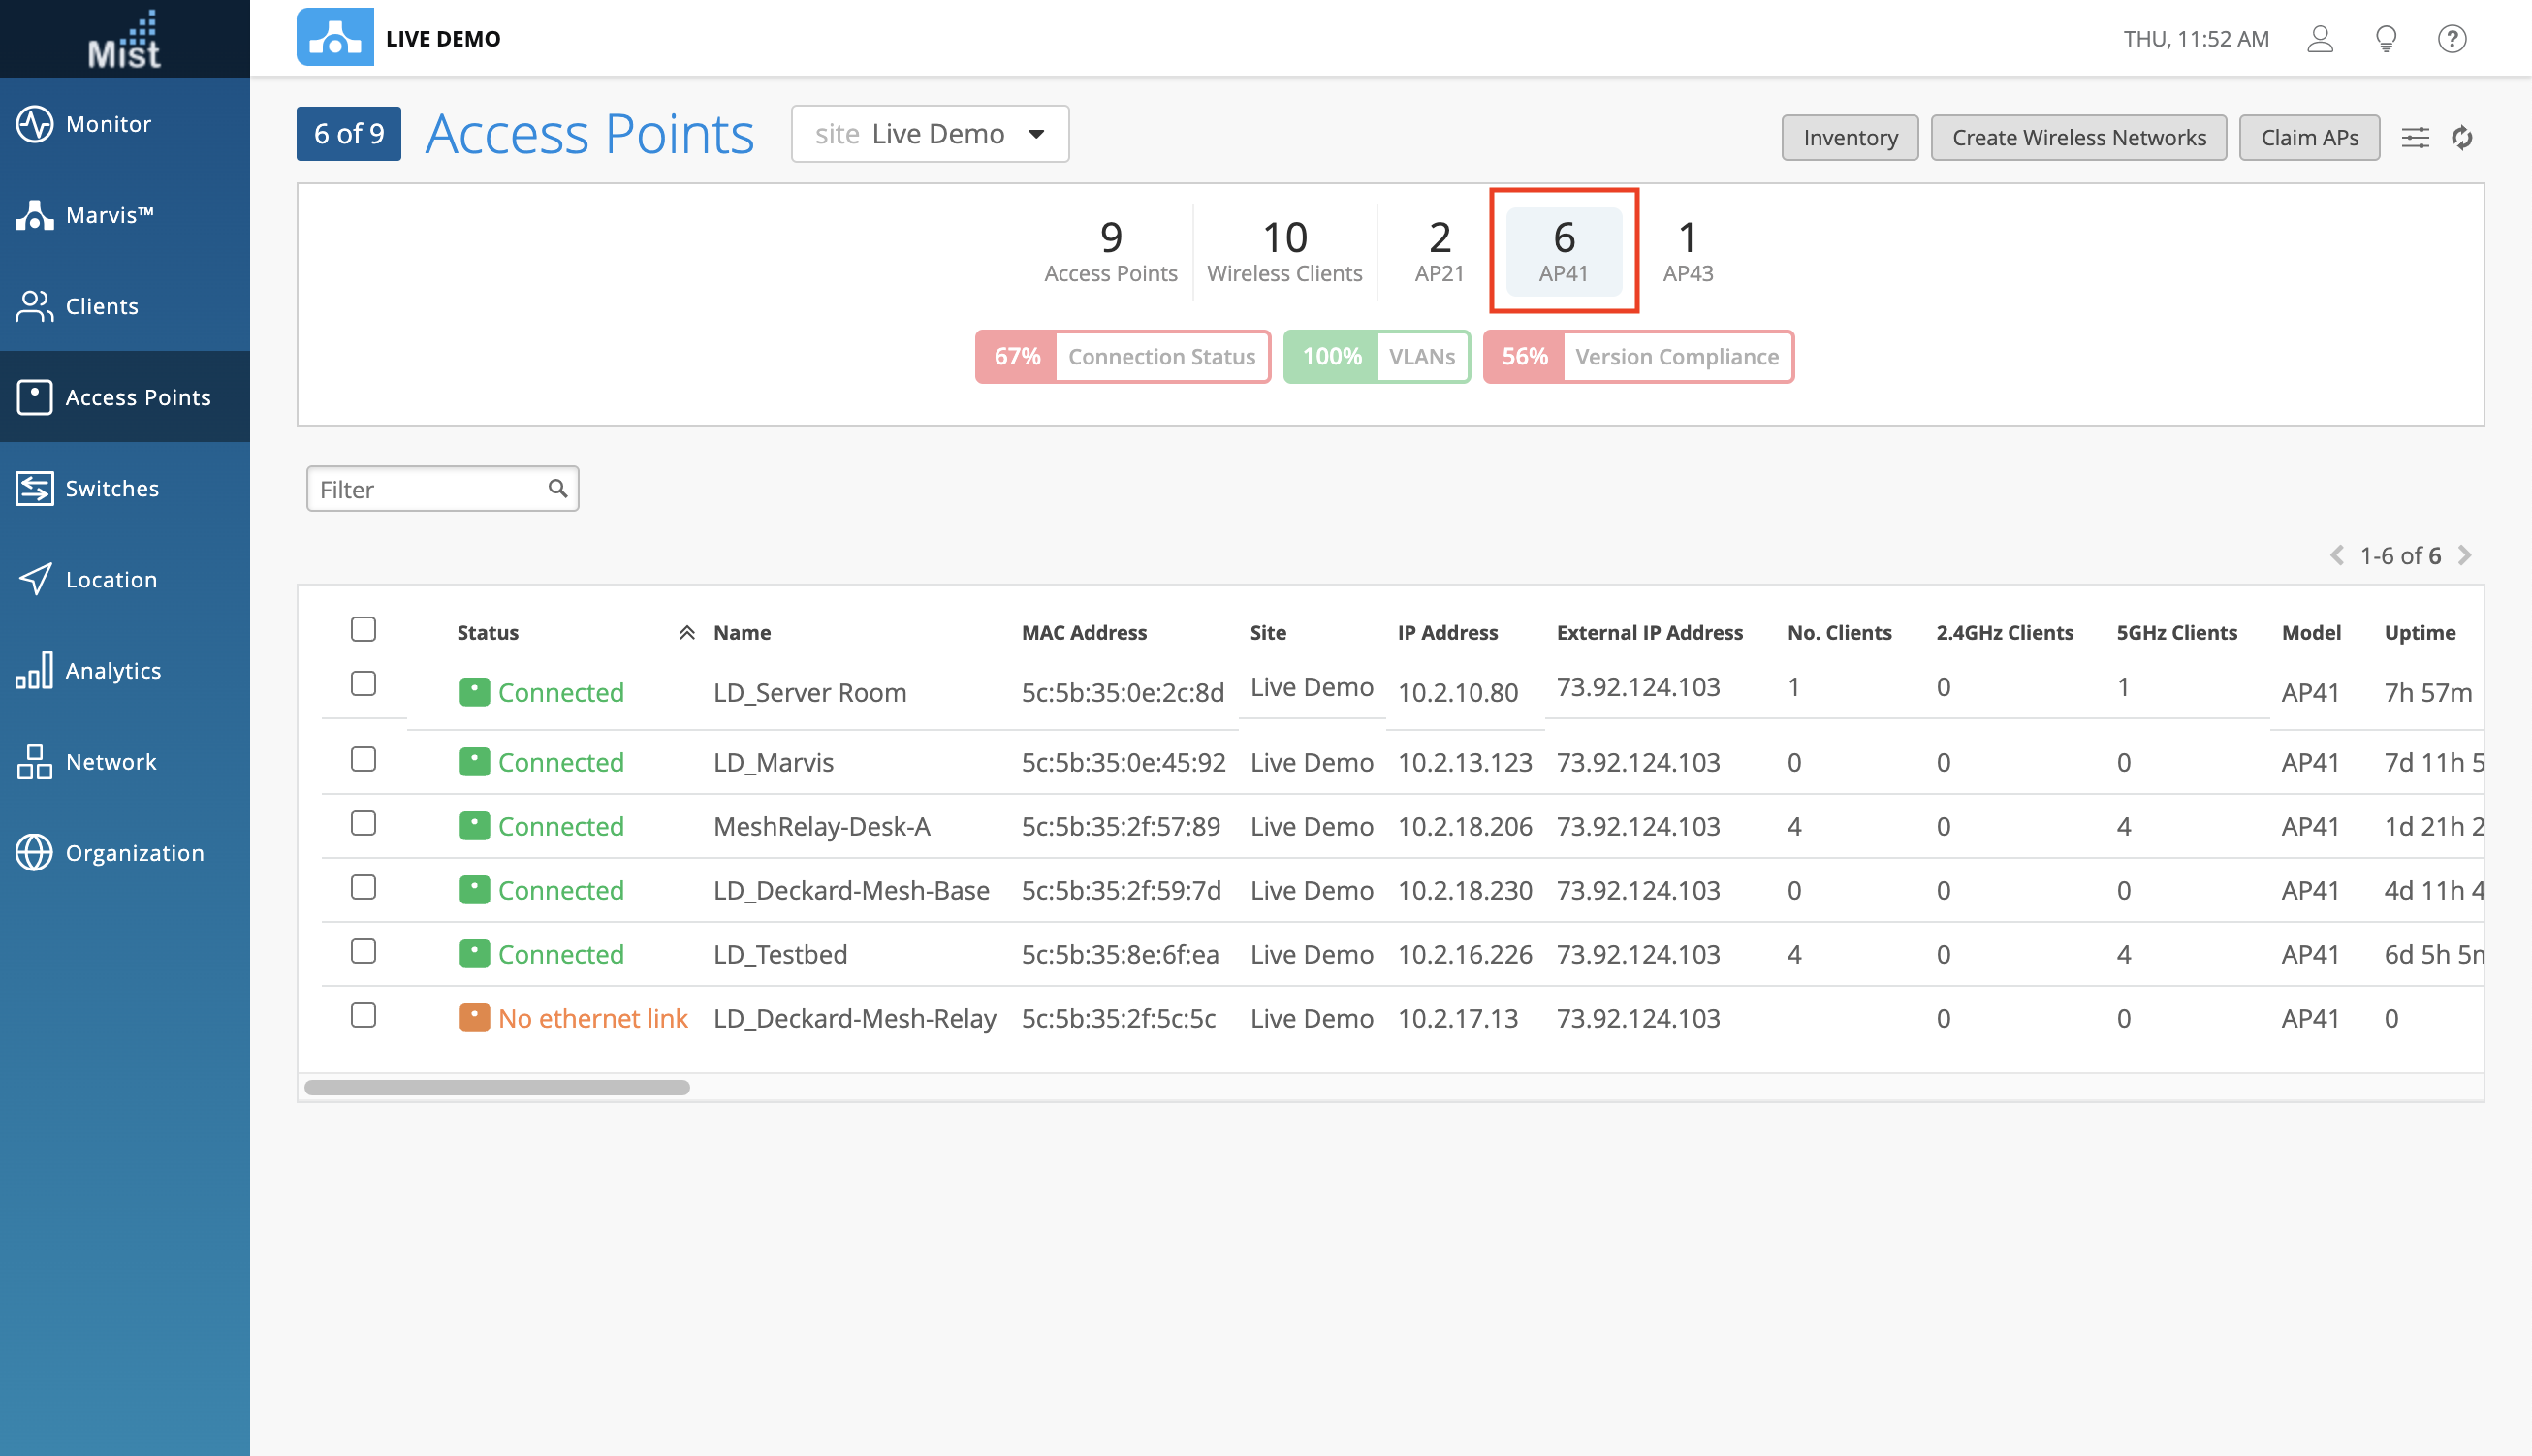
On the left, we can see the total number of APs and connected clients. On the right is the breakdown of different AP models and how many of each you have on your site. You can select between the models to control the list of APs displayed. In this example, we are choosing to only display the 6 AP41s on our site.
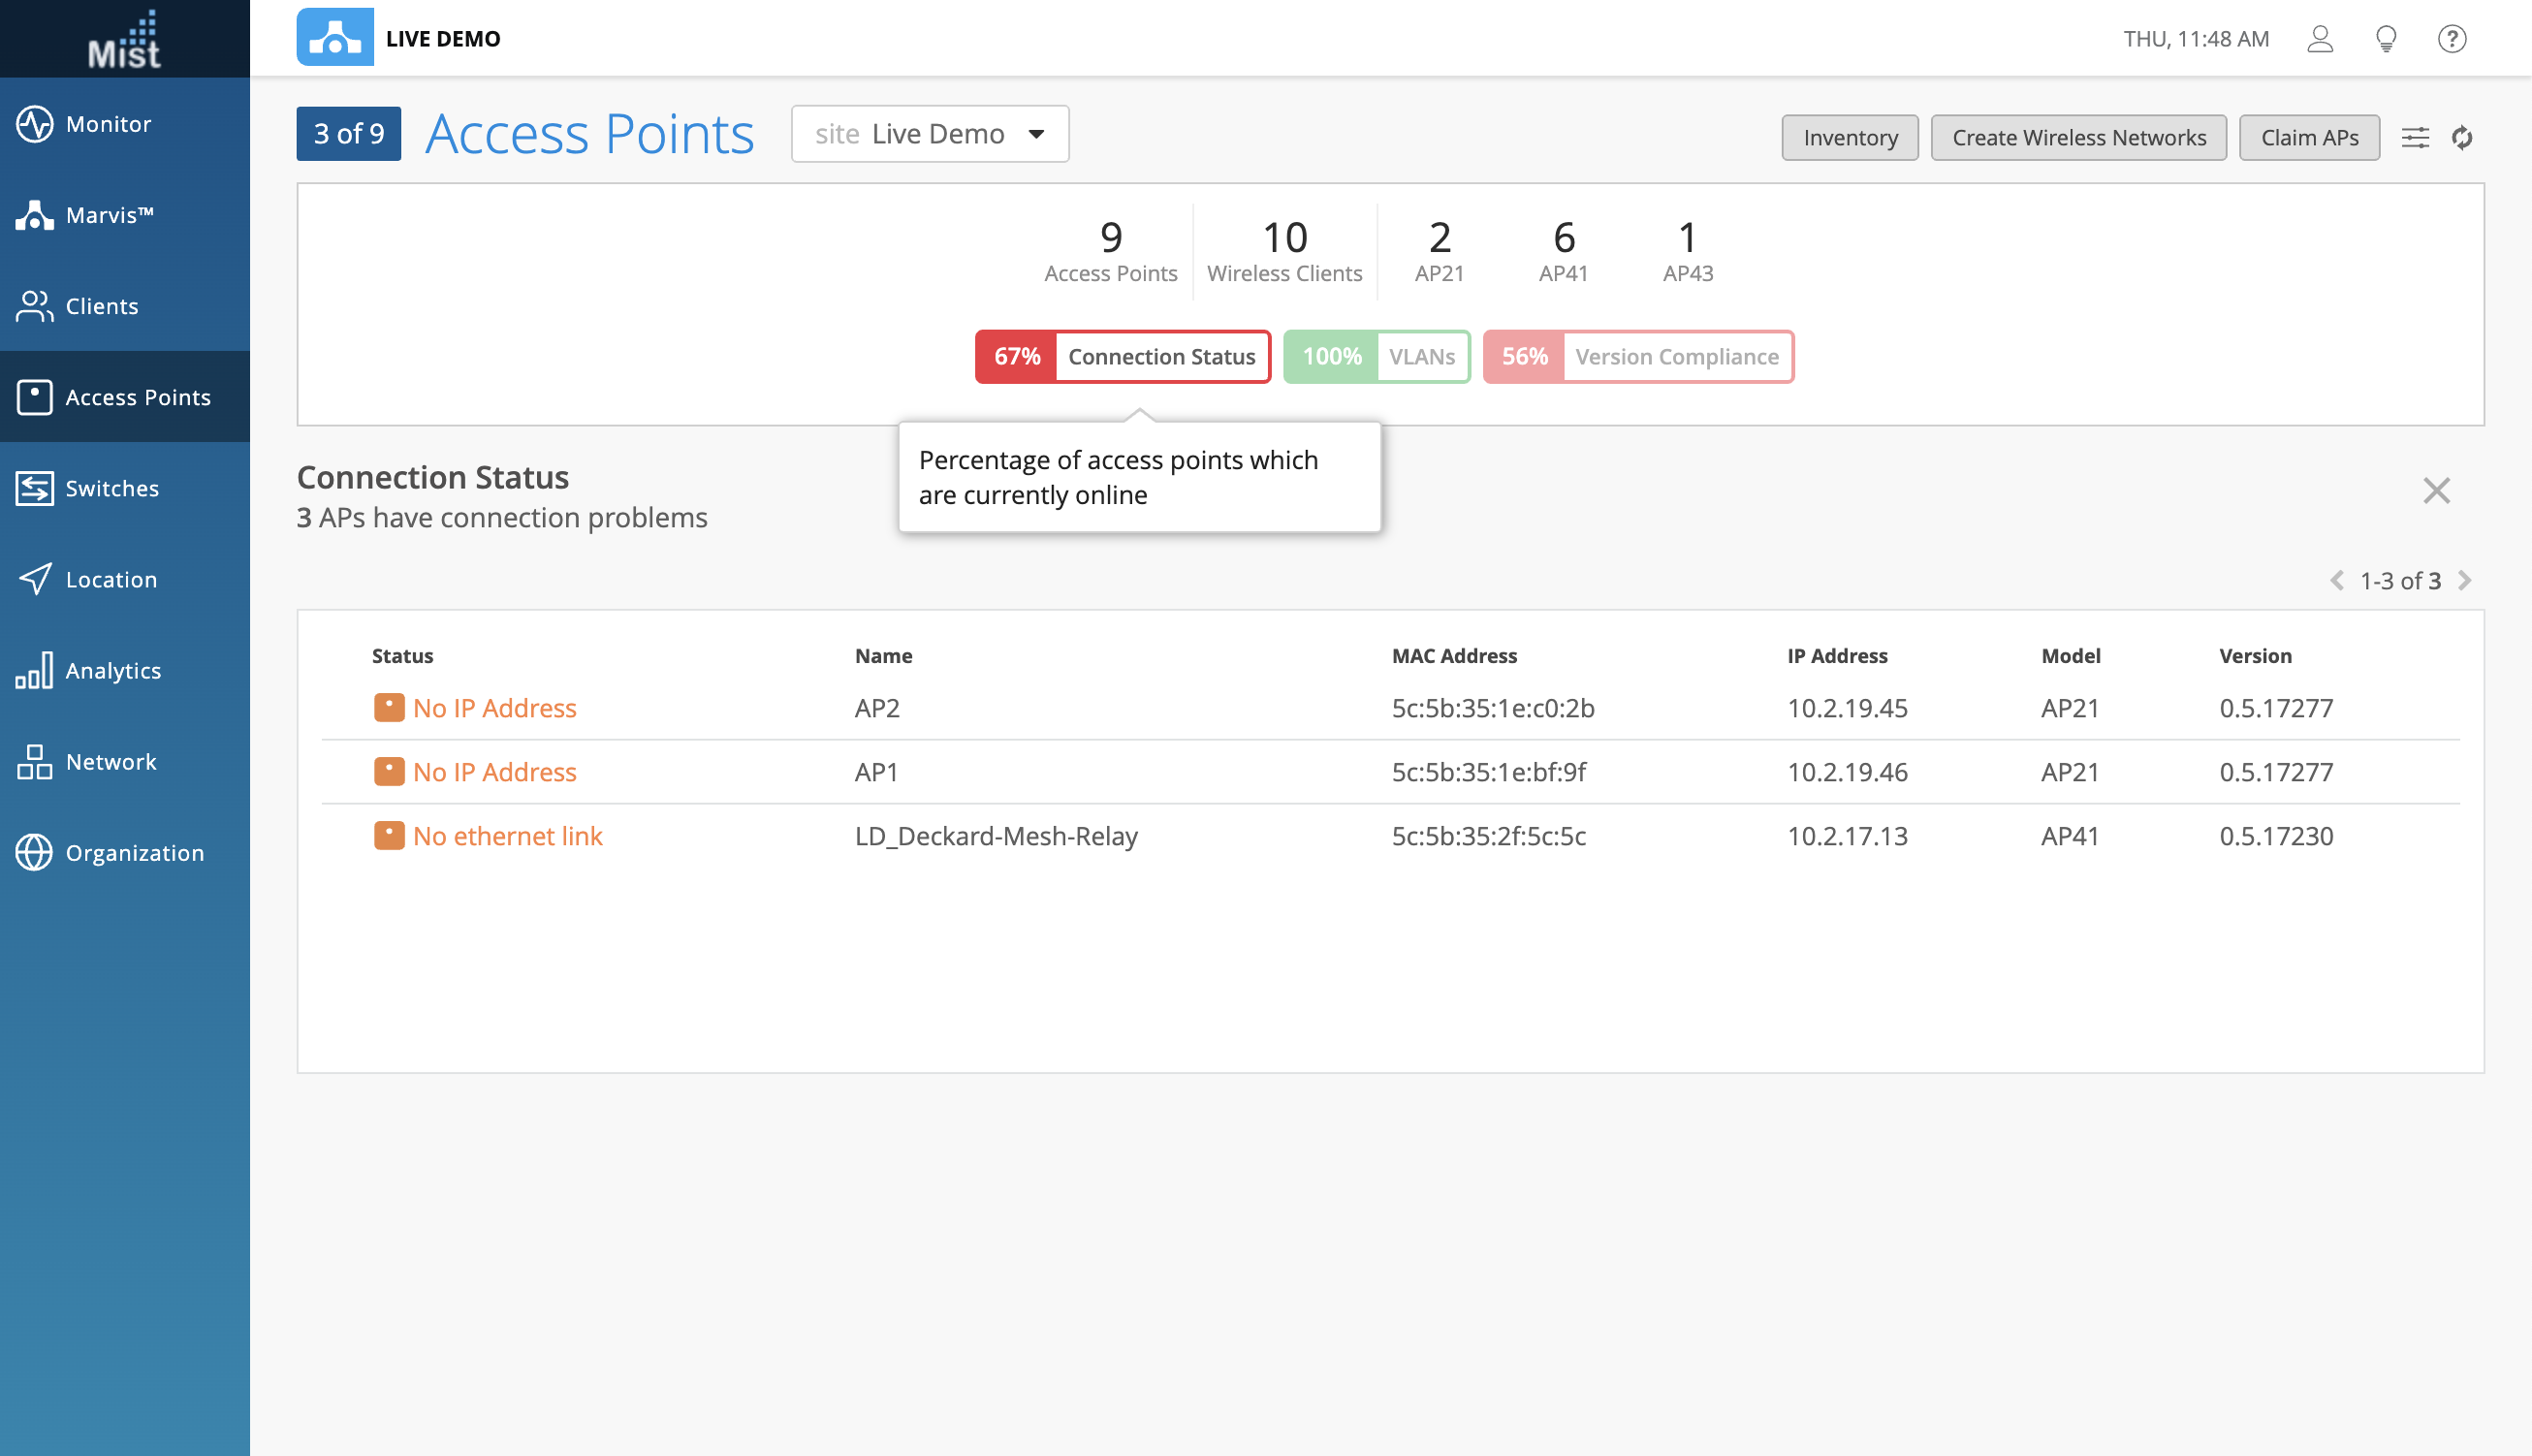
The metrics beneath that can also be selected to filter out specific APs. VLANs shows the percentage of APs in which all Wired VLANs are active. Selecting this will display any APs with inactive VLAN issues. Connection Status shows the percentage of APs that are currently online. Selecting this will show all APs with connection problems, such as missing IP address or missing ethernet link.
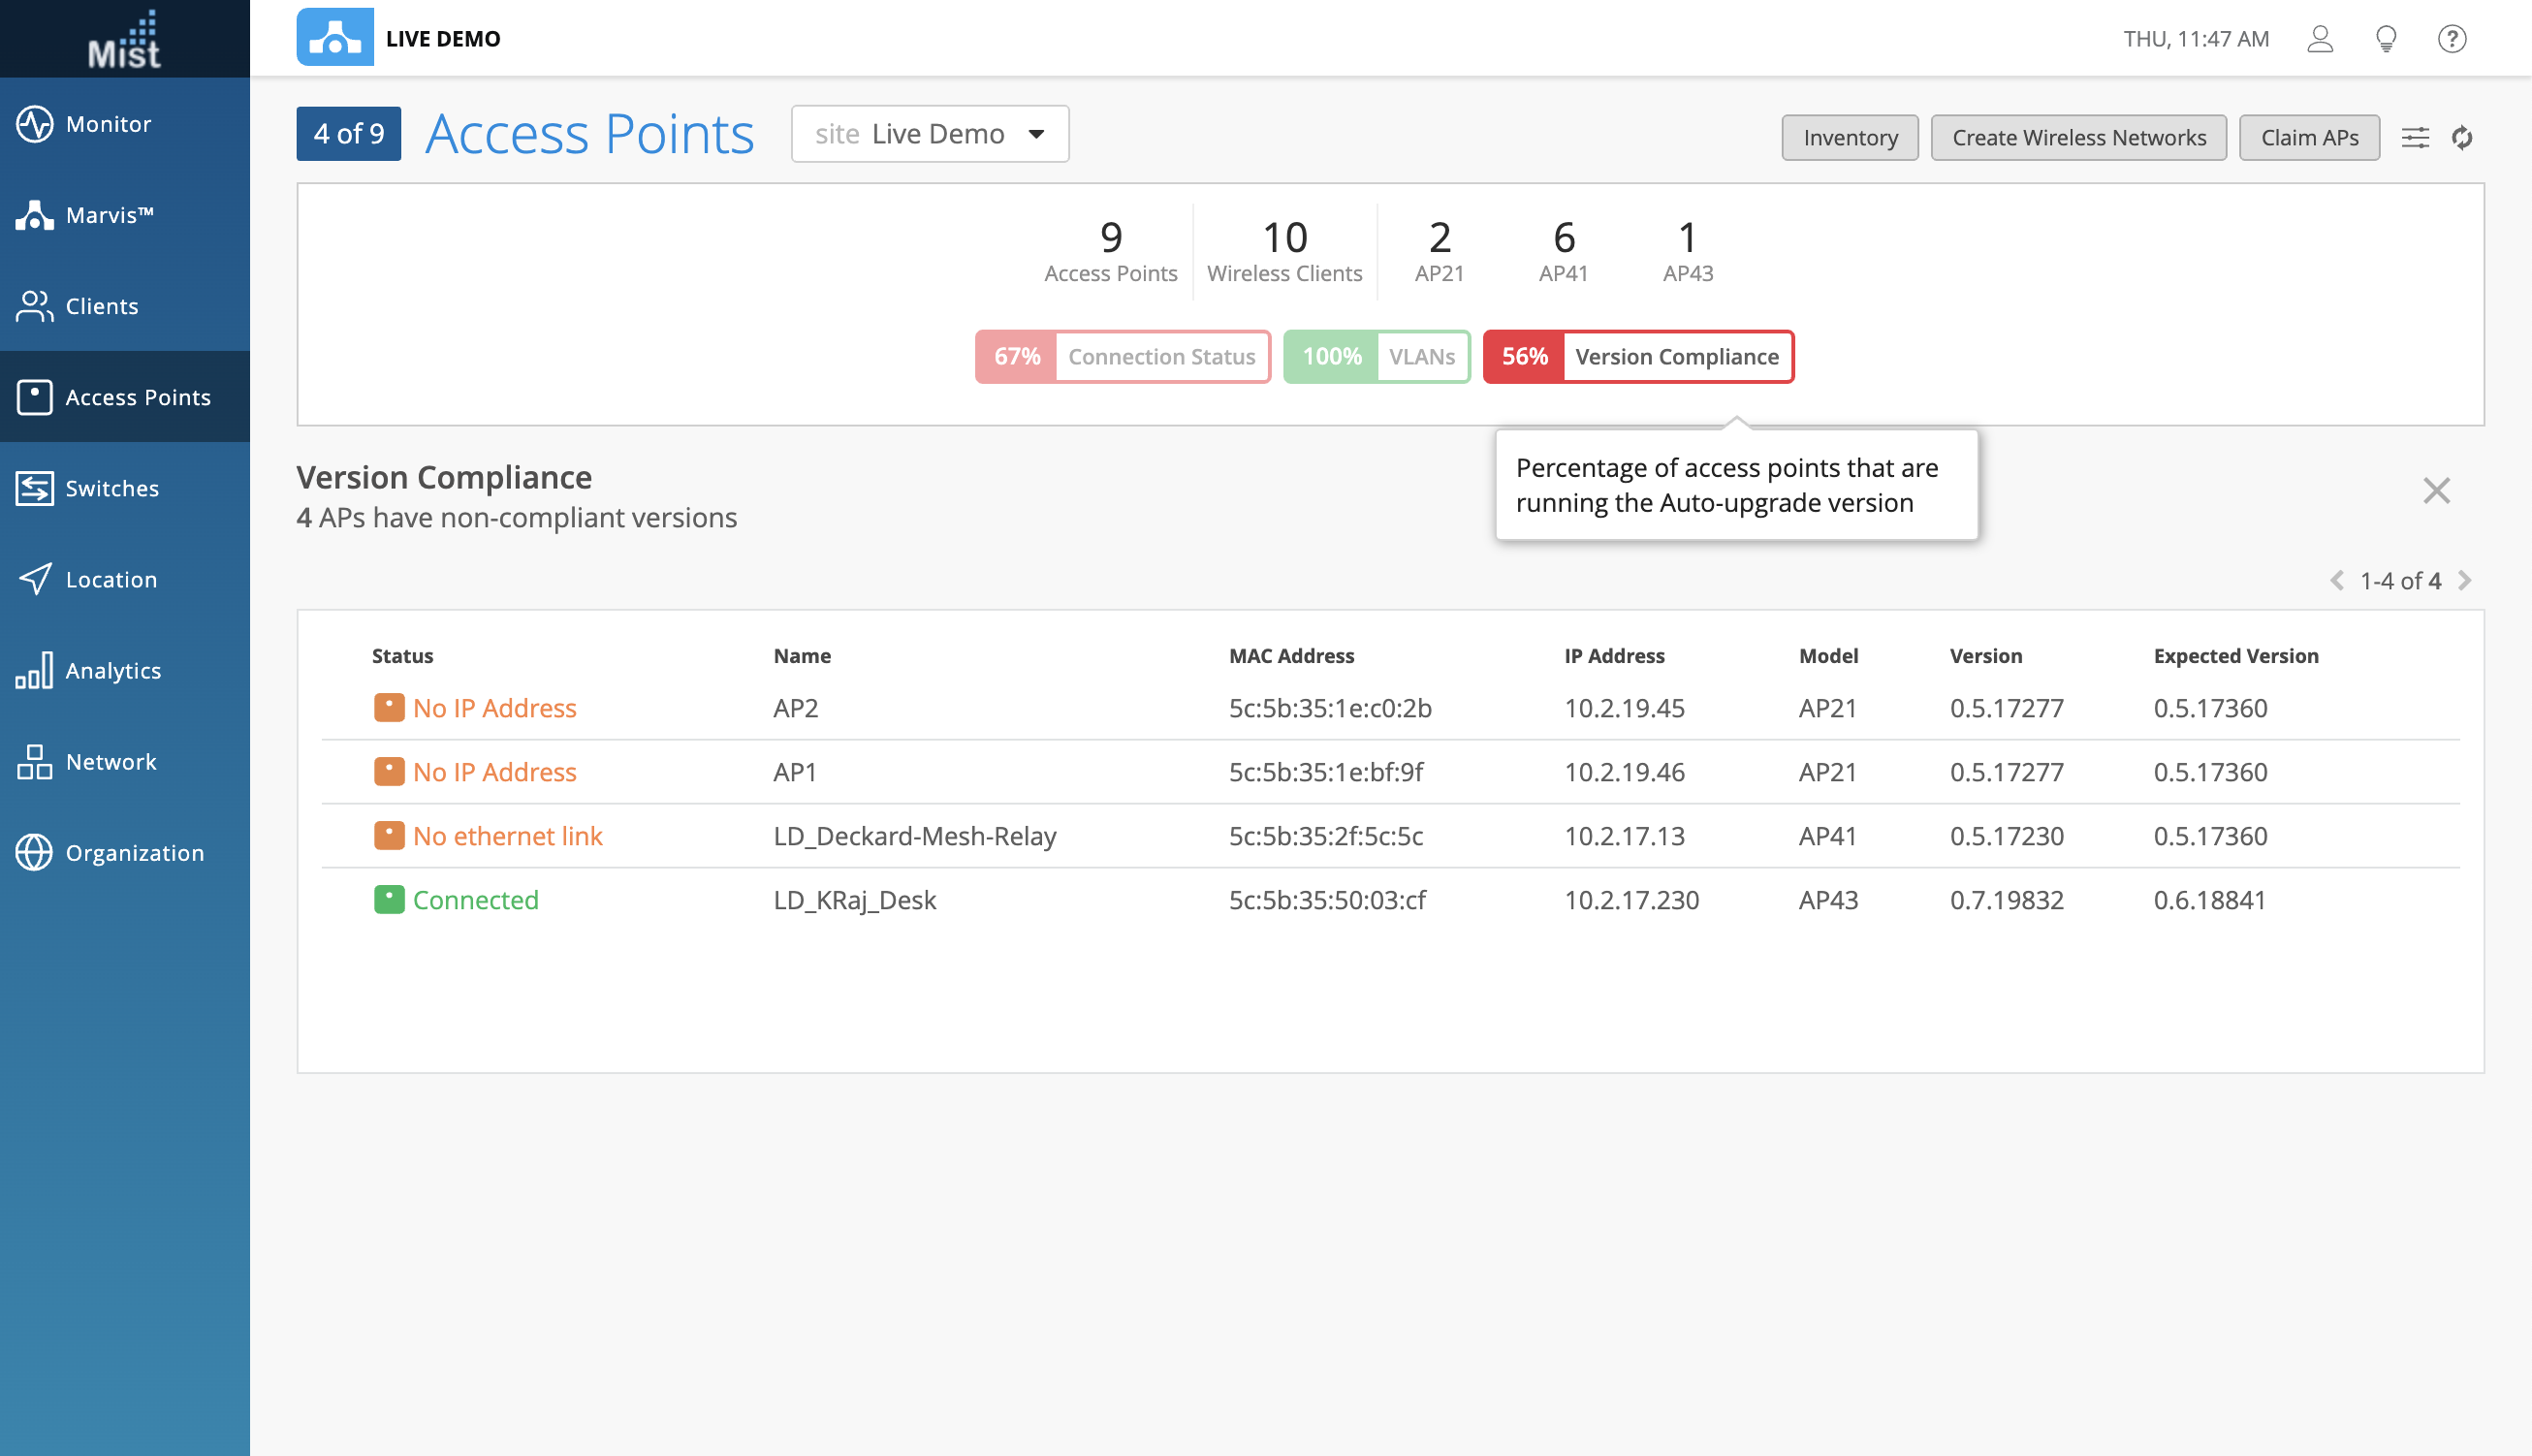
Version Compliance will show the list of APs running a firmware version that does not match the auto-upgrade version set on your site settings. This could be caused by APs being manually upgraded to a later version, or disconnected APs that have gotten auto-upgraded yet.
Client Summary and Metrics
Like the AP Summary and Metrics introduced above, the Client Summary is also a new addition to our UI this week. On the WiFi Clients page, you can see the total number of Wireless Clients as well as use the filters to list clients with specific radio bands and WiFi protocols. Here, we are viewing all 8 clients running on 802.11ac mode. 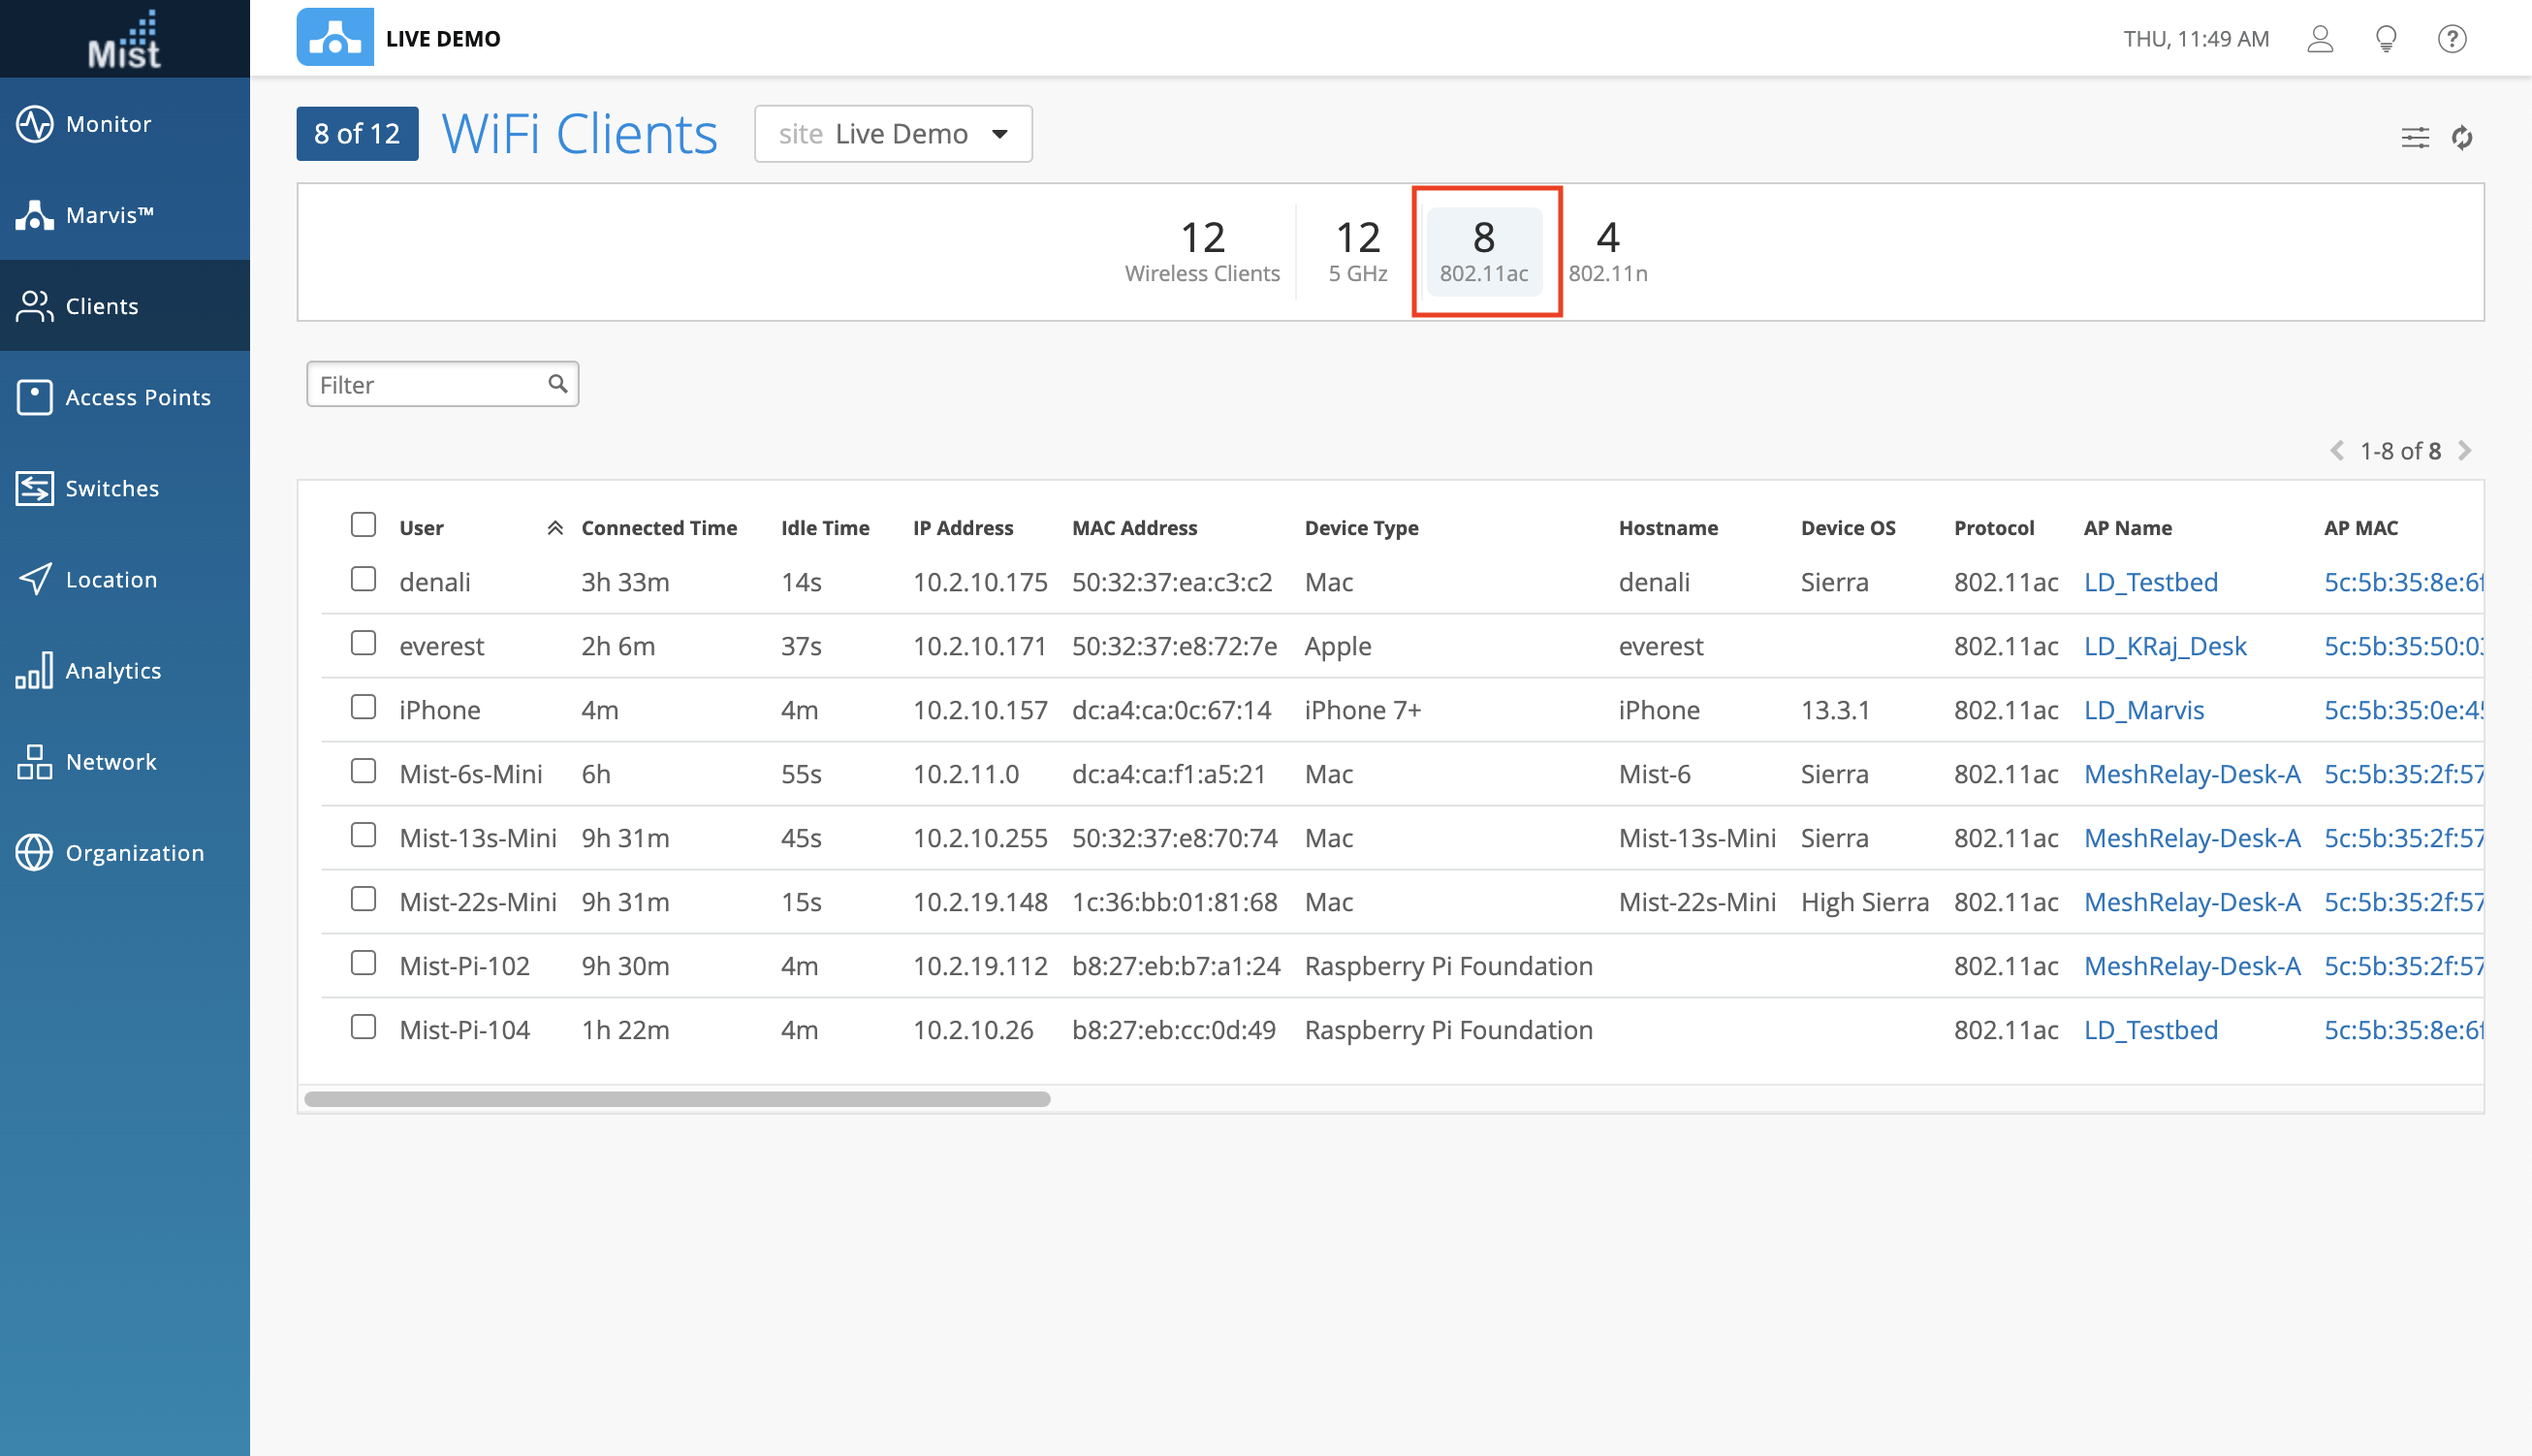
Bug Fixes and Improvements
Marvis Query Rank DHCP Servers
This week we fixed a bug in our Marvis query for “Rank DHCP Servers.” Previously, this search query incorrectly gave links to the documentation as the answer. This is now fixed, and you may get the DHCP servers ranked on your site again.

UI Performance for Large Organizations
This week we made some performance optimizations in our Mist UI, so you may experience some faster loading on your organization. There is around a 30% reduction of load times, especially in larger organizations.