But what I wanted to point out here is in the middle, you can see here, these are the APs. You can see here that just recently, this client went from AP LD_GPS_AP at 2:53 AM. And then it roamed to LD_kitchen_AP at 4:35. So I just wanted to point that out. So we capture all of these roaming events in the client event window.
But what we’ve done is that we’ve taken this data and we visualized it for you. So now, if I click on Marvis and I go to the– I’m going to click on query language because I just want to walk through what this looks like and what it means. So I’m going to say, enter query. We have a new query now called roaming of. I’m going to click on that. I’ll hit my spacebar. And under here, here are all my client devices in live demo that you can actually– that I could pick.
If I wanted to, I can click over here. Go to a different site and look at different clients. But I’ll stick with live demo for now. And I’m just going to pick that same client that was just showing you under client insights, Vincent. Let’s do– oops. During the last seven days. And I’m going to click enter. And so now, so I was just showing you the client insight for the last seven days. And you can see in there that in that center column, it was moving from one AP to the other. It was roaming.
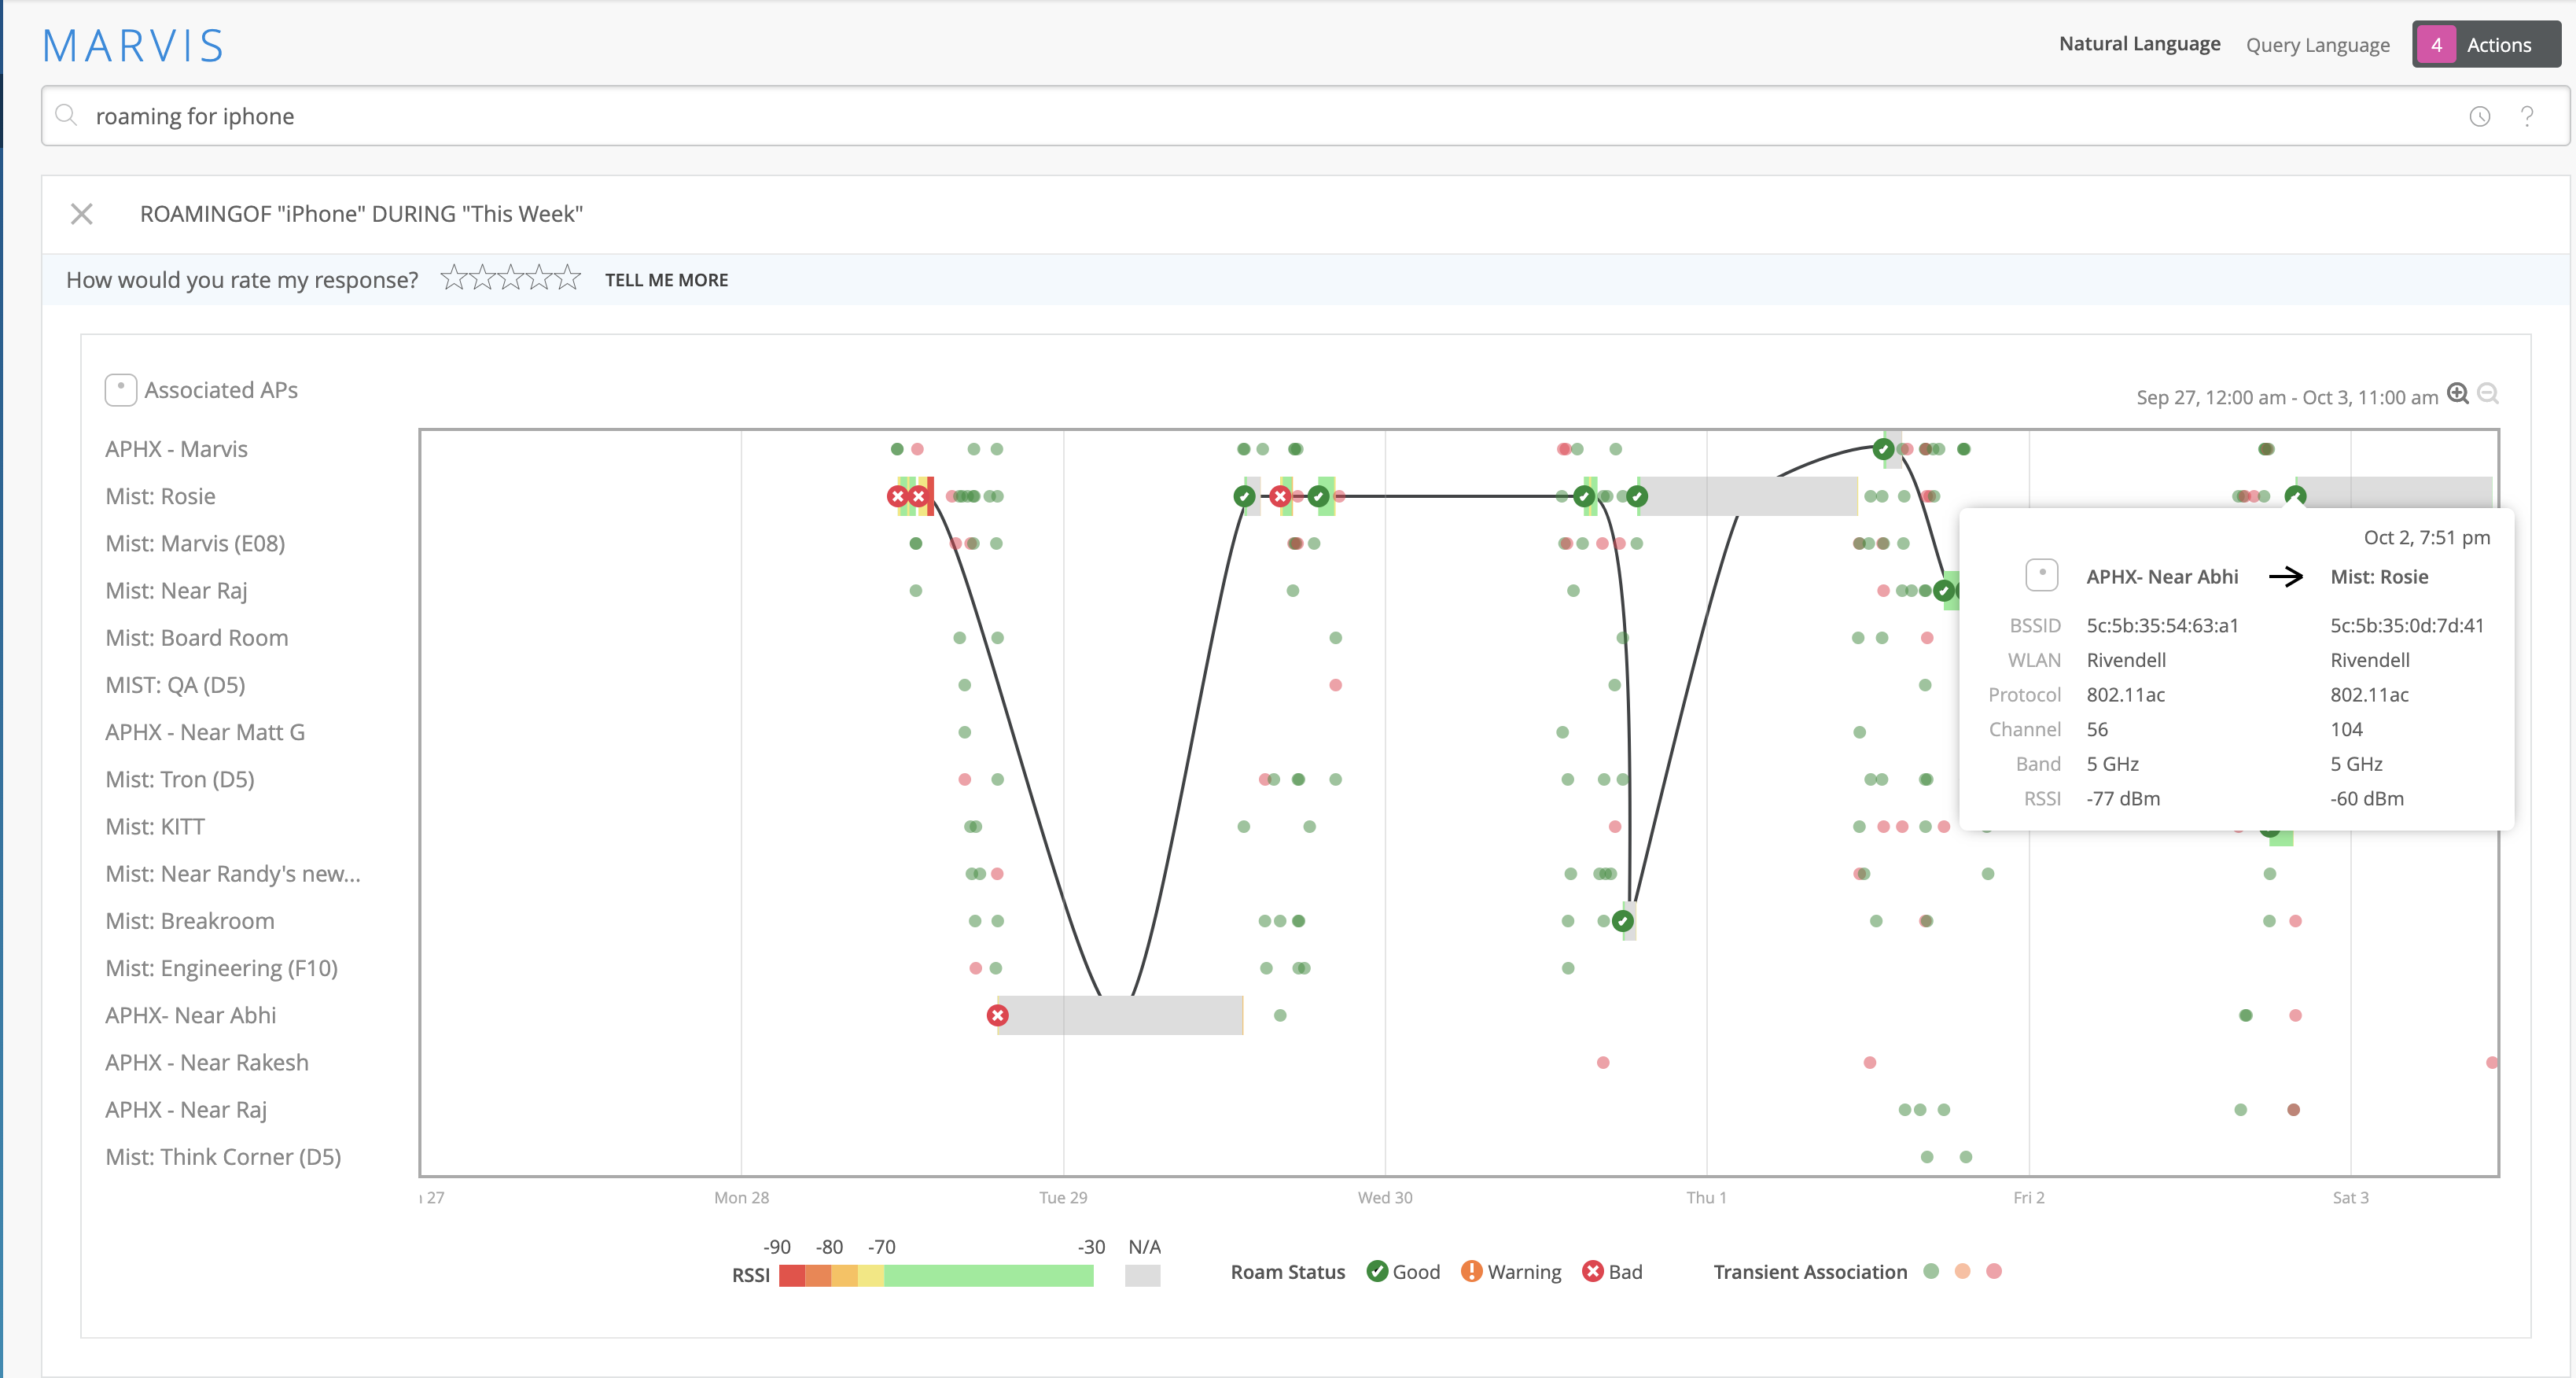
But what does that mean? What does that look like? Now, we actually have a visualization. So you can see here over the last seven days, this particular client has roamed between these four access points. And then we have a legend down here that you can look at to see. What does this mean, a green checkbox? And then over here, you can see that these lines before it roamed are green.
So we give you an indicator here that, hey, if it’s negative 70 or better from a signal strength RSSI perspective, it’s going to be green. If it’s worse than that, you can see here that the color patterns start changing. From yellow to orange to darker orange to red. And that would give you an indicator of what that RSSI value is when a client runs. And then what do these checkmarks mean?
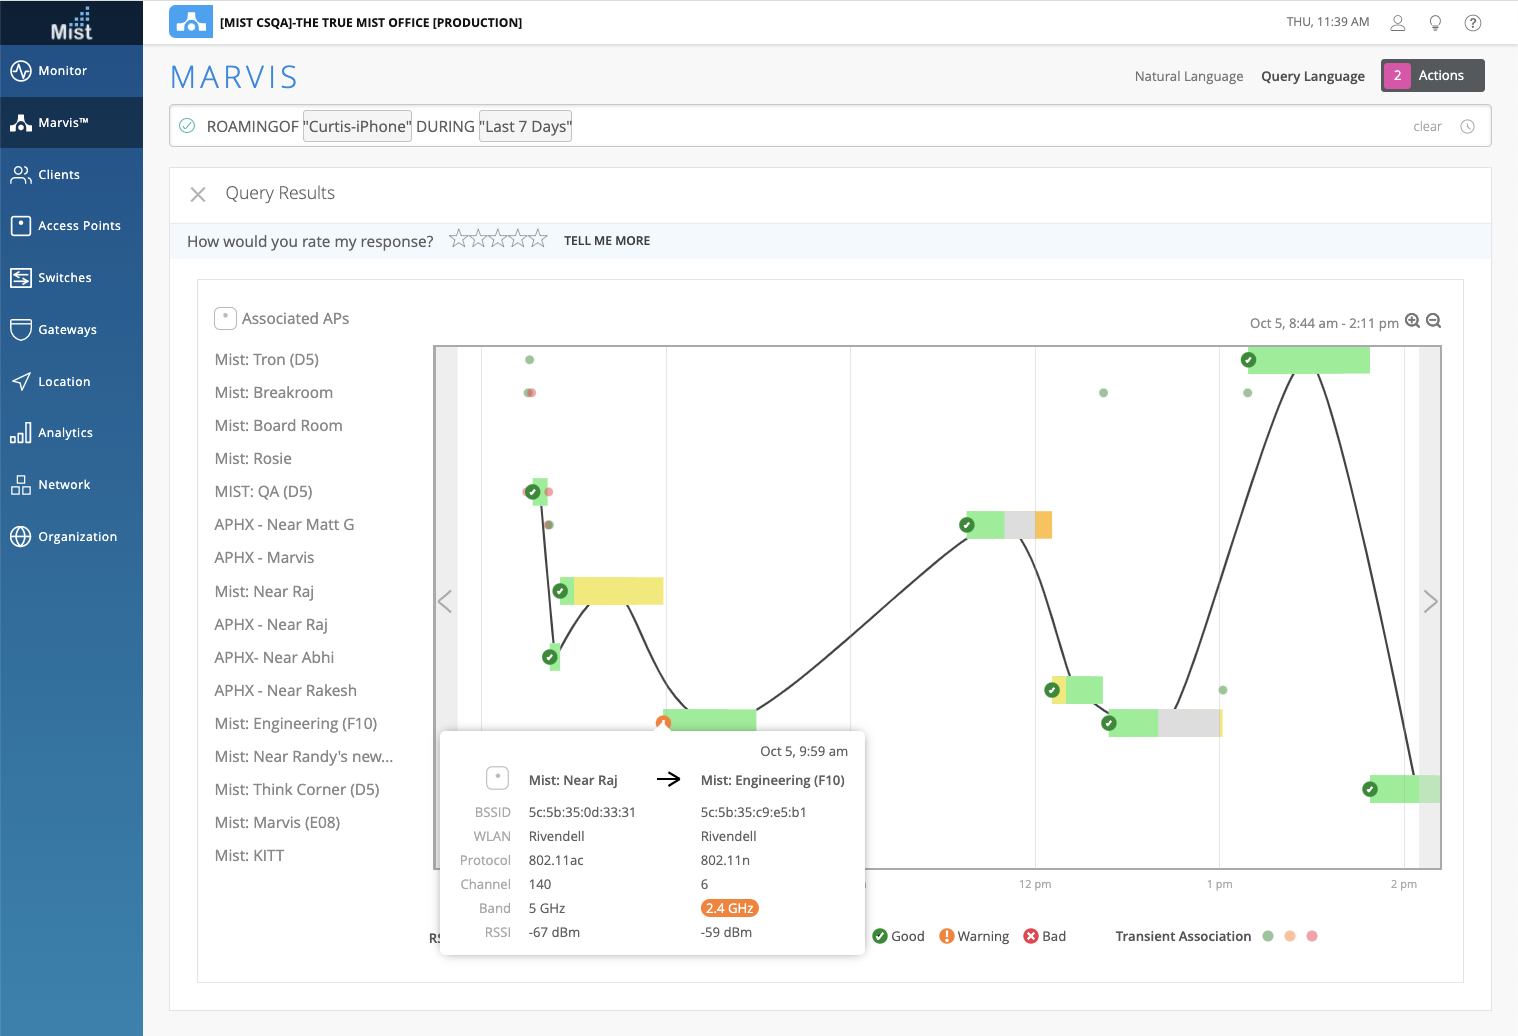
Over here, you can see, hey, a good roam is when a client roams at a negative dB or better. And so you can see that indicates a good roam. A warning roam is that, hey, if a client is roaming from a 5 gigahertz– a 5 gigahertz channel or radio to a 2.4 gigahertz, that could be considered a warning. I would want to know if I have clients that are roaming and doing that in my environment. So we actually show you that as well.
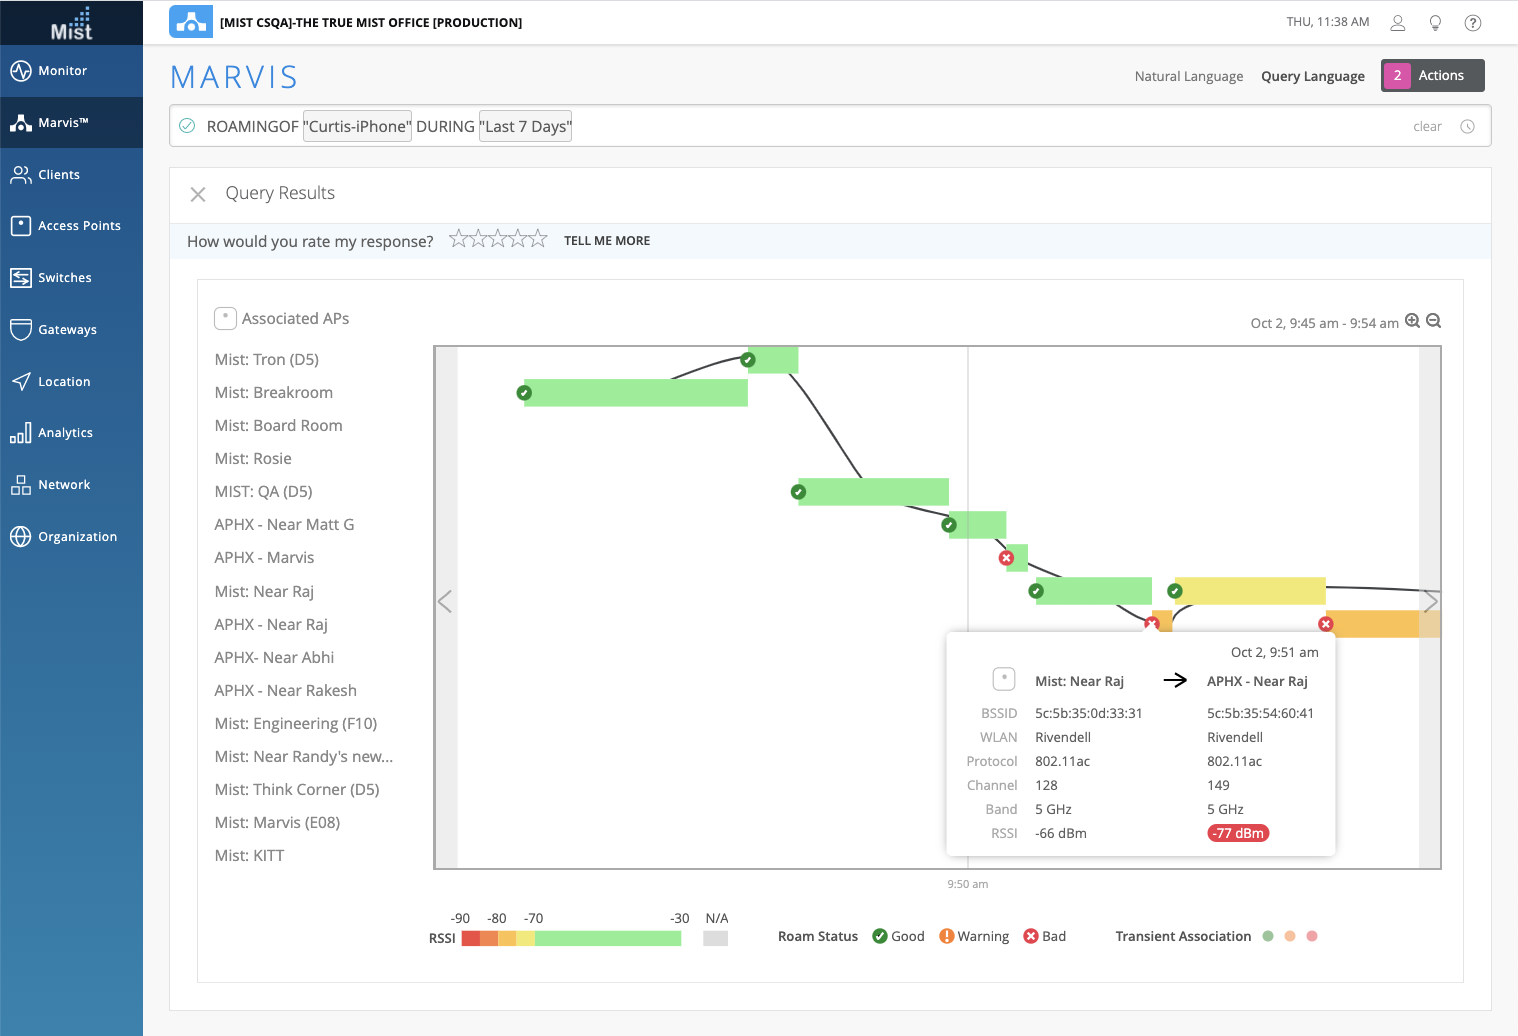
And then something that’s bad. Hey, if a client actually has an RSSI value that’s good and then it roams to an AP within our SSI value that’s worse, that’s considered bad. And we want to know about that. And then obviously, there’s a lot of transient rooms that are going on in there, where a client will bounce from one AP to another real quickly. We capture that as well.
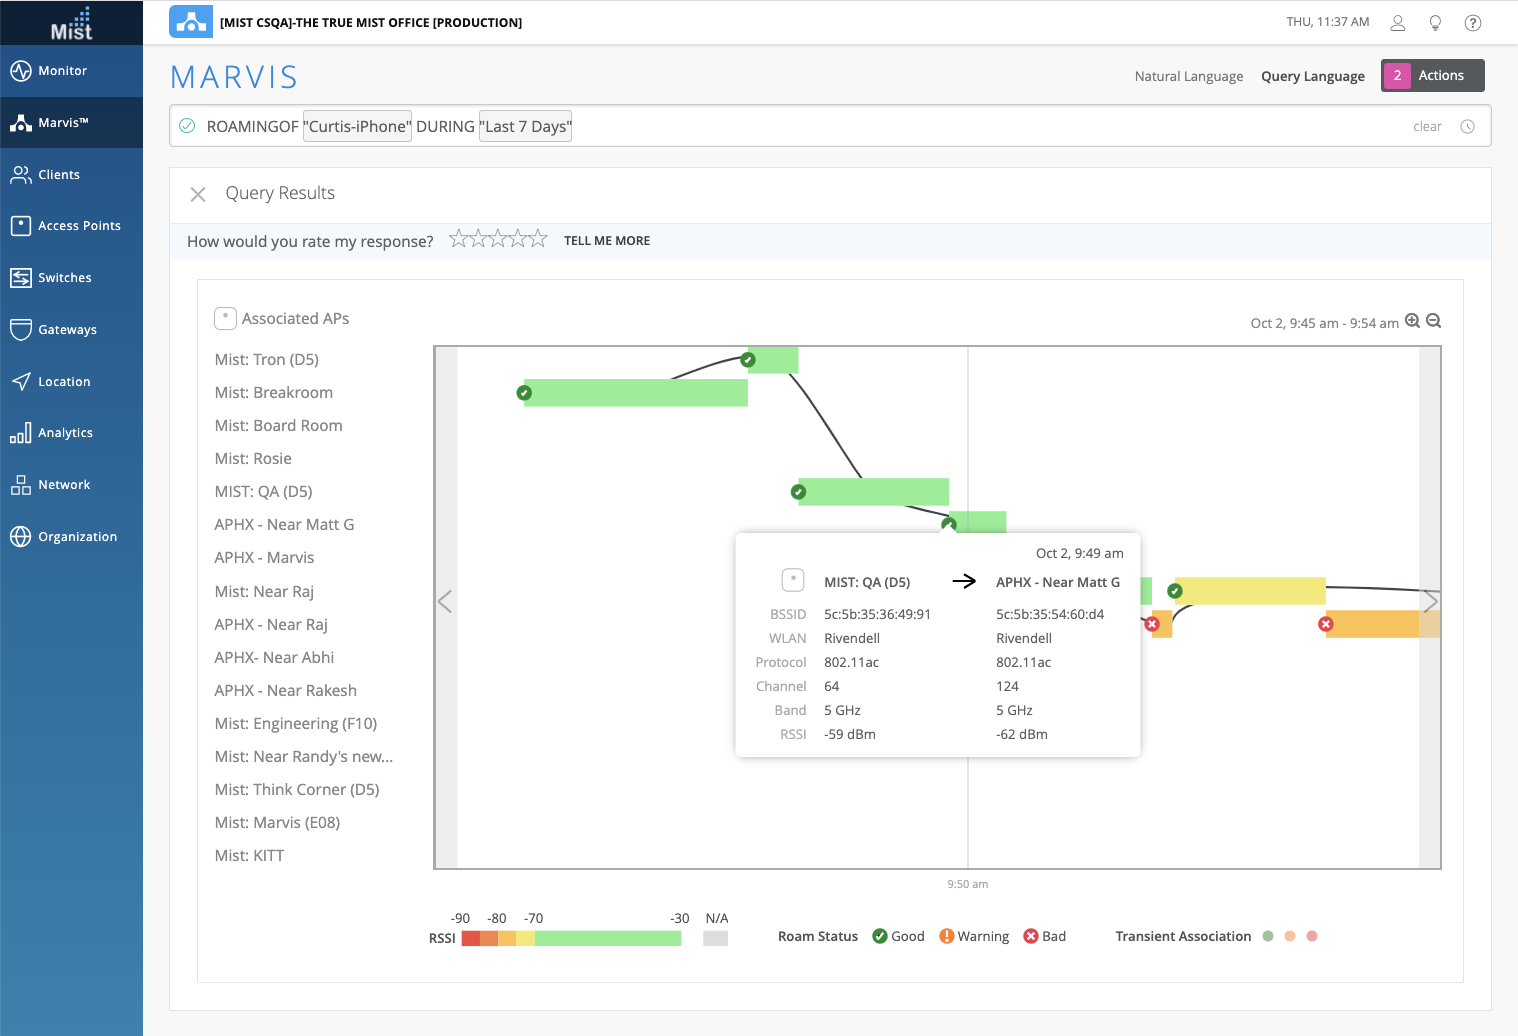
So just real quick, you can visualize this. You can see here that this particular client on this particular date, November 6 at 2:24, gives you all the detailed information. But you can see here, it roamed from LD_kitchen-2 with a negative 67 dB to LD_GPS_AP at negative 66 dB. That was a good room. Over here, it was– you can see here that this was a bad roam. It roamed from an AP that had a signal strength of negative 69 to signal strength to an app that was negative 71.
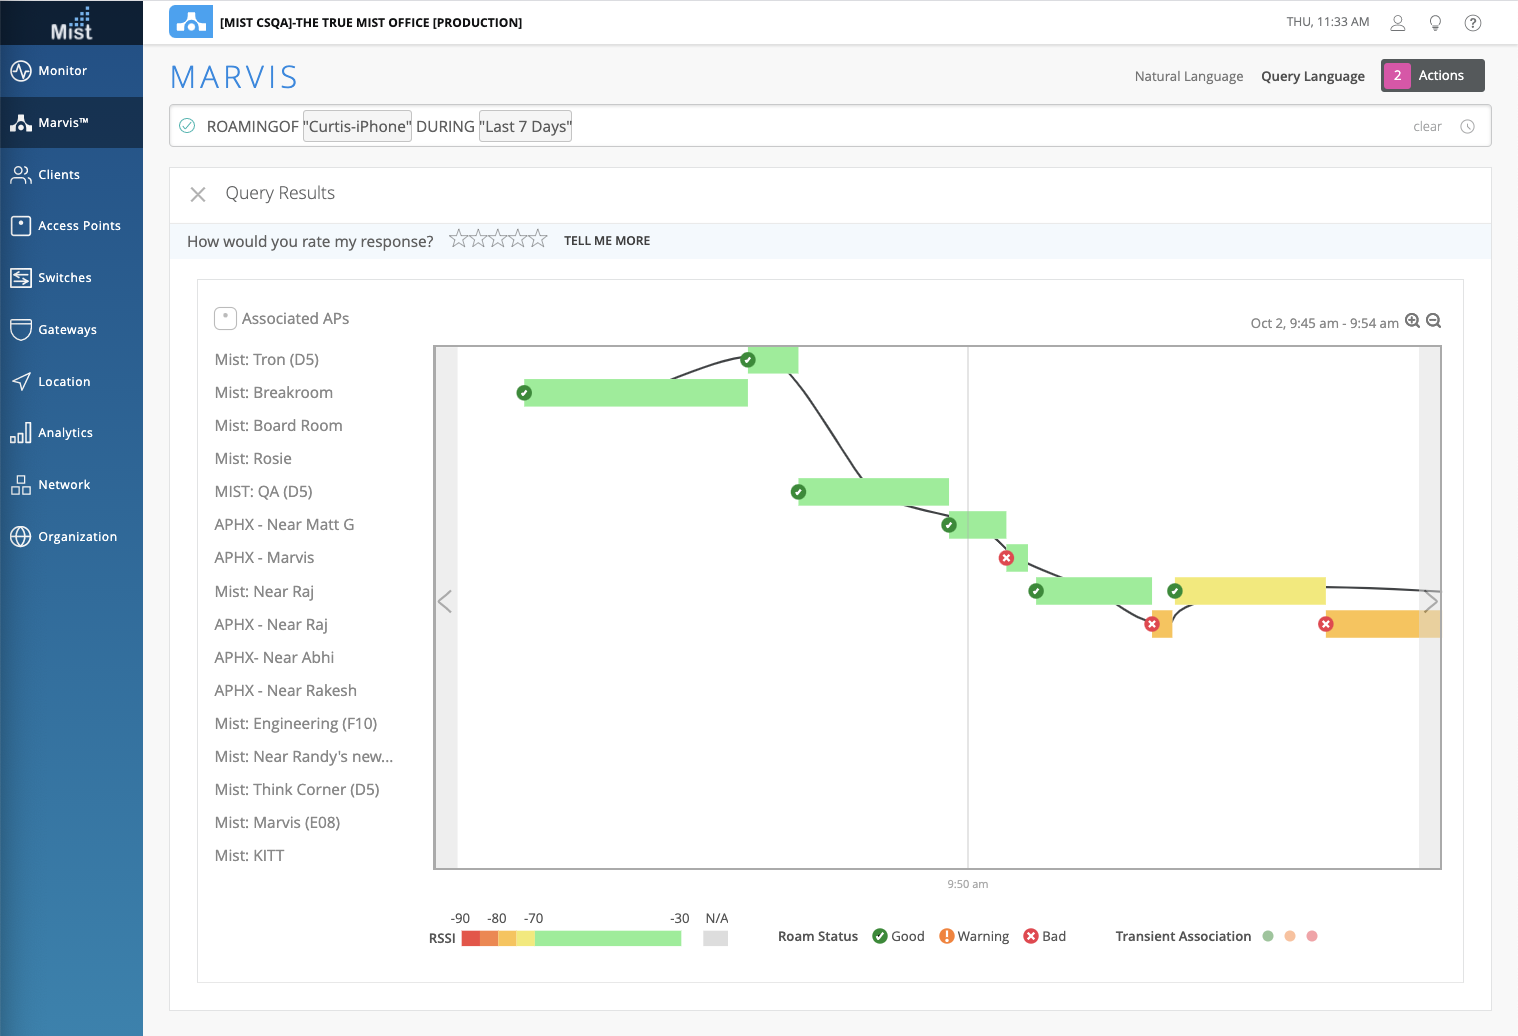
So you can get a lot of detail in terms of what’s going on from a roaming perspective in here. The other thing that you can do is that you could actually play. You can say, look, there’s a lot of these little transient rooms in here. What was this? So I can actually drag my mouse over here and zoom in on what the heck was going on when it was bouncing around between these APs. And then over here, you can actually zoom in or out. So I can click on this little minus zoom out and so on.
So the net of this is that there’s lots of information in here to visualize the roaming of what the client’s been doing over several days or for a specific time period that you wanted to check out. So please, go and play with this. It’s really cool. And again, as Ajit mentioned, this was one of the very, very difficult things to troubleshoot from a Wi-Fi perspective is client roaming. And now, we’ve taken it to another level in terms of giving you the visualization component to that as well.