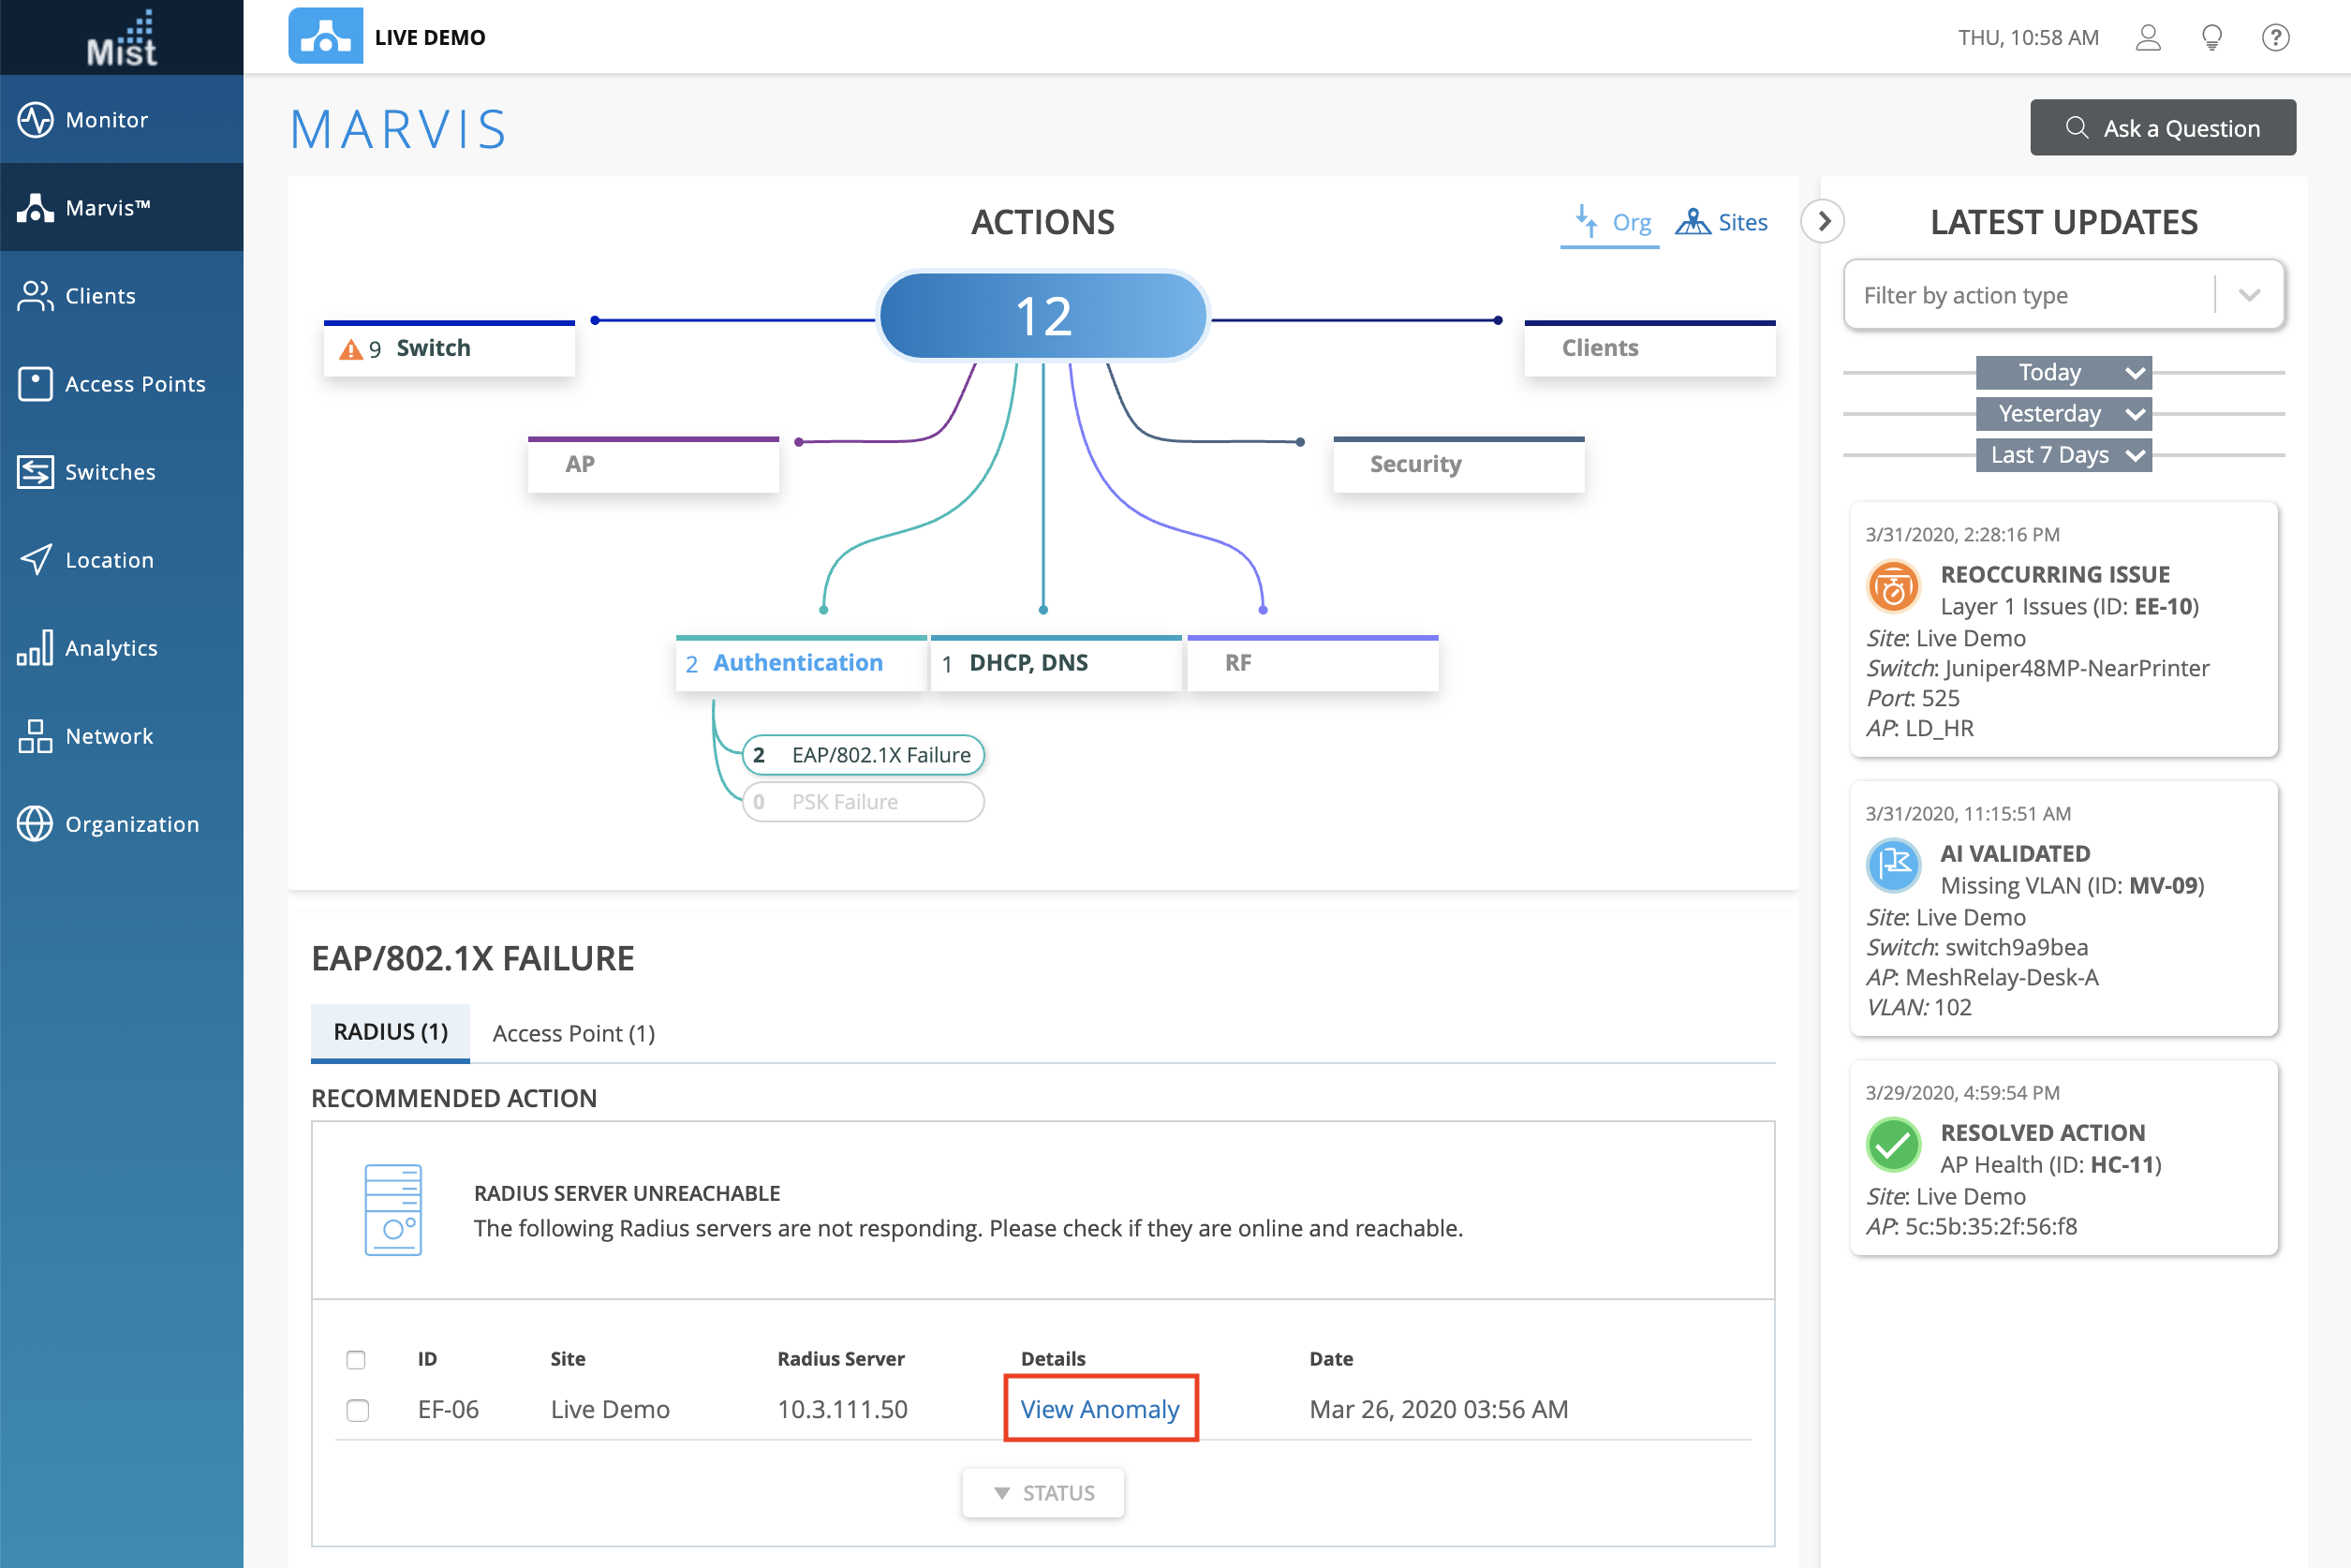
The Anomaly Detection Event Card, as a part of Marvis Actions will show you a more detailed diagnosis on the anomalies of some of your Suggested Actions. The Event Card is available on Authentication (Both EAP/802.1X and PSK) and DHCP Failure events. To open an Event Card, go to one of these suggestions and select View Anomaly.
This will open the Event card, which has four parts:
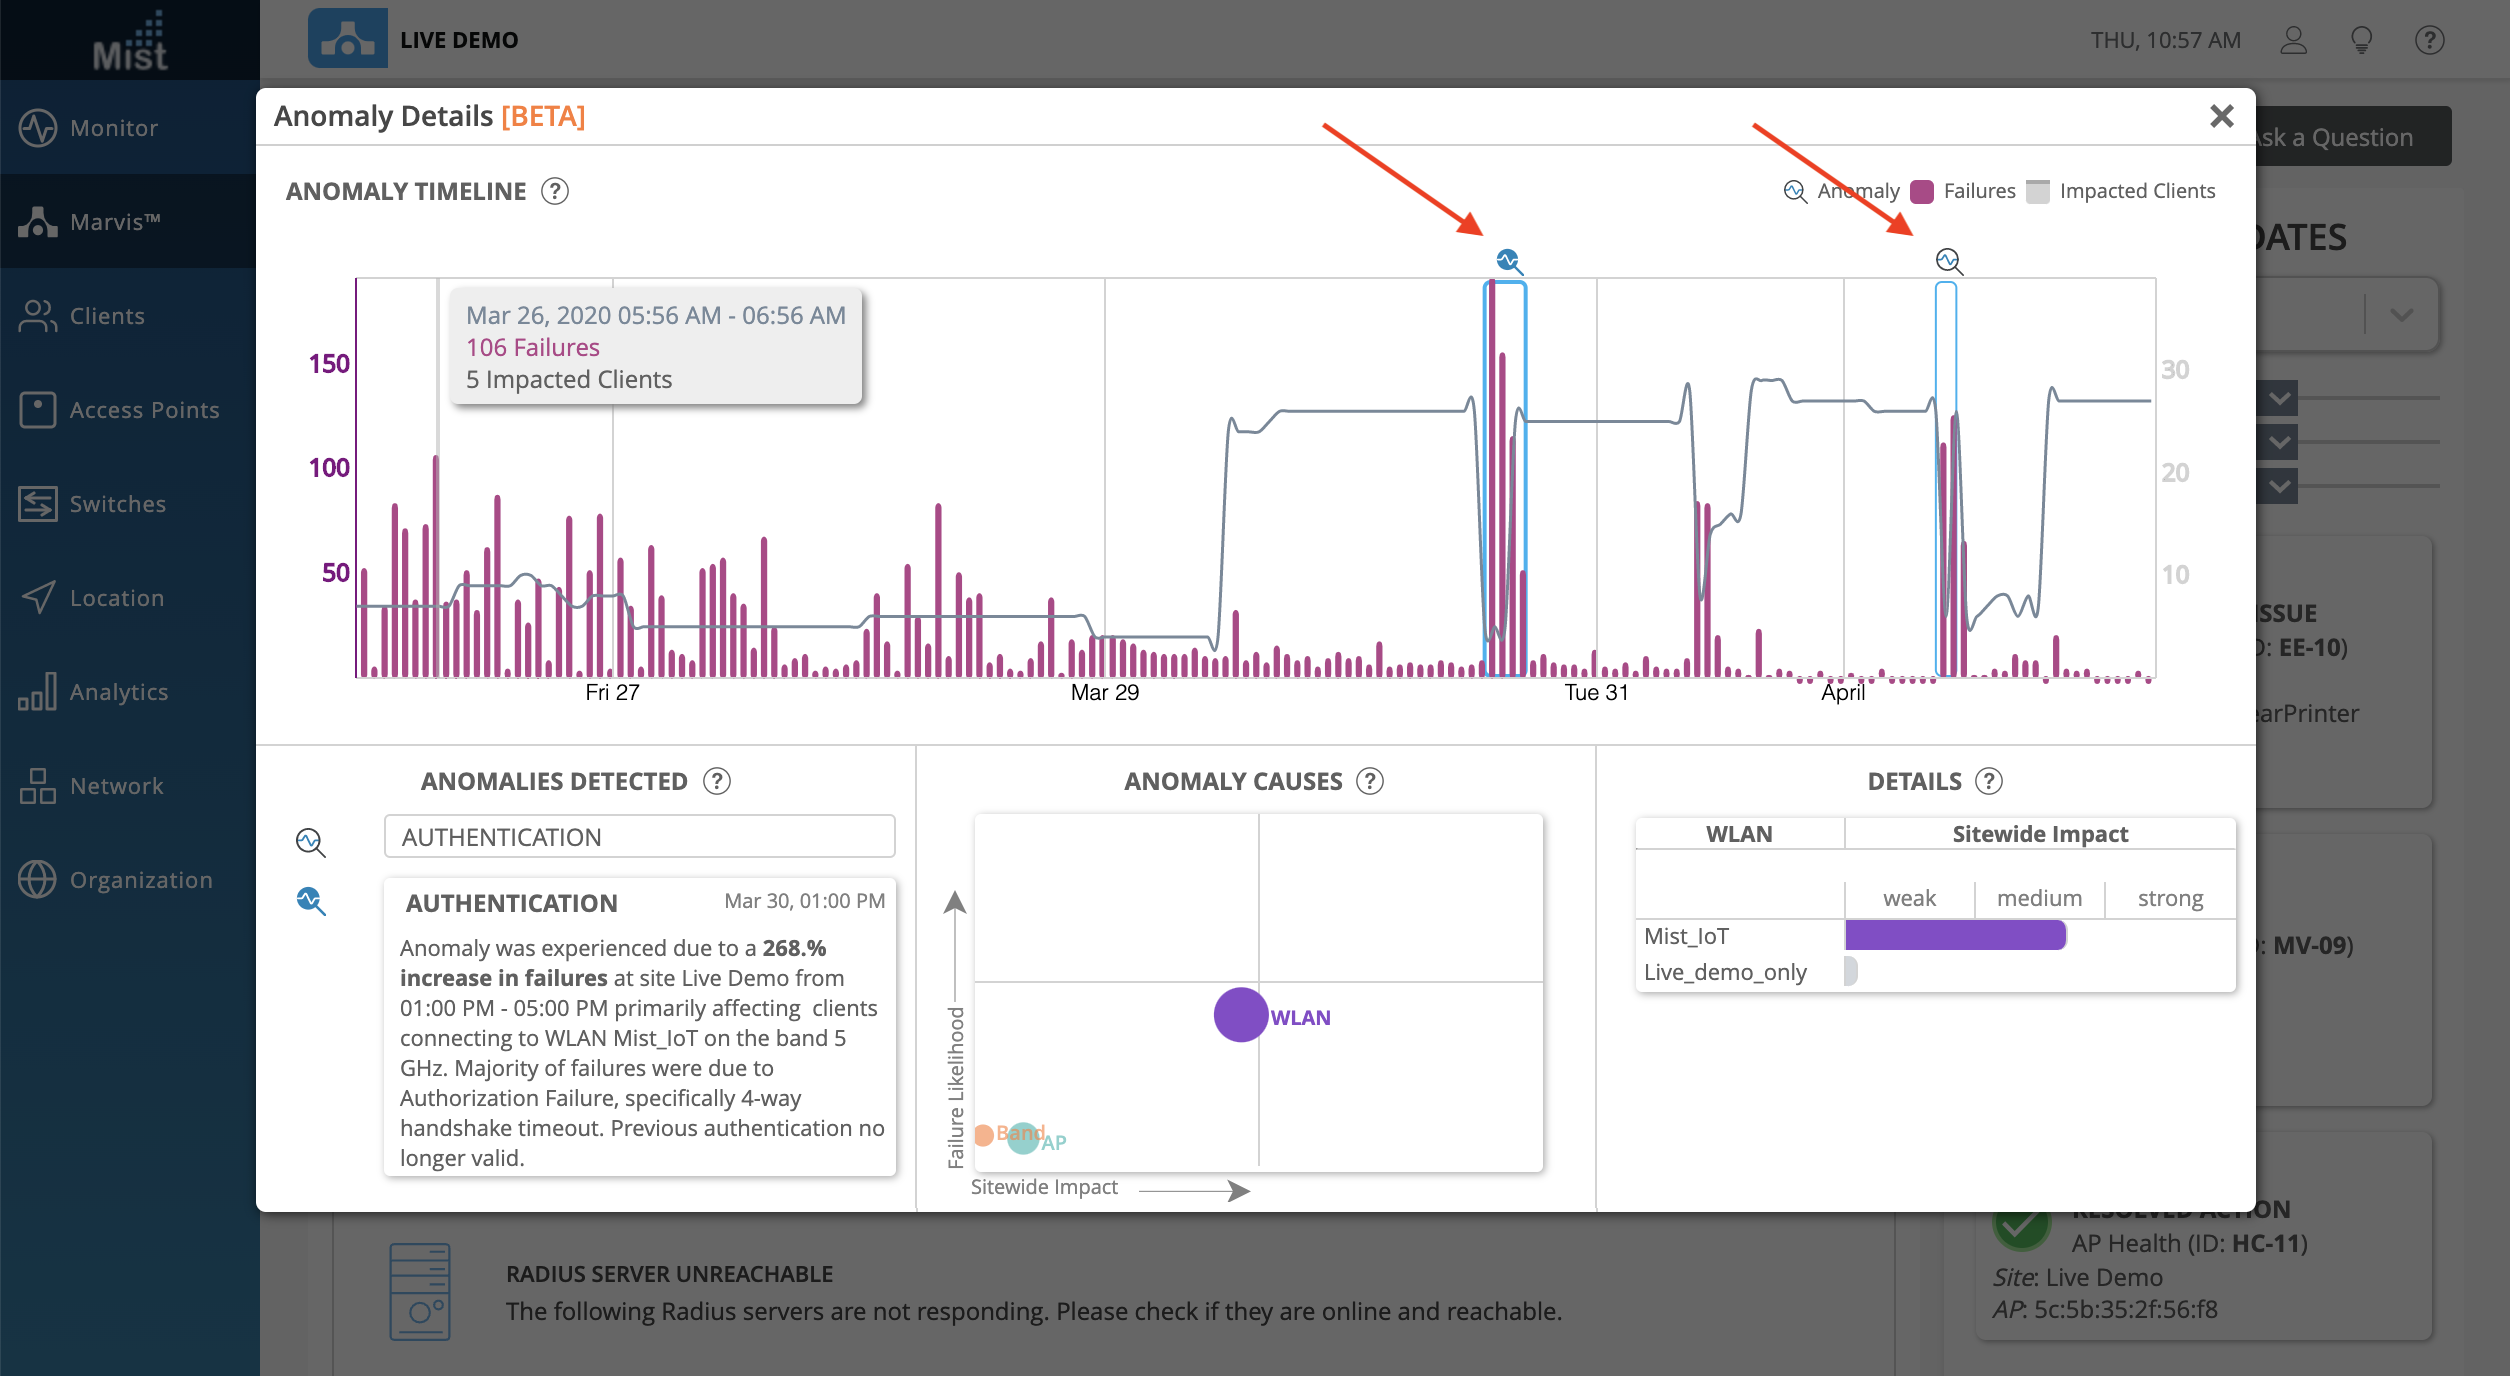
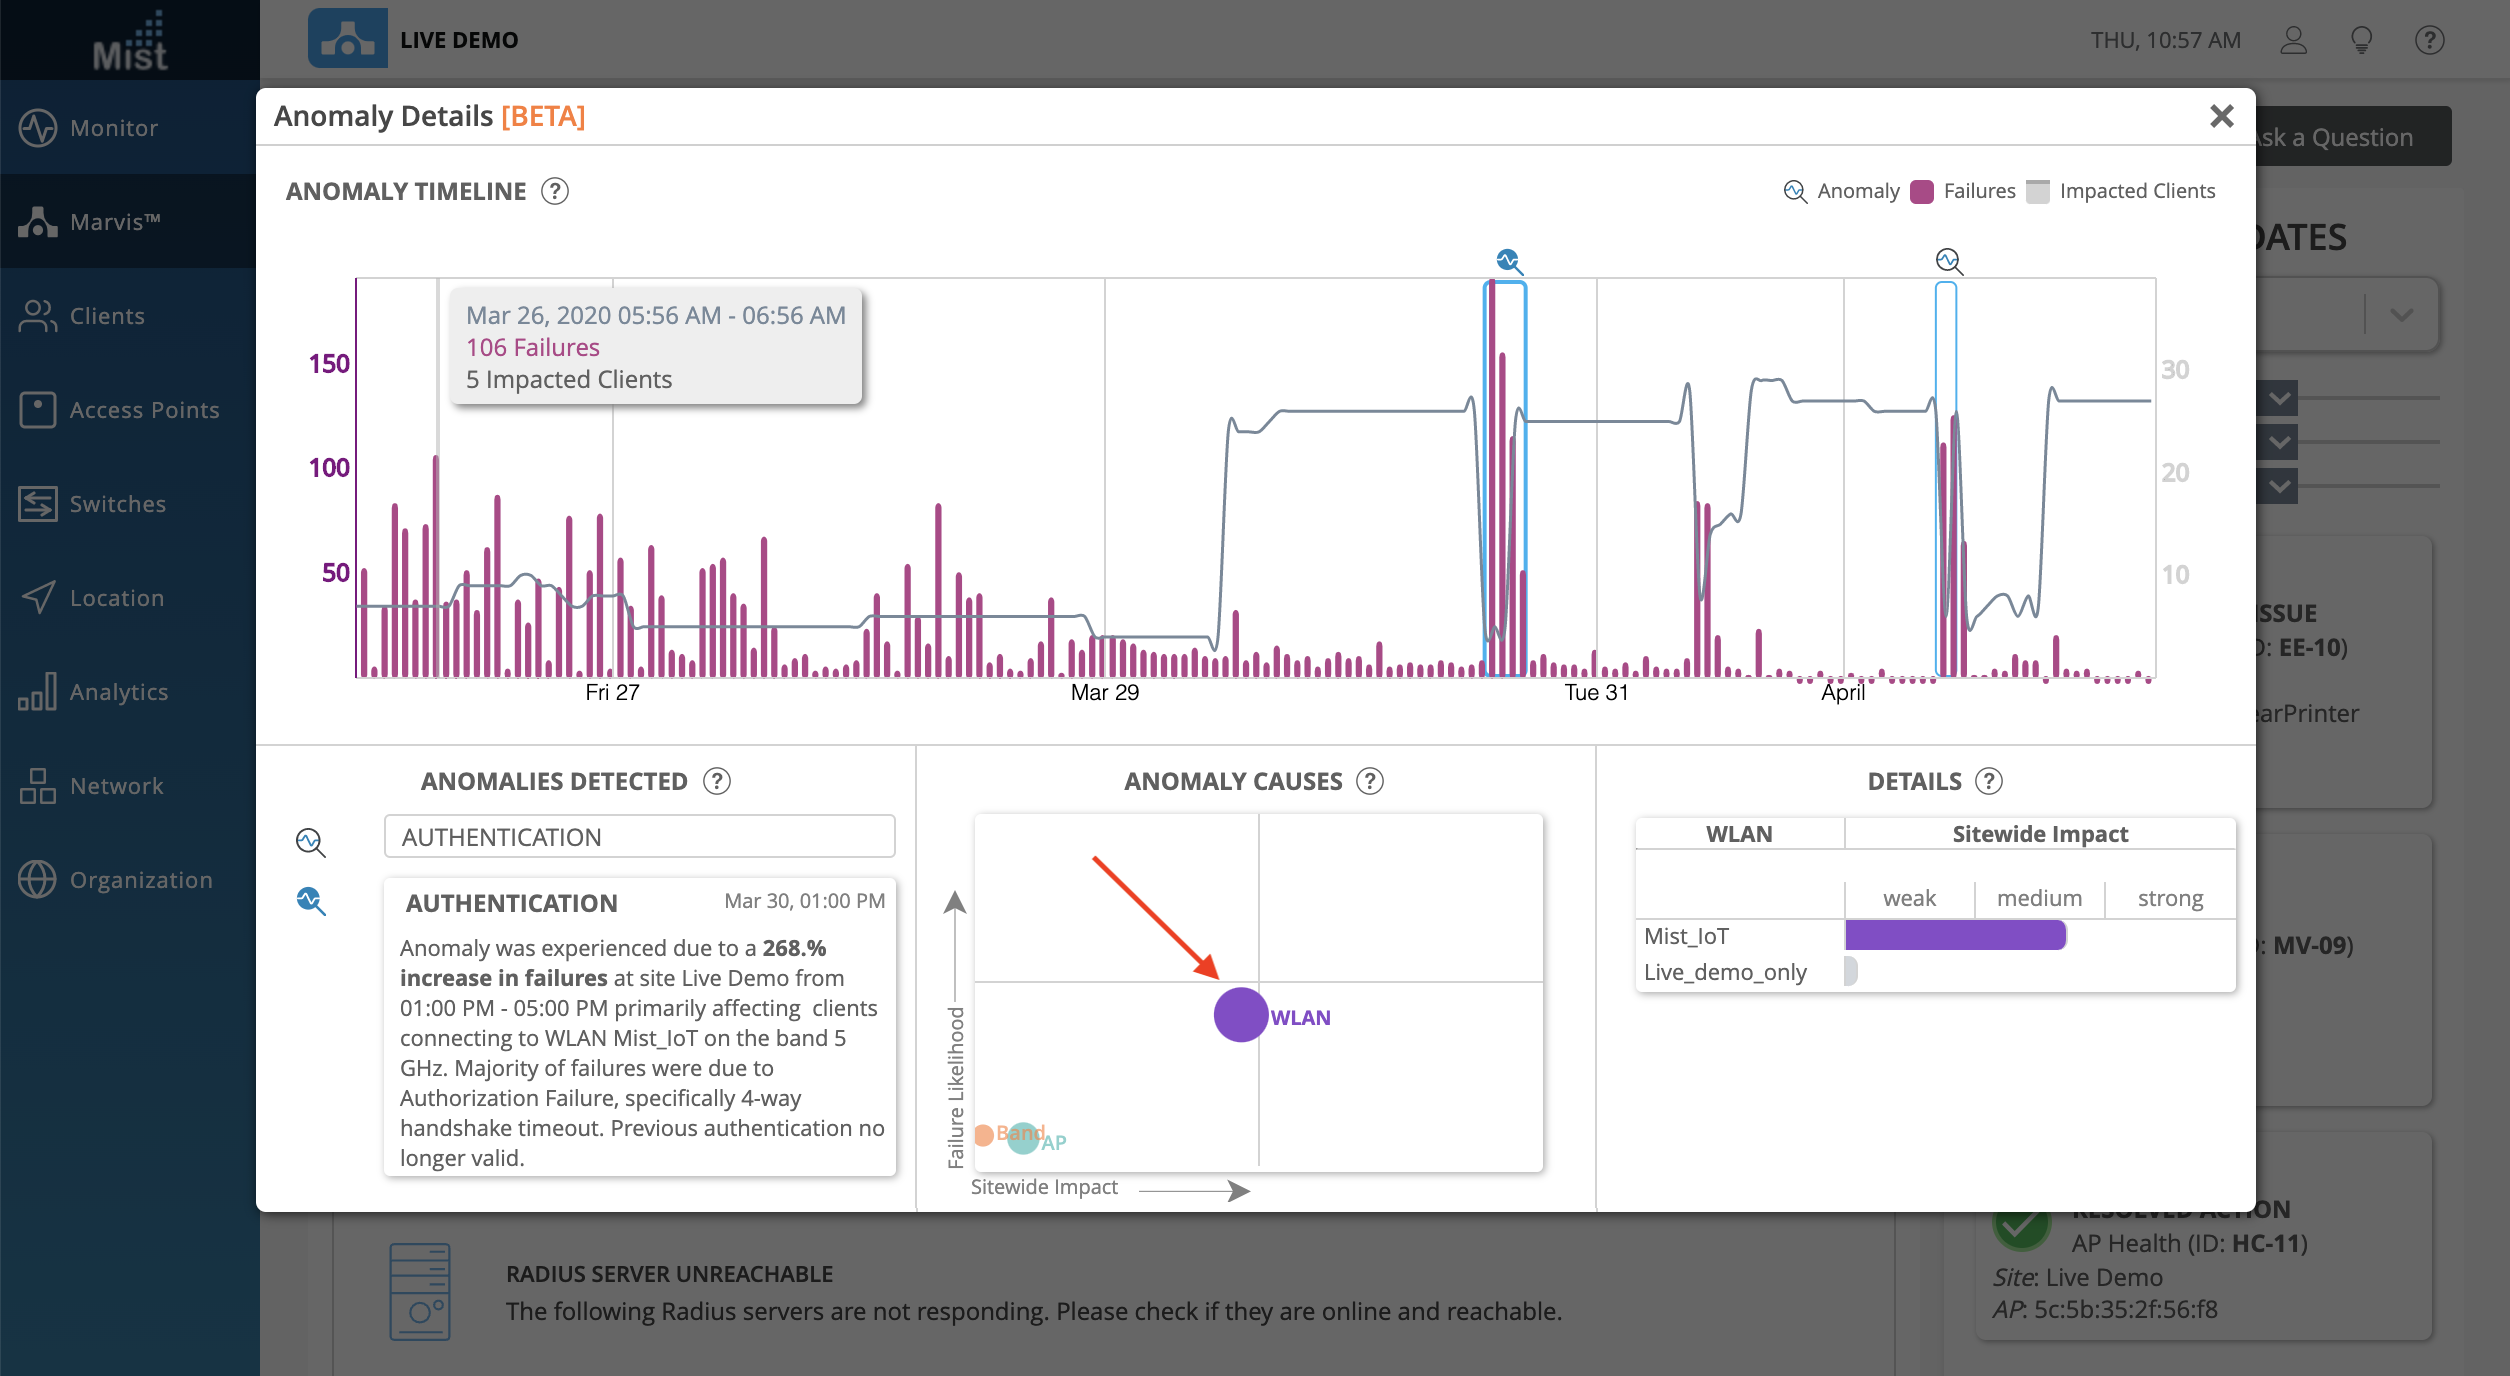
The Anomaly Timeline shows a timeline view of the number of failure events corresponding with the number of impacted clients during this time. Detected anomalies are indicated with the magnifying glass icon, and you may click on these to select an anomaly to view. In this timeline we have 2 detected anomalies.
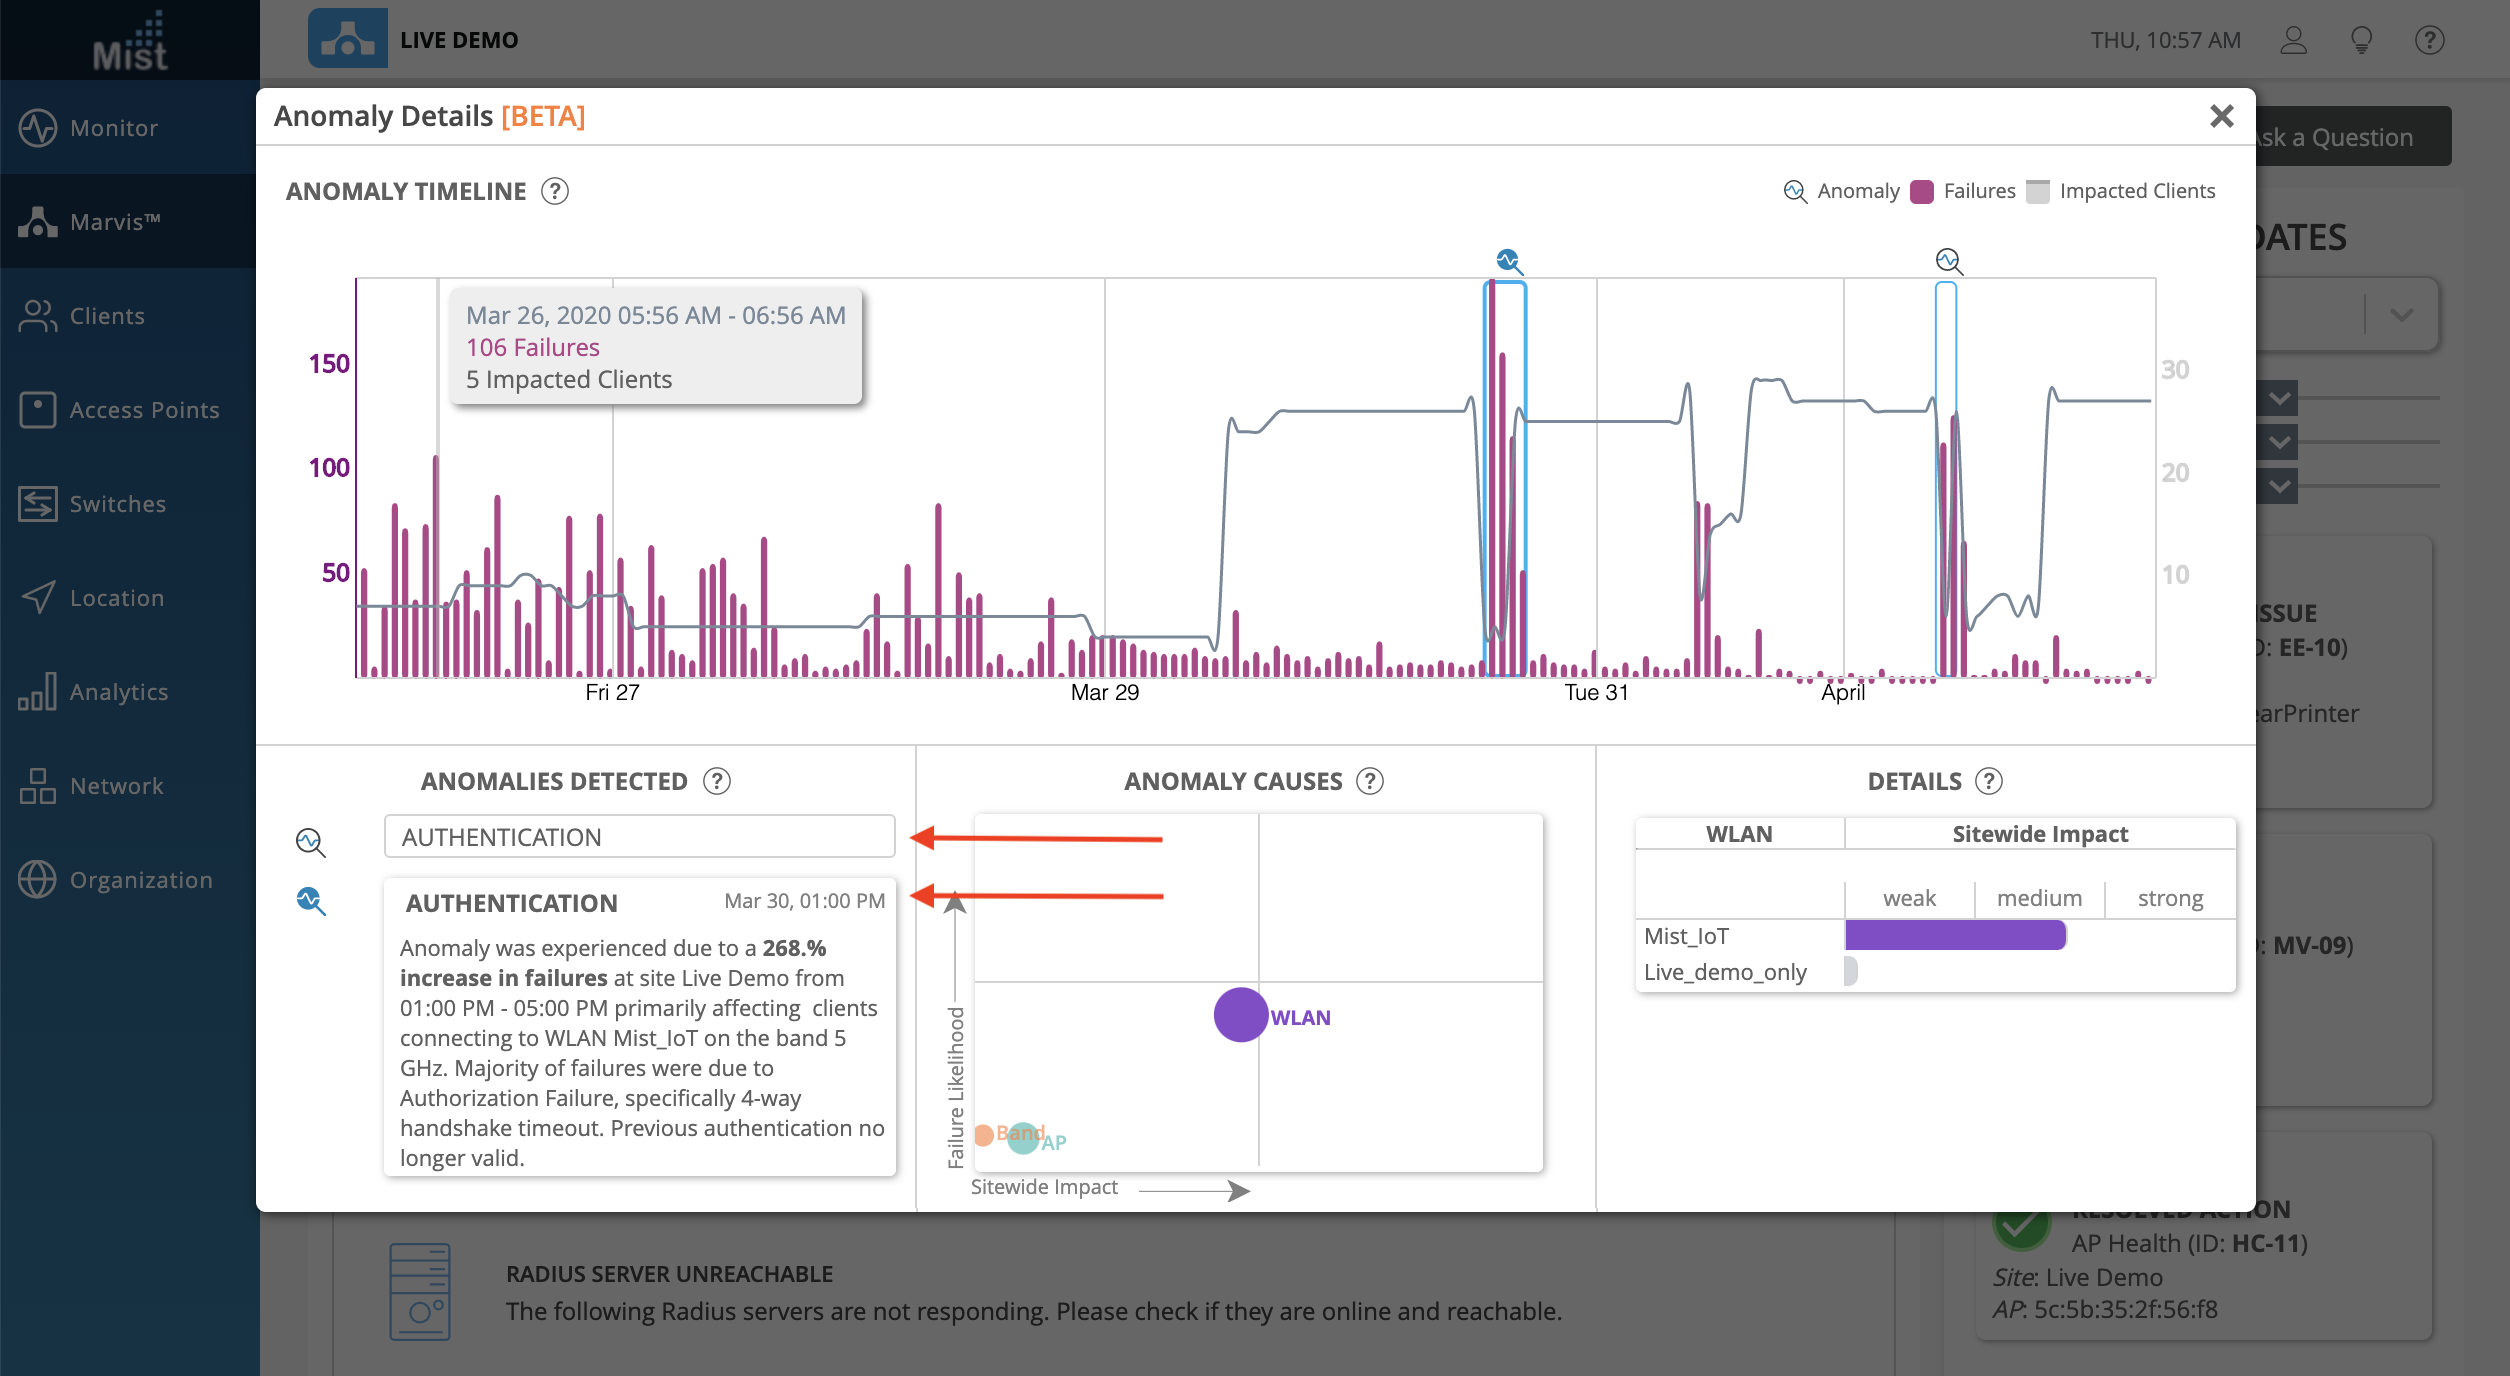
The Anomalies Detected section gives you a description of each anomaly, explaining what the increase in failures were at the time, what the most likely cause was, and if the clients mostly failed on a certain Band, AP, or WLAN. Select between different anomalies by clicking their Title. Here, we have 2 different Authentication anomalies.
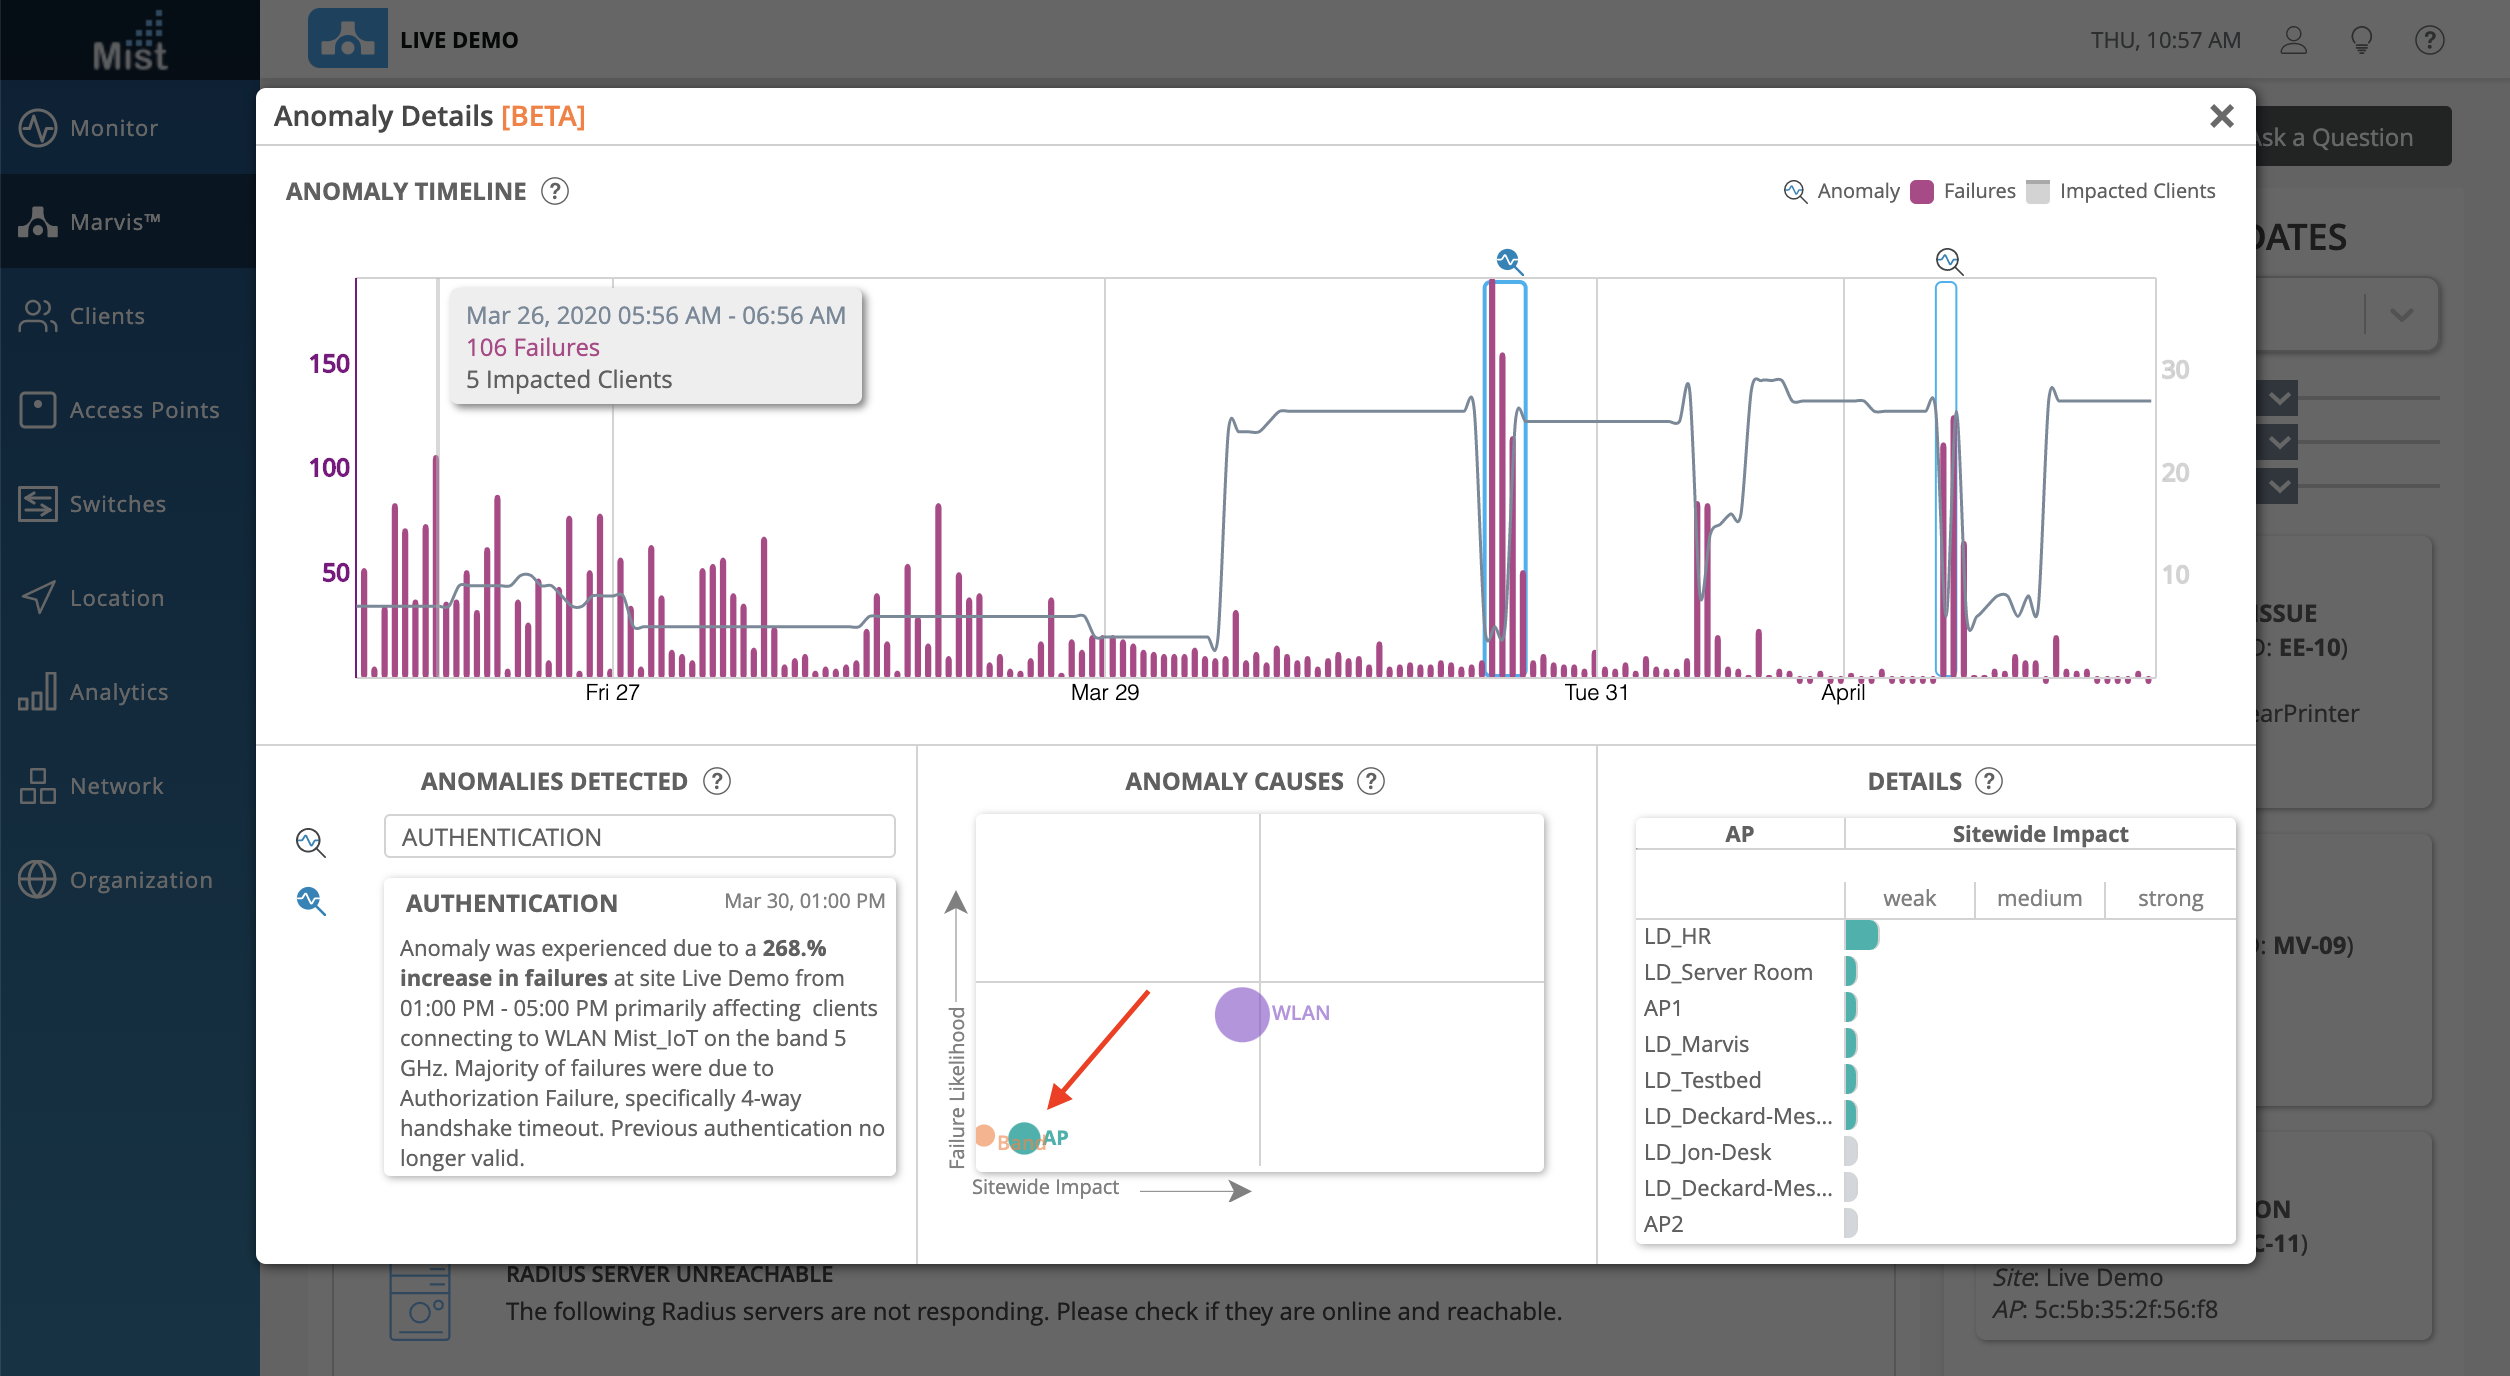
The Anomaly Causes section gives you a graphical representation of the impact between AP, WLAN, and Radio Band. The size of the circle indicates the correlation to failure, and the positions on the graph show the Failure Likelihood as well as Sitewide Impact. Clicking on the circles will change the view of the Details box to the right, which lists out each of the APs, WLANs, or Bands, giving a more in depth view of sitewide impact from each specific element.
Here, selecting the WLAN circle will reveal the list of WLANs which contributed to the anomaly. In our example we can see that the Mist_IoT WLAN has a stronger impact on this anomaly:
Selecting the AP circle shows the list of APs which were correlated to the anomaly event: