There are many algorithms and data mining techniques that empower artificial intelligence (AI)-driven technologies, including virtual network assistants. In the world of wireless networking, mutual information is important because it helps to determine which network features (e.g. mobile device type, client or access point) have the highest probability of predicting failure or success. This can then be used to set, monitor and enforce service level expectations (SLE) that optimize the wireless service.
Let’s start by defining mutual information. Mutual information is defined in terms of the entropy between two random variables. Mathematically, the equation for mutual information is defined as the entropy of random variable “Y” minus the conditional entropy of “Y,” given “X”; which is the information we receive about Y when we know X.
In our case, let’s say “Y” is one of our random variables representing an SLE metric. Next, we have the network feature that we’ll call network feature “X”. This network feature can be a device type, OS type, or even a user or an access point (AP). Any possible feature of the network can be represented by this random variable.
Entropy represents the uncertainty of a random variable. For example, if all devices connected to the network are iPhones, then device type random variable has no uncertainty (i.e. zero entropy). However, when different device types such as Android, Chromebook and iPhone are connected to the network, device type entropy is non-zero, which capture the uncertainty in predicting what device types are connected to the network.
Now, let’s go back and see how mutual information works with SLE metrics.
Graphically, what does mutual information look like? Let’s say the circle on the left represents the entropy of the time-to-connect SLE metric, which takes pass or fail and the circle on the right is the entropy of our feature random variable, X.
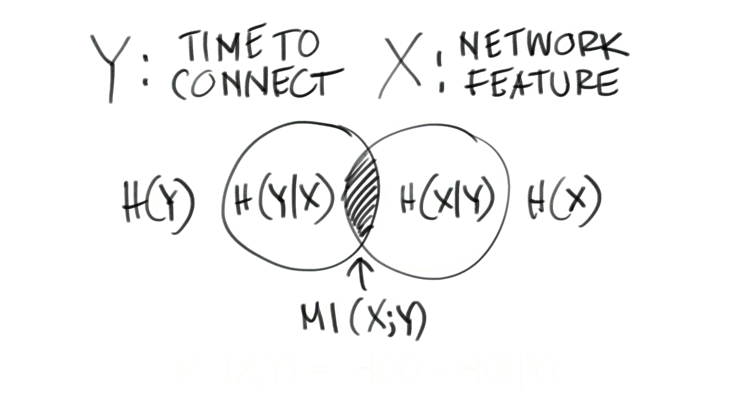
So, if we look at our equation graphically, the entropy of the SLE metric random variable “Y” (represented by the circle on the left), the conditional entropy of random variable “Y” given the network feature — H(Y|X), is enclosed.
If we subtract the two circles, we are looking for what is contained in the middle segment. This segment represents the mutual information of the two random variables, and it gives us an indication of how well the network feature provides information about the SLE metric.
Mutual information tells us how important the network feature X is at predicting the SLE random variable Y. However, it doesn’t tell us if the network feature is a predictor of success or failure. For that, we’ll use Pearson Correlation to give polarity to the prediction.
The equation for the Pearson Correlation is this:
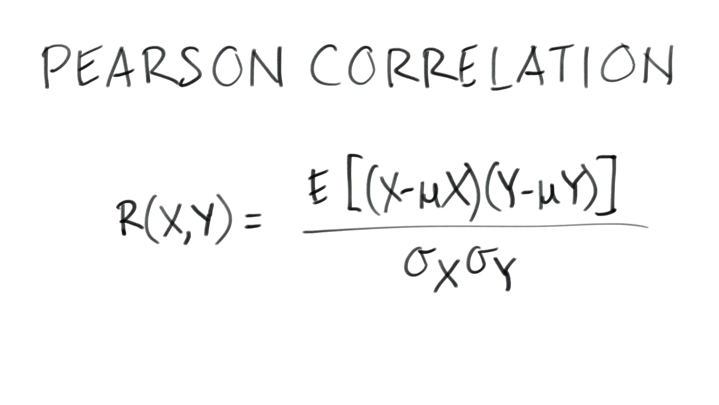
If you look at the picture of correlation, it tells us a couple things: the amount of correlation ranges from negative one to one, the sign (negative or positive) is a predictor of pass or fail.
The slope tells us the magnitude, or how correlated we are. Next, the sign of the correlation predicts failure or success. If we land closer to a negative one, it is good at predicting failure. If we are closer to one, it is good at predicting a pass. If it’s zero, it means there is no linear correlation.
The Pearson correlation is a measure of the linear correlation between two random variables.
However, it doesn’t capture non-linear correlations. If we refer back to our original Venn diagram graphic, we can pull these two algorithms together to predict the importance of the network feature in predicting the success or failure of the SLE metric.
The mutual information theory, coupled with the Pearson correlation, is a building block for AI technologies. Hopefully, this provides a little more insight into how data mining and AI works with various technologies, such as wireless networks.