Marvis
New Actions – ARP and DNS Failure
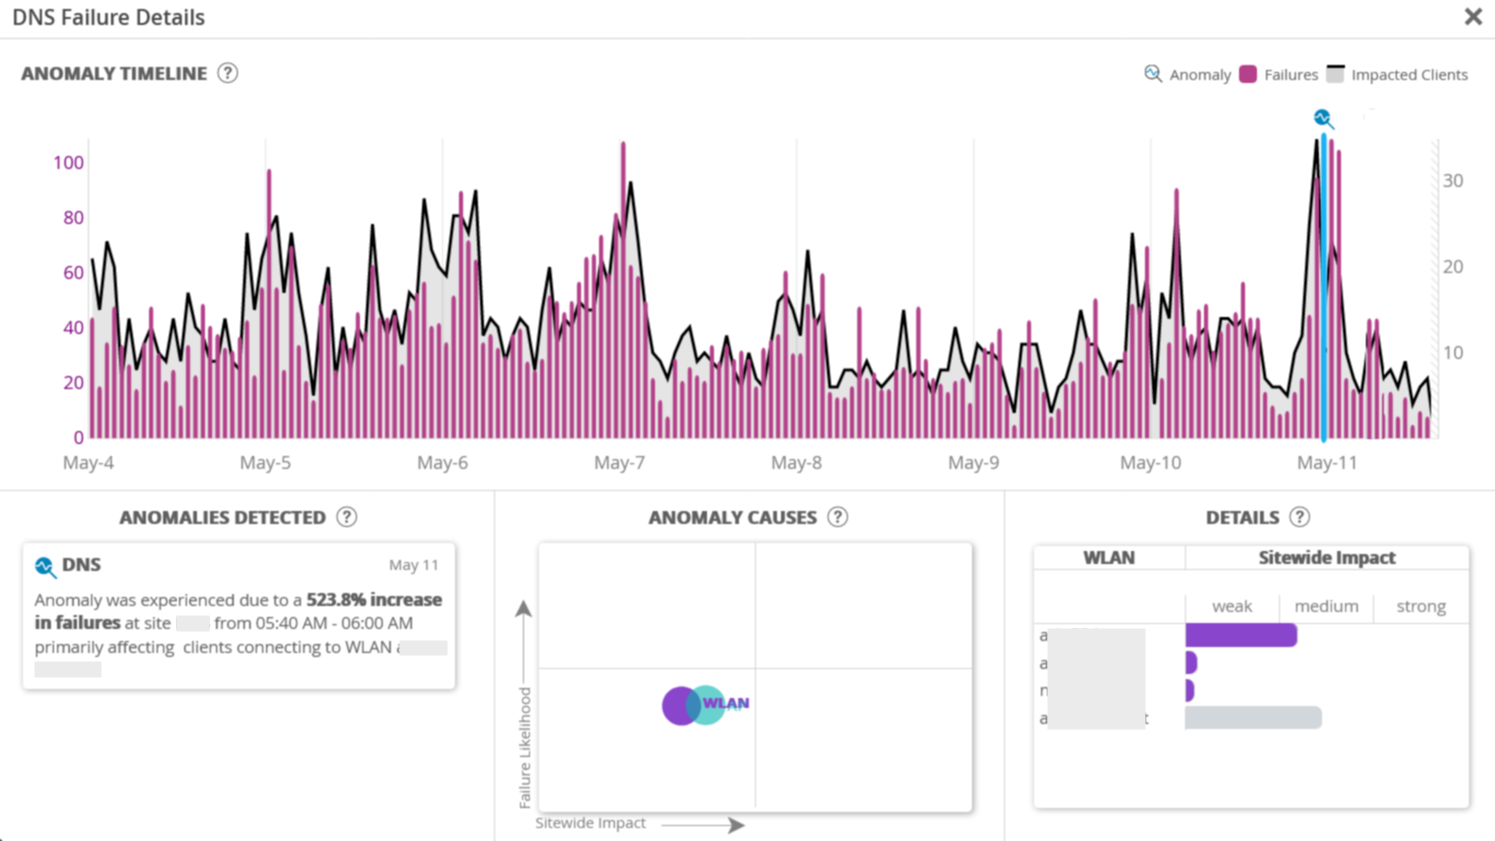
This week we are bringing you two new Actions in the Connectivity section of the Marvis Action Dashboard – ARP Failure and DNS Failure. These two Actions make use of our Anomaly Detection model to identify sites with clients experiencing an unusually high number of failures for ARP and DNS events. You can access the Anomaly Detection details card directly from the Action Dashboard page to see a timeline of failures as well as the impact of APs, WLANs, and Radio Bands to pinpoint the source of the issue.
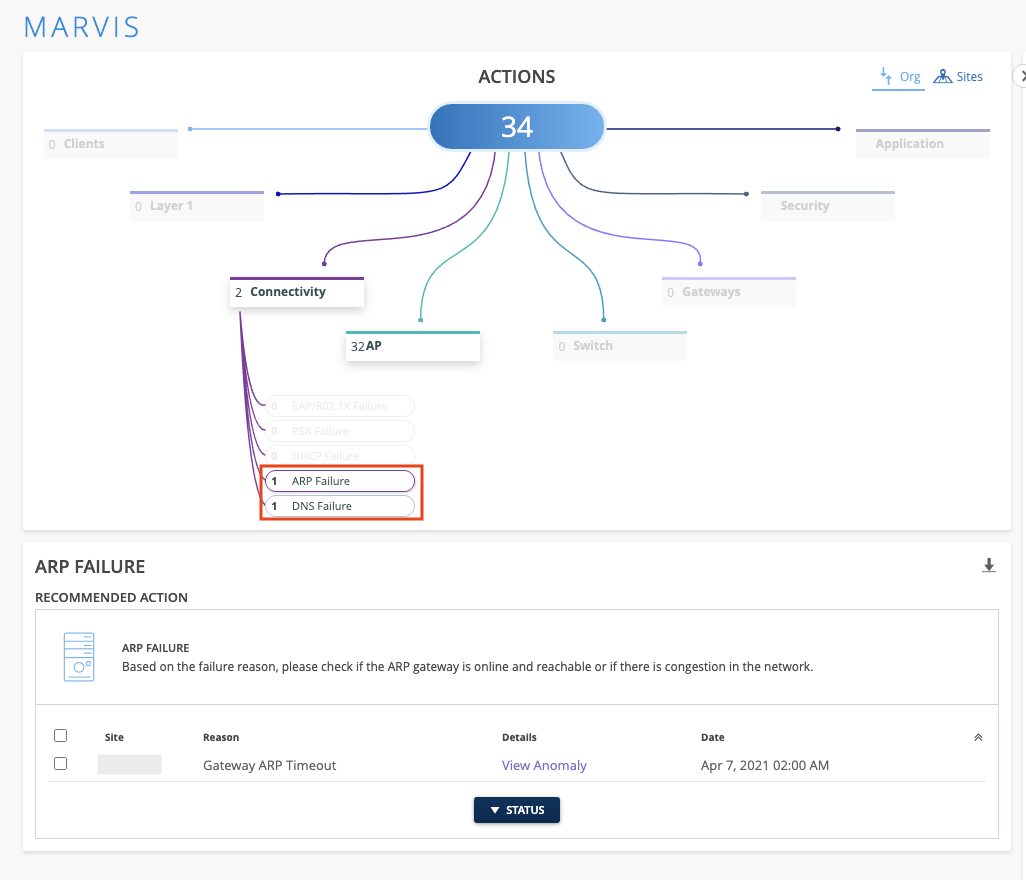
Click on the View Anomaly link in the Details column to open up the Anomaly Detection card. This will look familiar since this card is used for all the Connectivity actions (PSK, 802.1X, and DHCP Failure).
Marvis Search – Troubleshoot DHCP and ARP
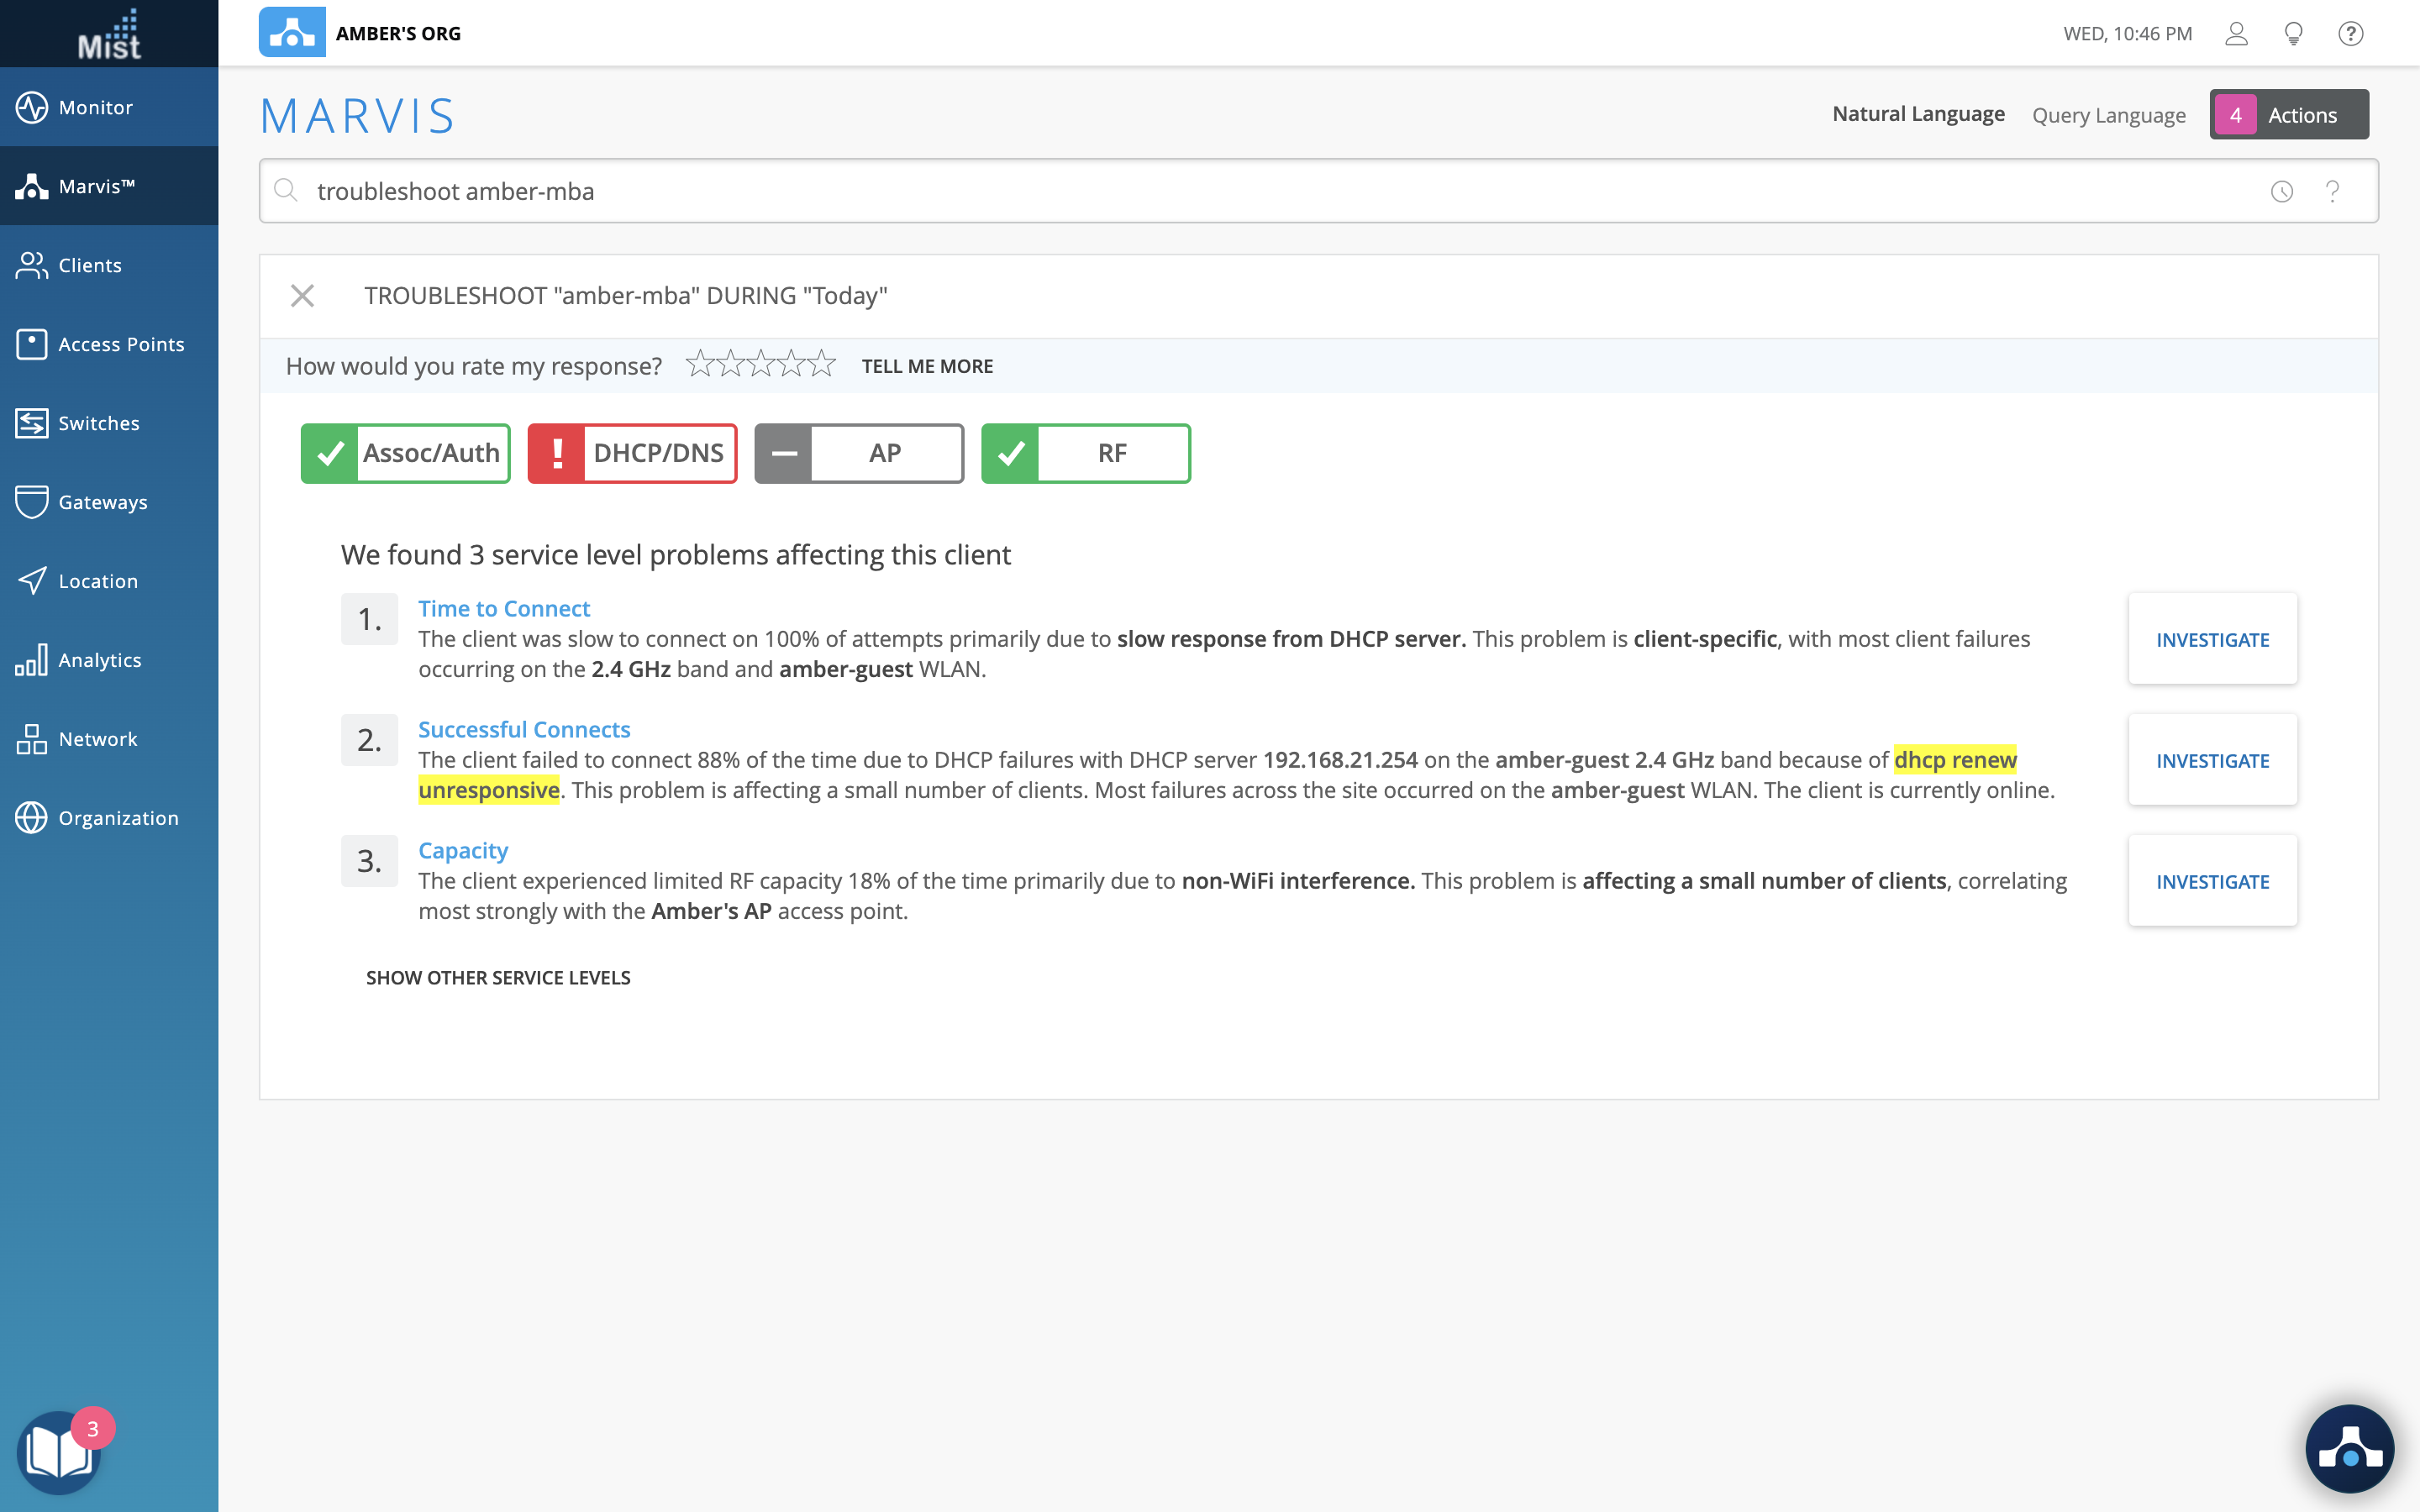
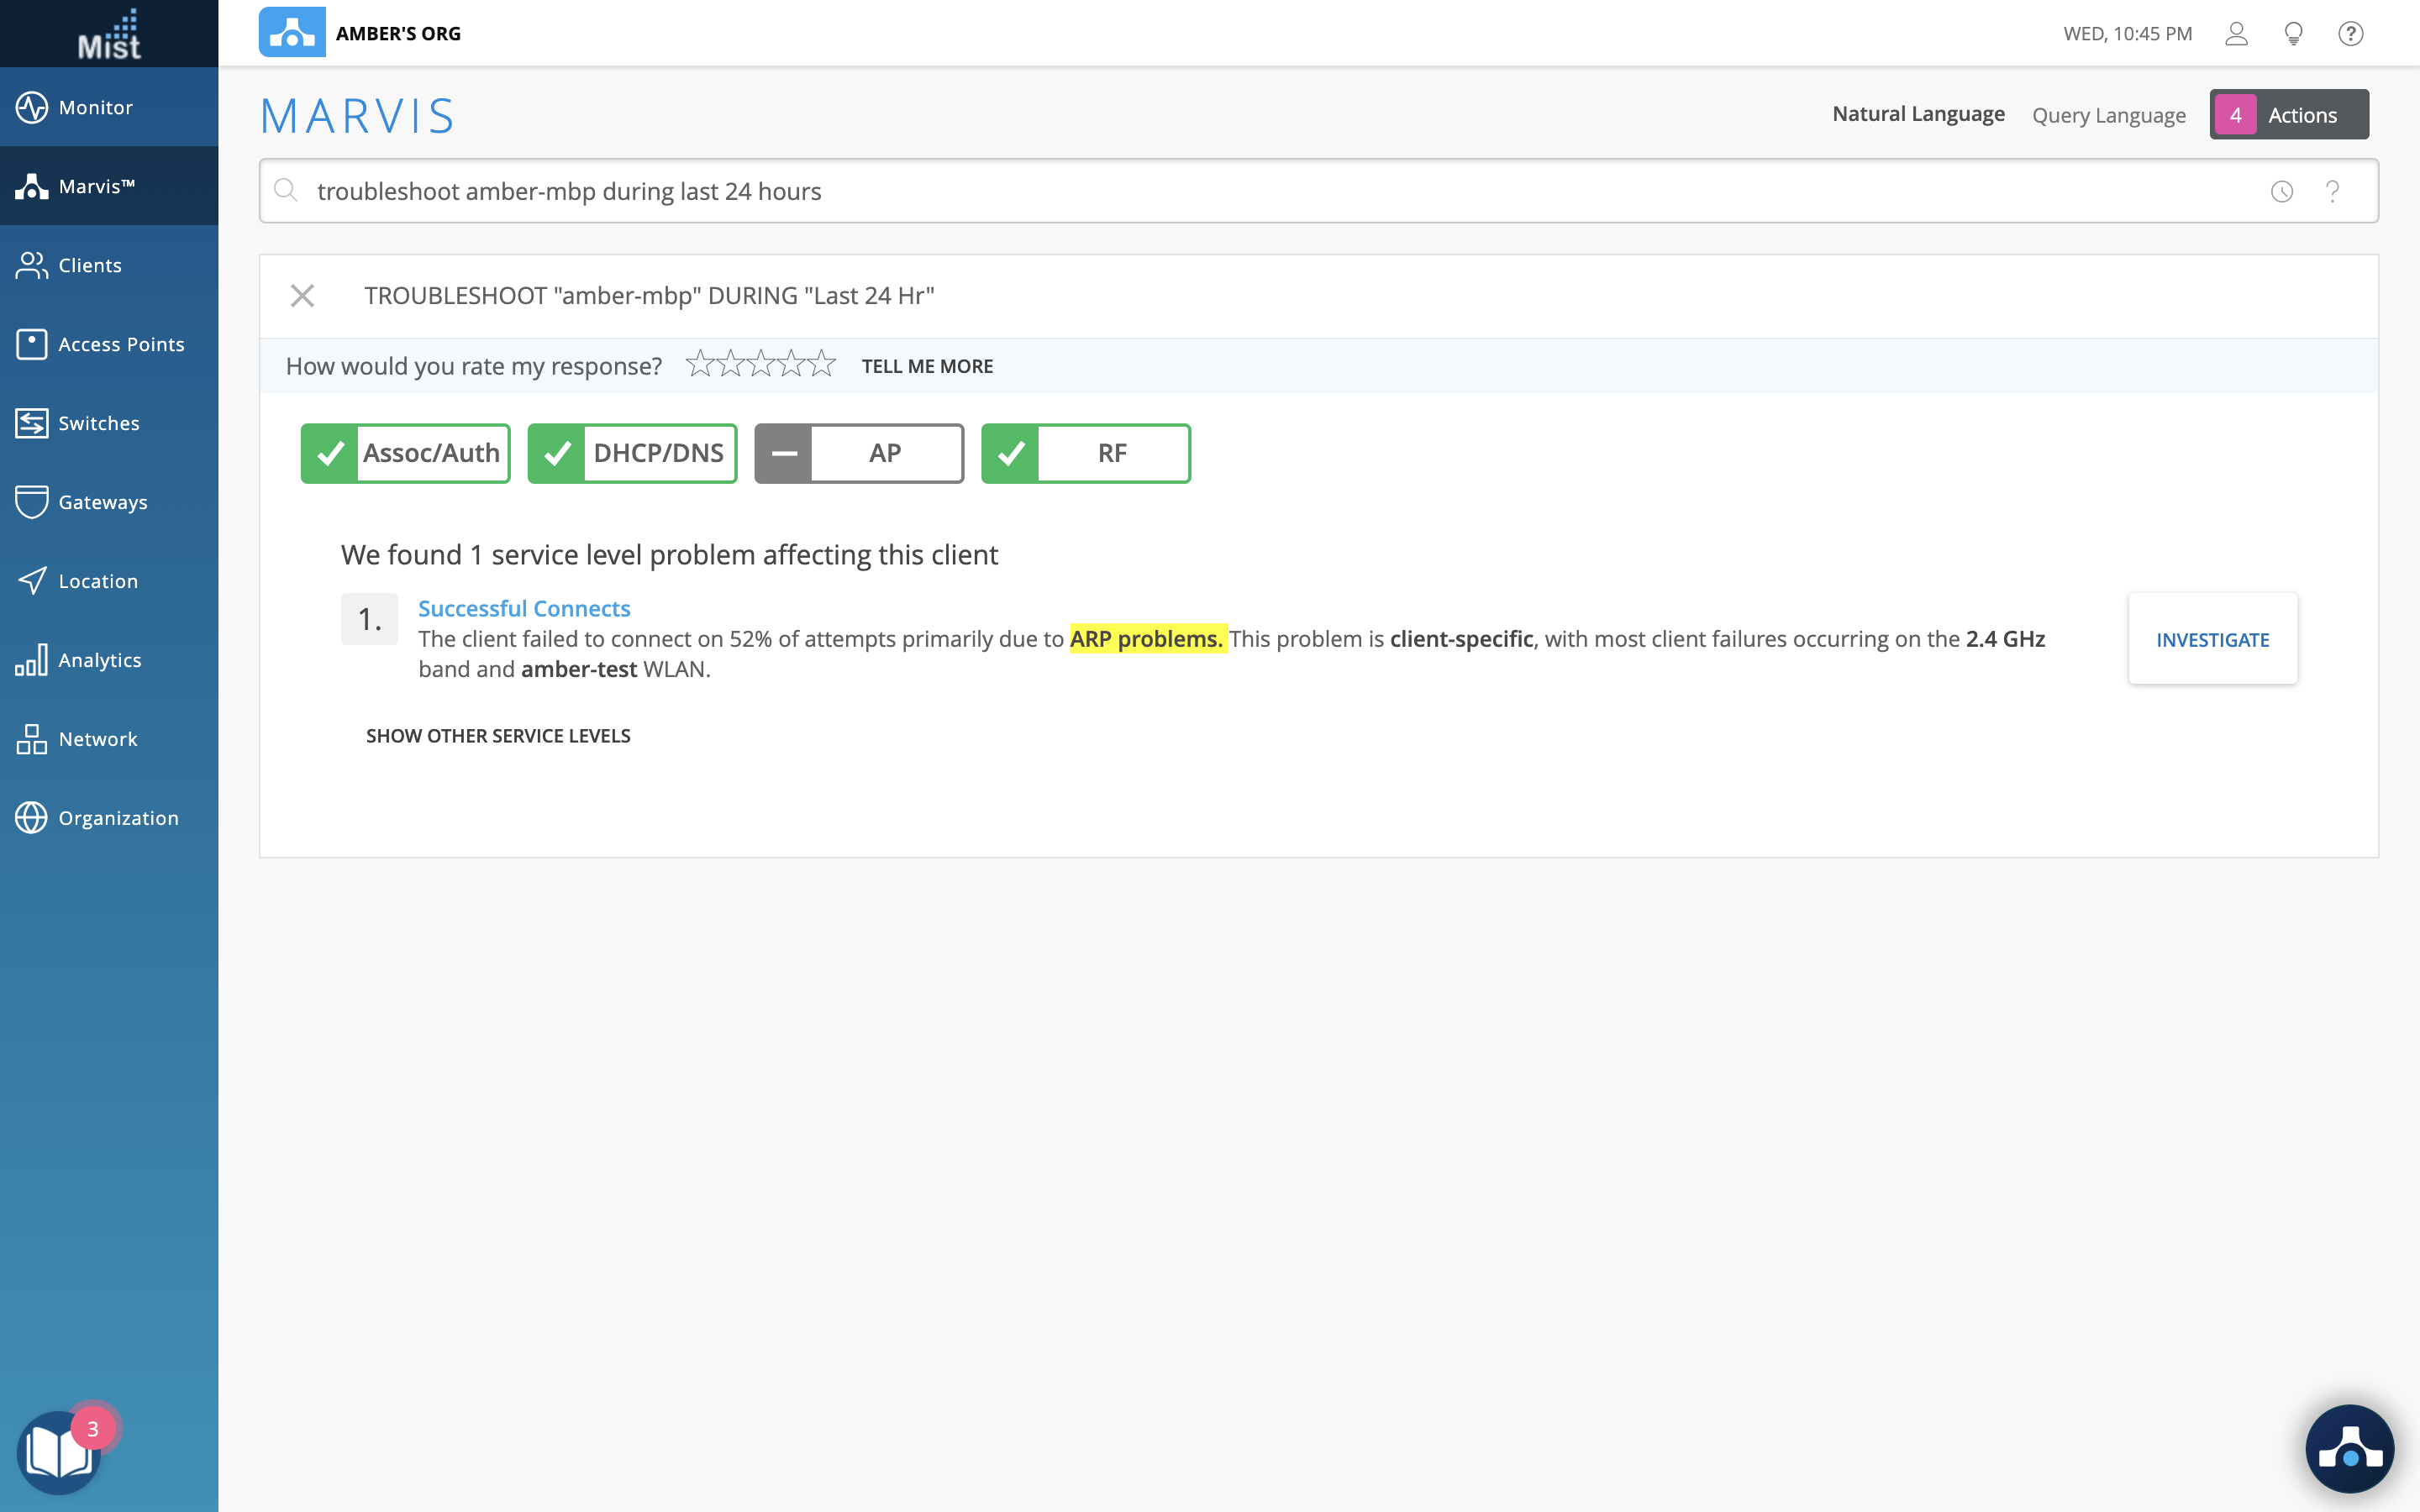
Troubleshooting DHCP and ARP issues on your site just got easier with the introduction of these search queries in our Marvis Search bar. See if clients on your site are experiencing DHCP or ARP issues by simply using the Troubleshoot <Client> search query. These issues may be impacting your site and will cause failures seen on the Successful Connects SLE. Here are the types of DHCP and ARP failures we can detect in the Marvis search:
DHCP Failures:
- Discover Unresponsive
- DHCP Incomplete/Stuck
- DHCP Nack
- Renew Unresponsive
ARP Failures:
- Gateway ARP Timeout
- Excessive ARPing
- ARP timeout
Here, you can see that these clients are experiencing DHCP and ARP issues:
Wired and WAN Assurance
Download Switch Configuration
To help provide a better understanding of all configurations running on your Juniper switch, we have added the ability to download your switch configuration as an easy to read text file. This allows you to view all of the details in a Junos config format – your text file will contain your configurations in this format:
set protocols rstp interface ap edge

set system host-name ex4300-LD-TEST1

set system time-zone UTC

set vlans default vlan-id 1

set vlans testin l3-interface irb.3000

set vlans testin vlan-id 3000

set vlans vlan10 vlan-id 10

set vlans vlan2 vlan-id 2

set vlans vlan24 vlan-id 24

set system name-server 8.8.8.8
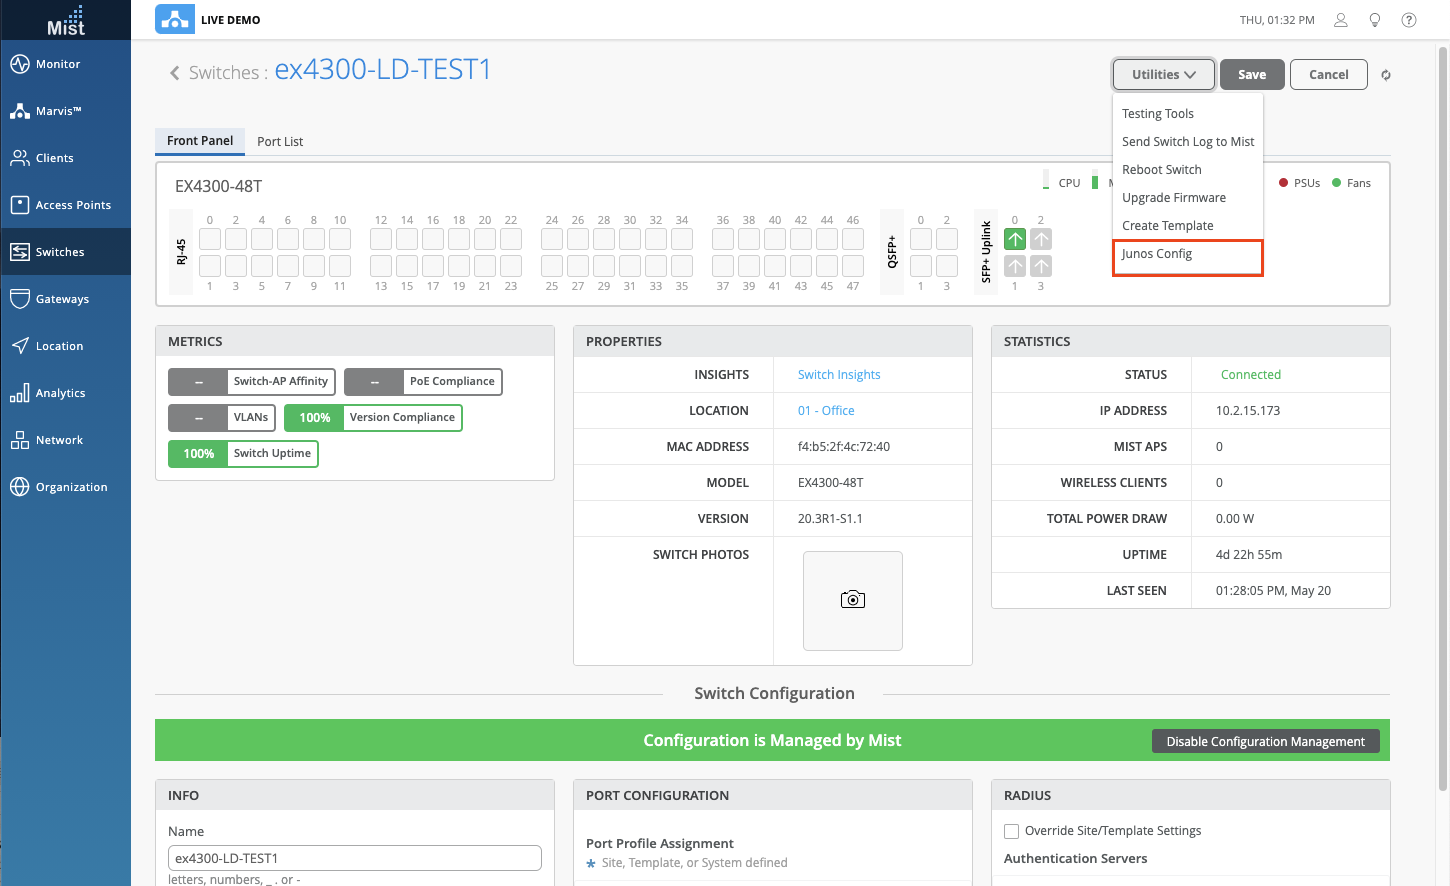
Access the switch configuration file in the Switch Details page by selecting Junos Config in the Utilities drop down menu. The Junos Config file returned will be the intended configuration of the switch.
Show Configuration Diff
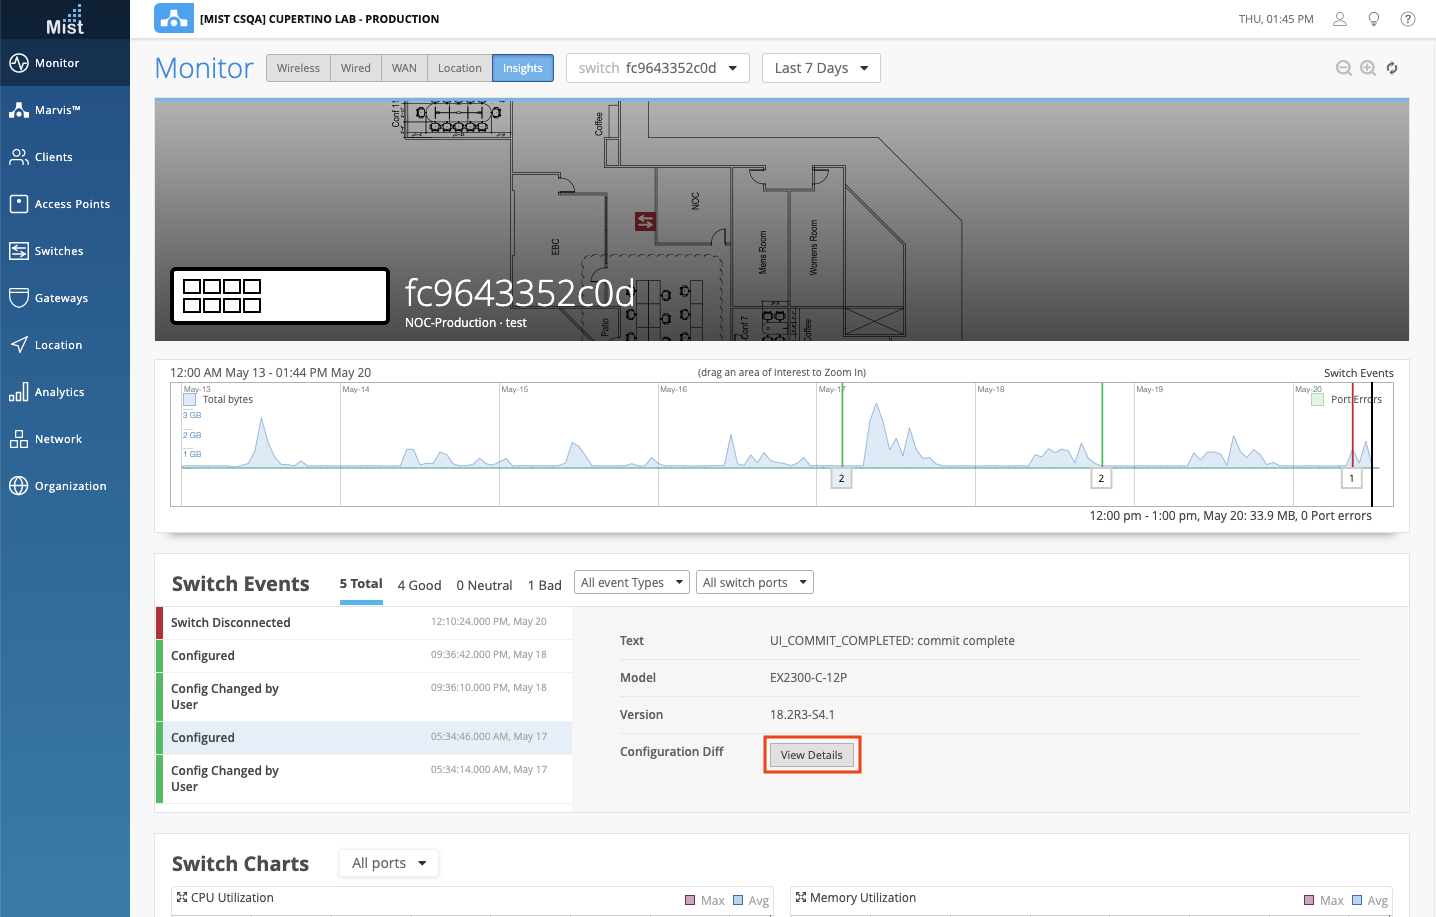
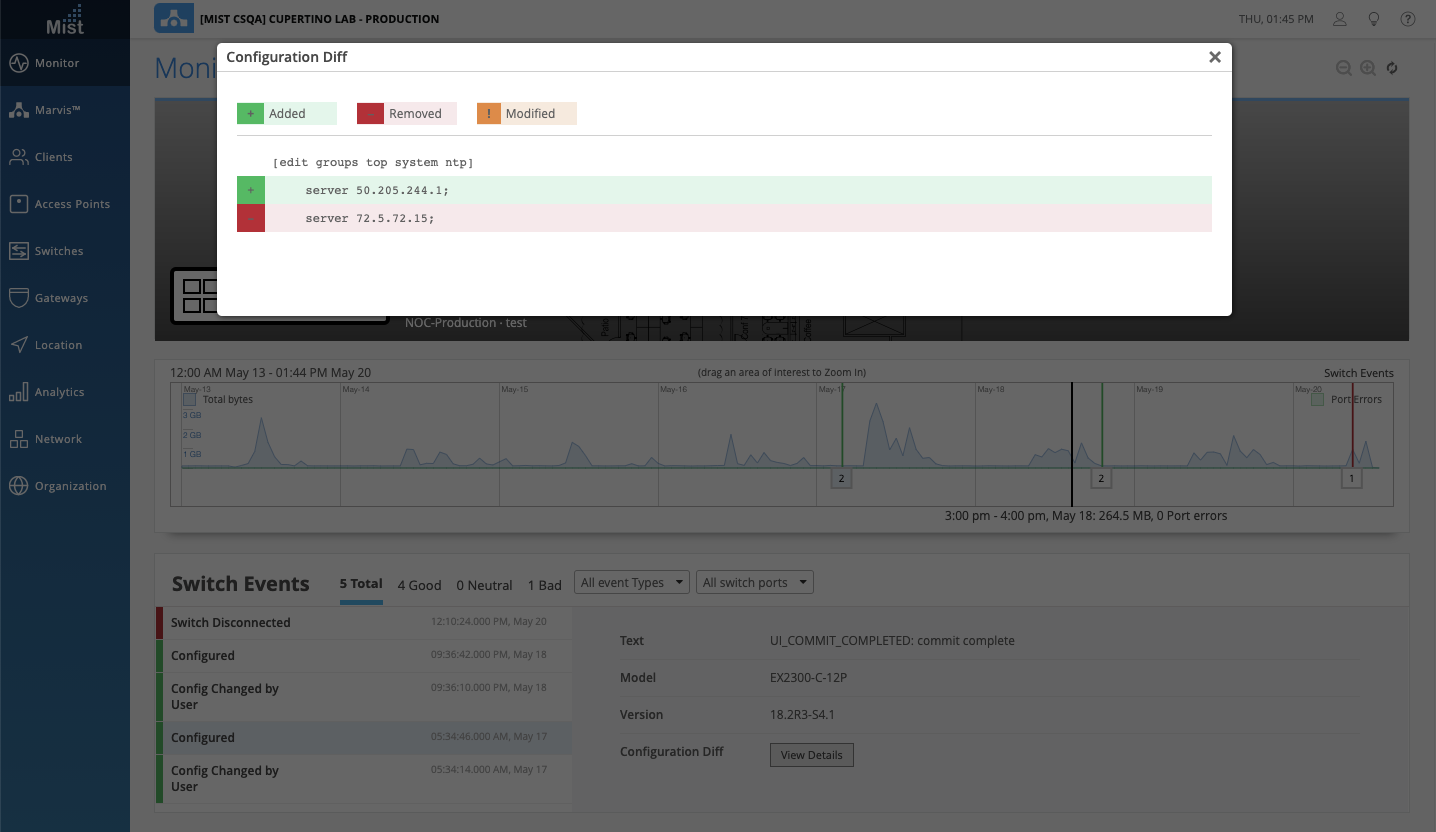
In the Switch Insights page, you can see Switch Events whenever a configuration change is made. To provide more context and visibility to your switch events, we have added the ability to see the Configuration Diff that occurred in that event as a pop up graphic. This is useful for viewing any configuration changes, additions, or subtractions that were performed by a configuration event.
To view your Configuration Diff, navigate to Monitor > Service Levels, select the Insights tab, and use the dropdown menu to select your desired switch. In the Switch Events section, click on a Configured event and click the View Details button to see what configuration changes were made.
Switch Template Improvements
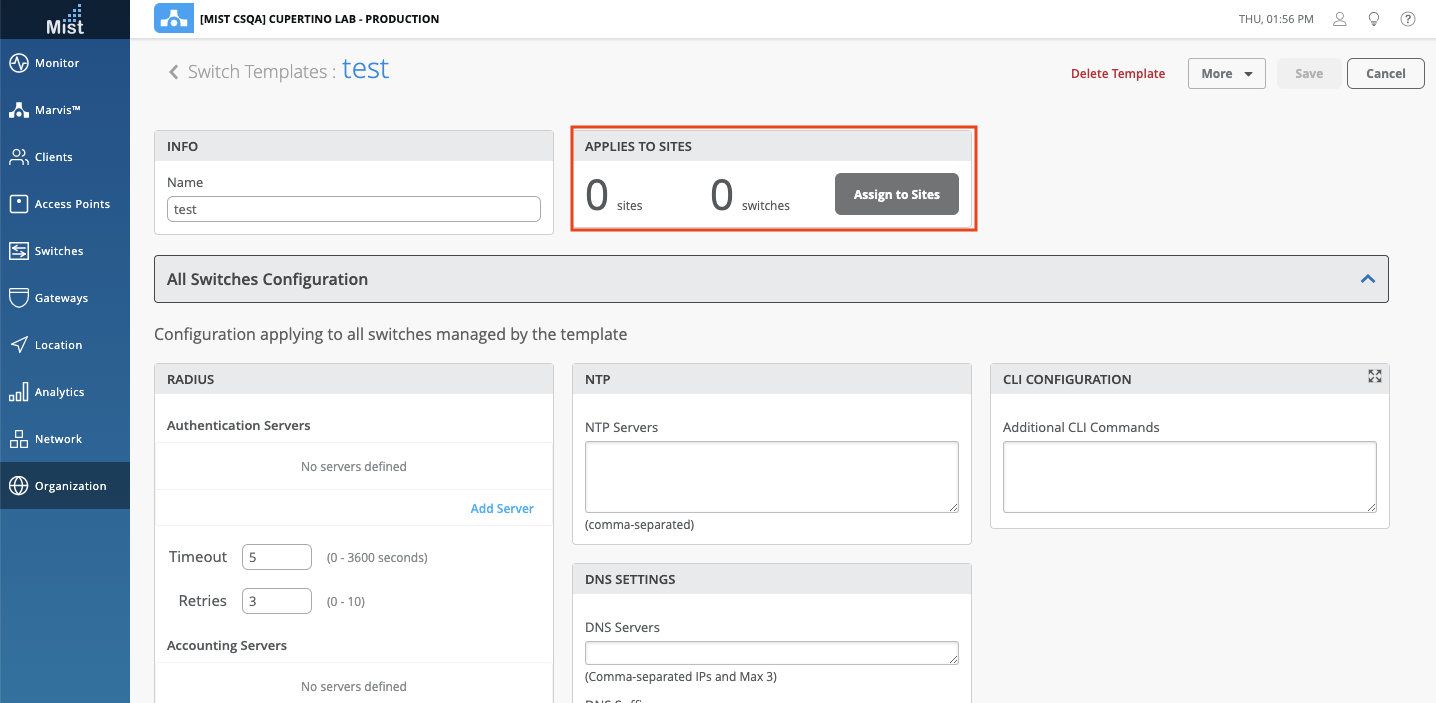
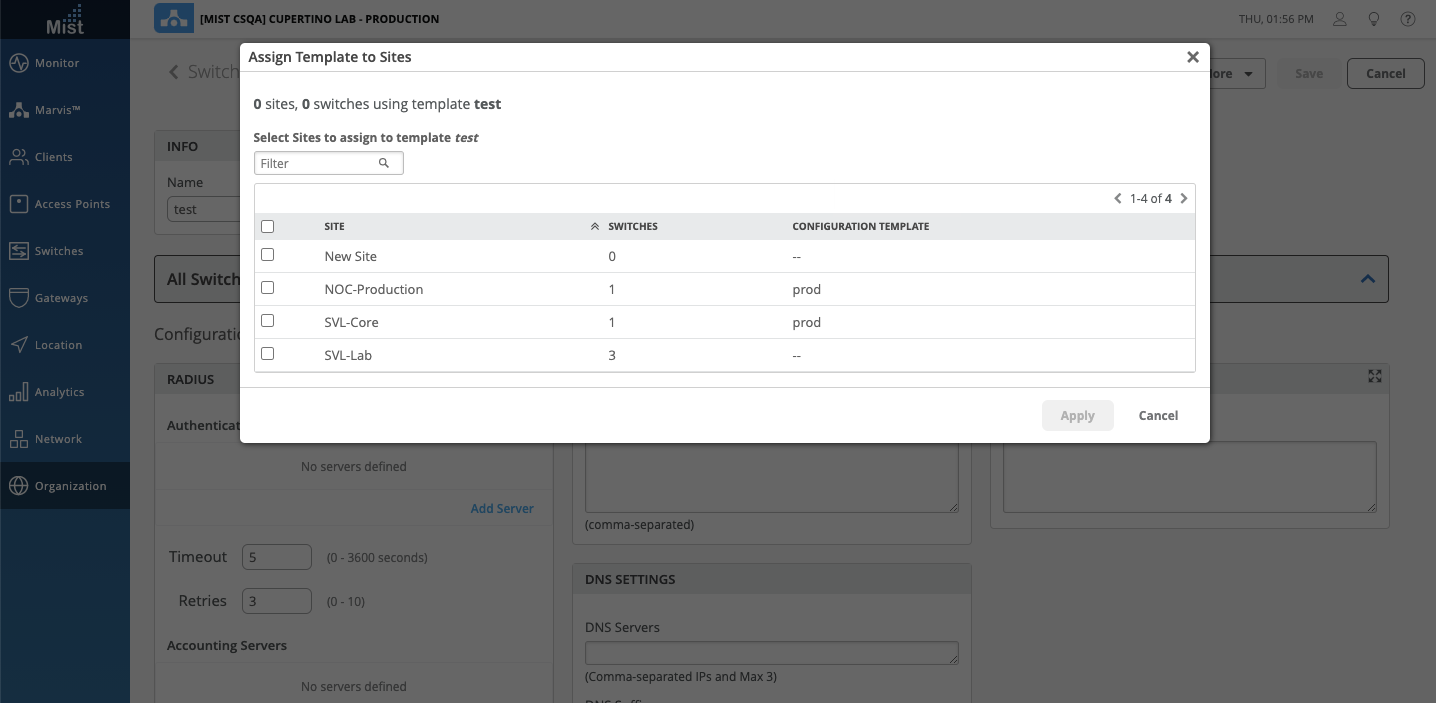
To help improve the flow of configuring and applying Switch Templates, we have added the ability to apply switch templates to sites directly from the Switch Templates page. Before, we required you to first Create or Import a switch template, and then navigate to the Network > Switch Configuration page to assign that template to a site. Now we have simplified the workflow by allowing you to apply your switch template from the same page where you created or imported your template. Please note that we did not remove the ability to assign sites in the Switch Configuration page – we simply added this ability onto the Switch Templates page.
In the Switch Templates page (Organization > Switch Templates), you can now use the Assign to Sites function when viewing your templates. Use the pop up to easily assign your template to the intended sites.
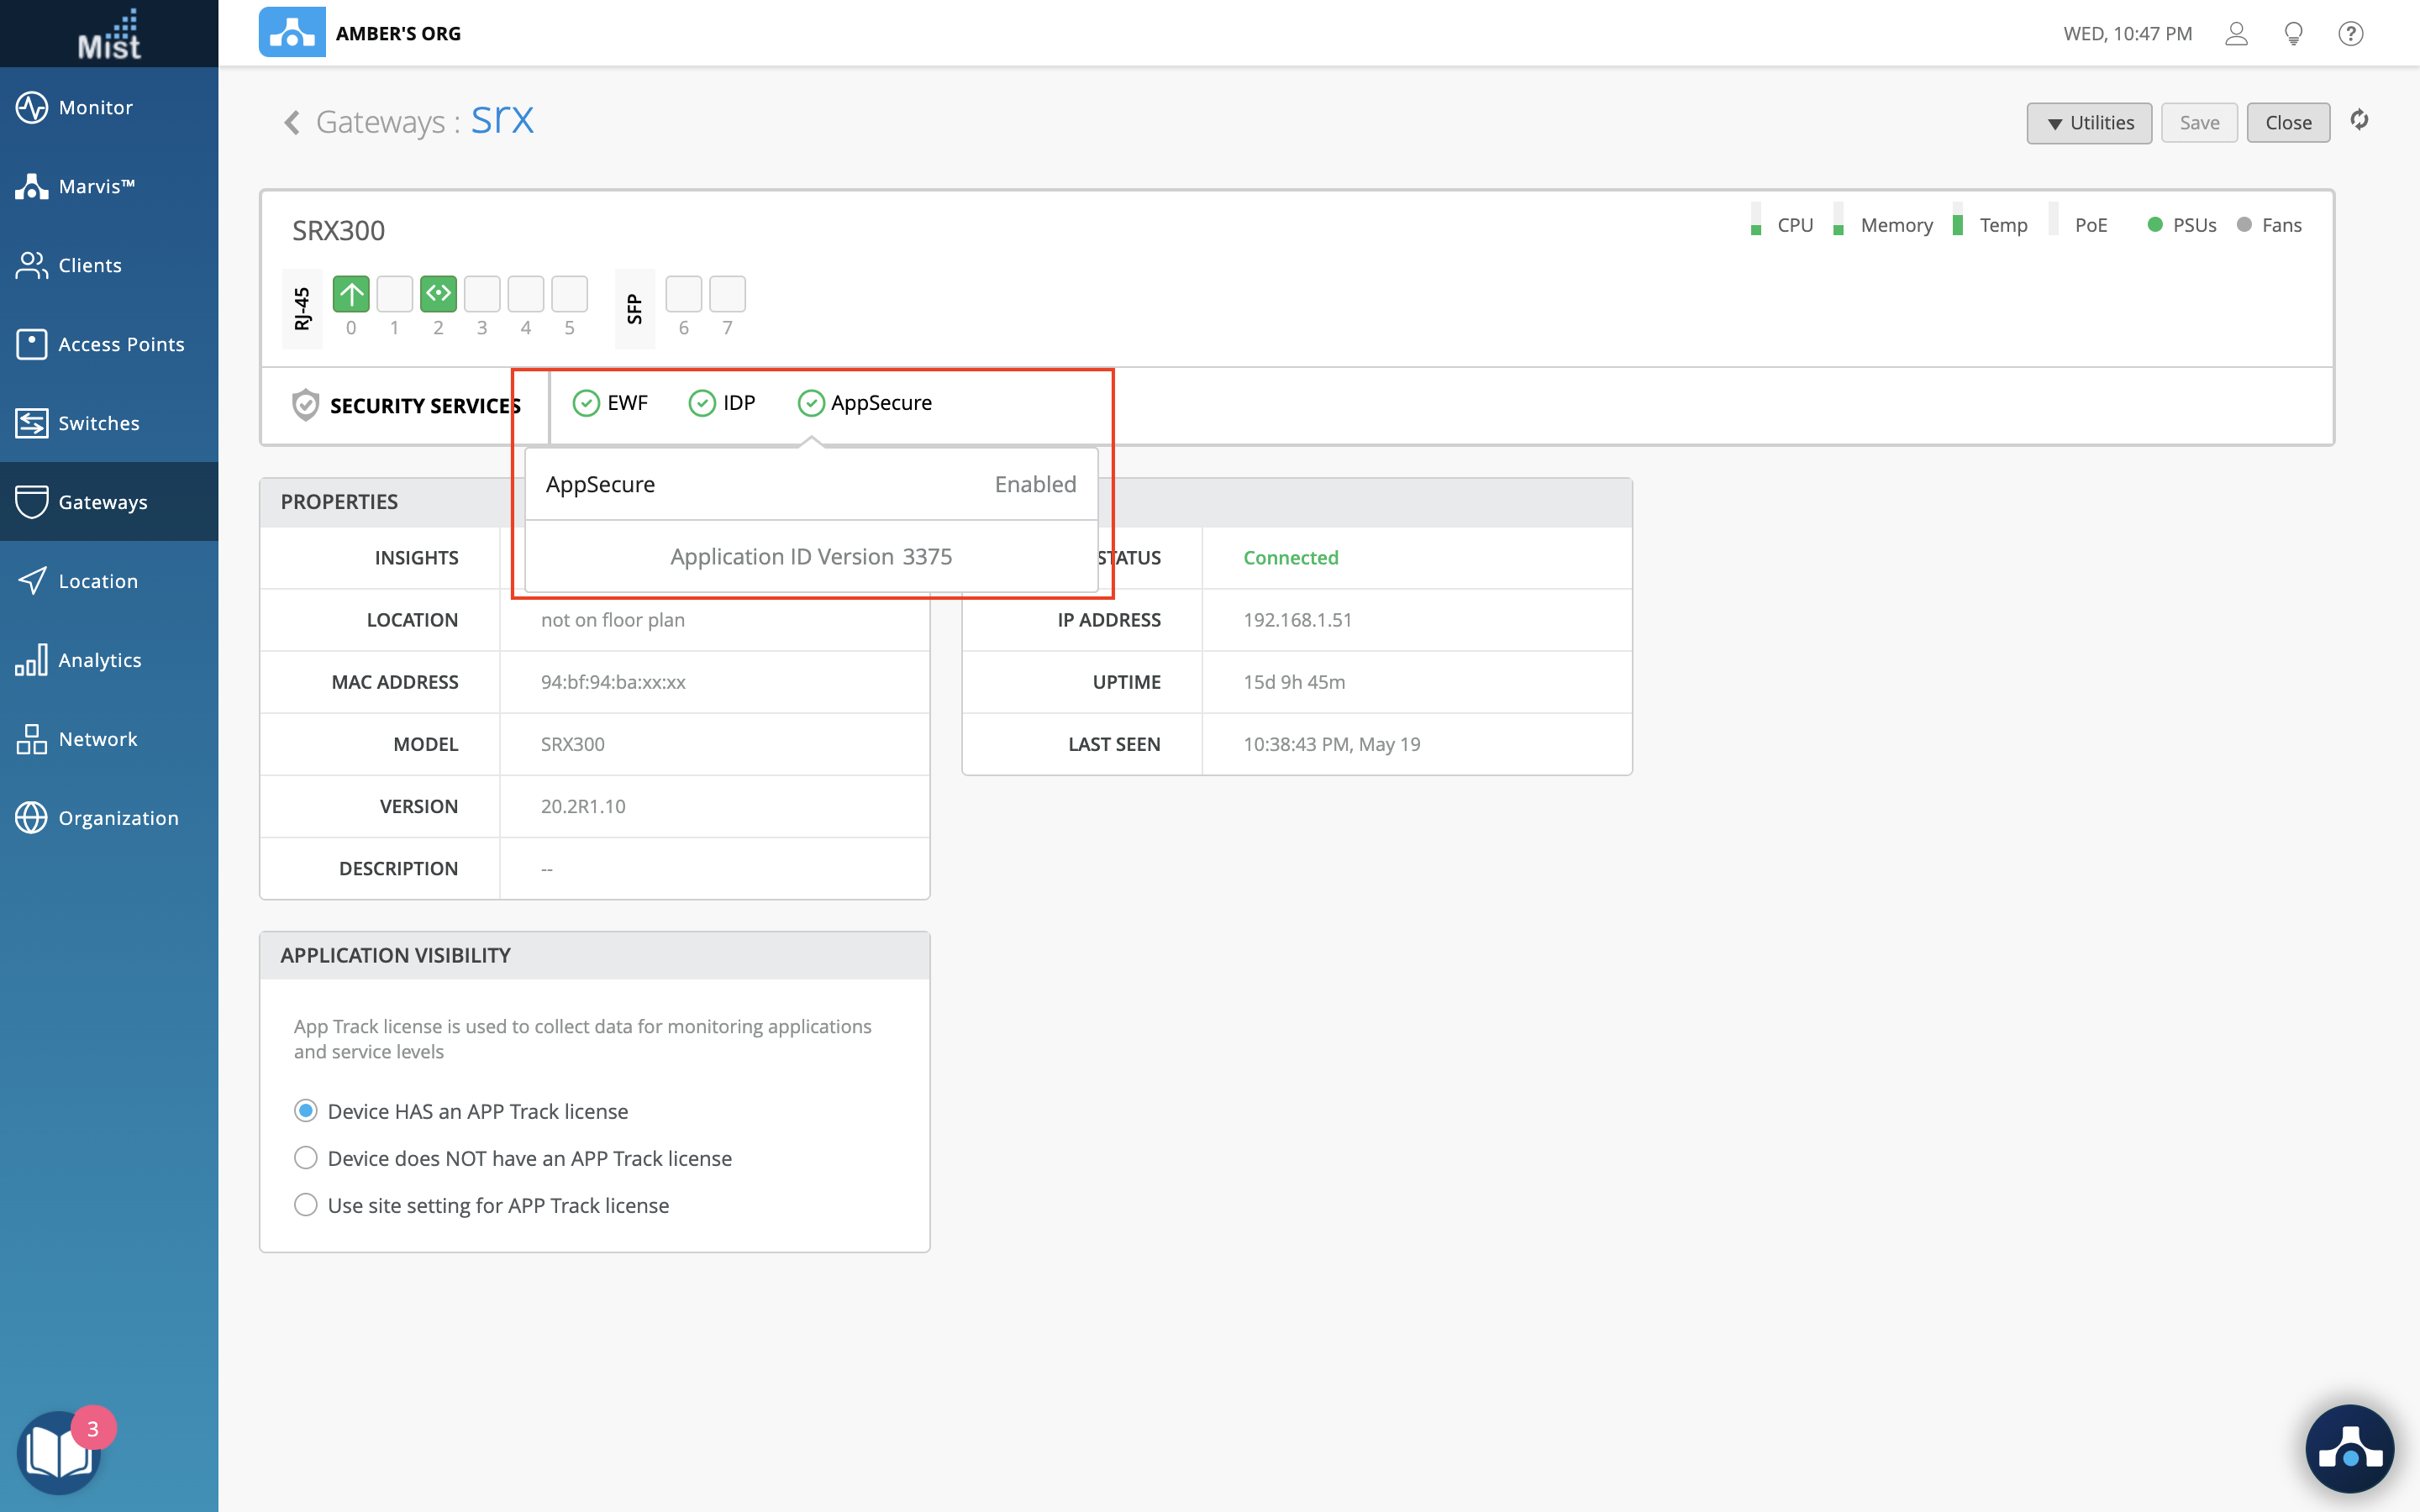
SRX Services Status
To provide better visibility for your SRX Gateways, we have added Service Status indicators for EWF, EDP, and AppSecure. This allows you to quickly glance and see if the licenses needed are present, and the status of each of these services. You can find the service status indicators on your Gateways page right underneath the port configuration table:
Feature Deprecation
This is a reminder for the Feature Deprecation of Location Analytics and Reports. As mentioned in previous release notes, on 6/30 the Location Analytics and Reports APIs will be deprecated and will no longer be accessible. Please see the section What APIs are getting removed with the deprecation? on this page: https://www.mist.com/documentation/location-analytics-reports-deprecation/ for the exact list of APIs that will be deprecated and which new API you should be using instead. Please continue to migrate over to Engagement & Network Analytics under the Analytics tab to create custom reports.