Customer Engagement
Occupancy Analytics [Alpha]
We are very excited to announce the new Occupancy Analytics page this week! Using the zones you set up in Location Live View, you can now set a limit for the number of clients allowed in each area on your map. Use this analytics page to see which areas in your site get overcrowded and enforce capacity limits for each of your Zones. This may be helpful for locations where there are restrictions on the maximum capacity. You may also use this to help with adhering to social distancing protocols within your site and have a better visual for proximity tracing efforts.
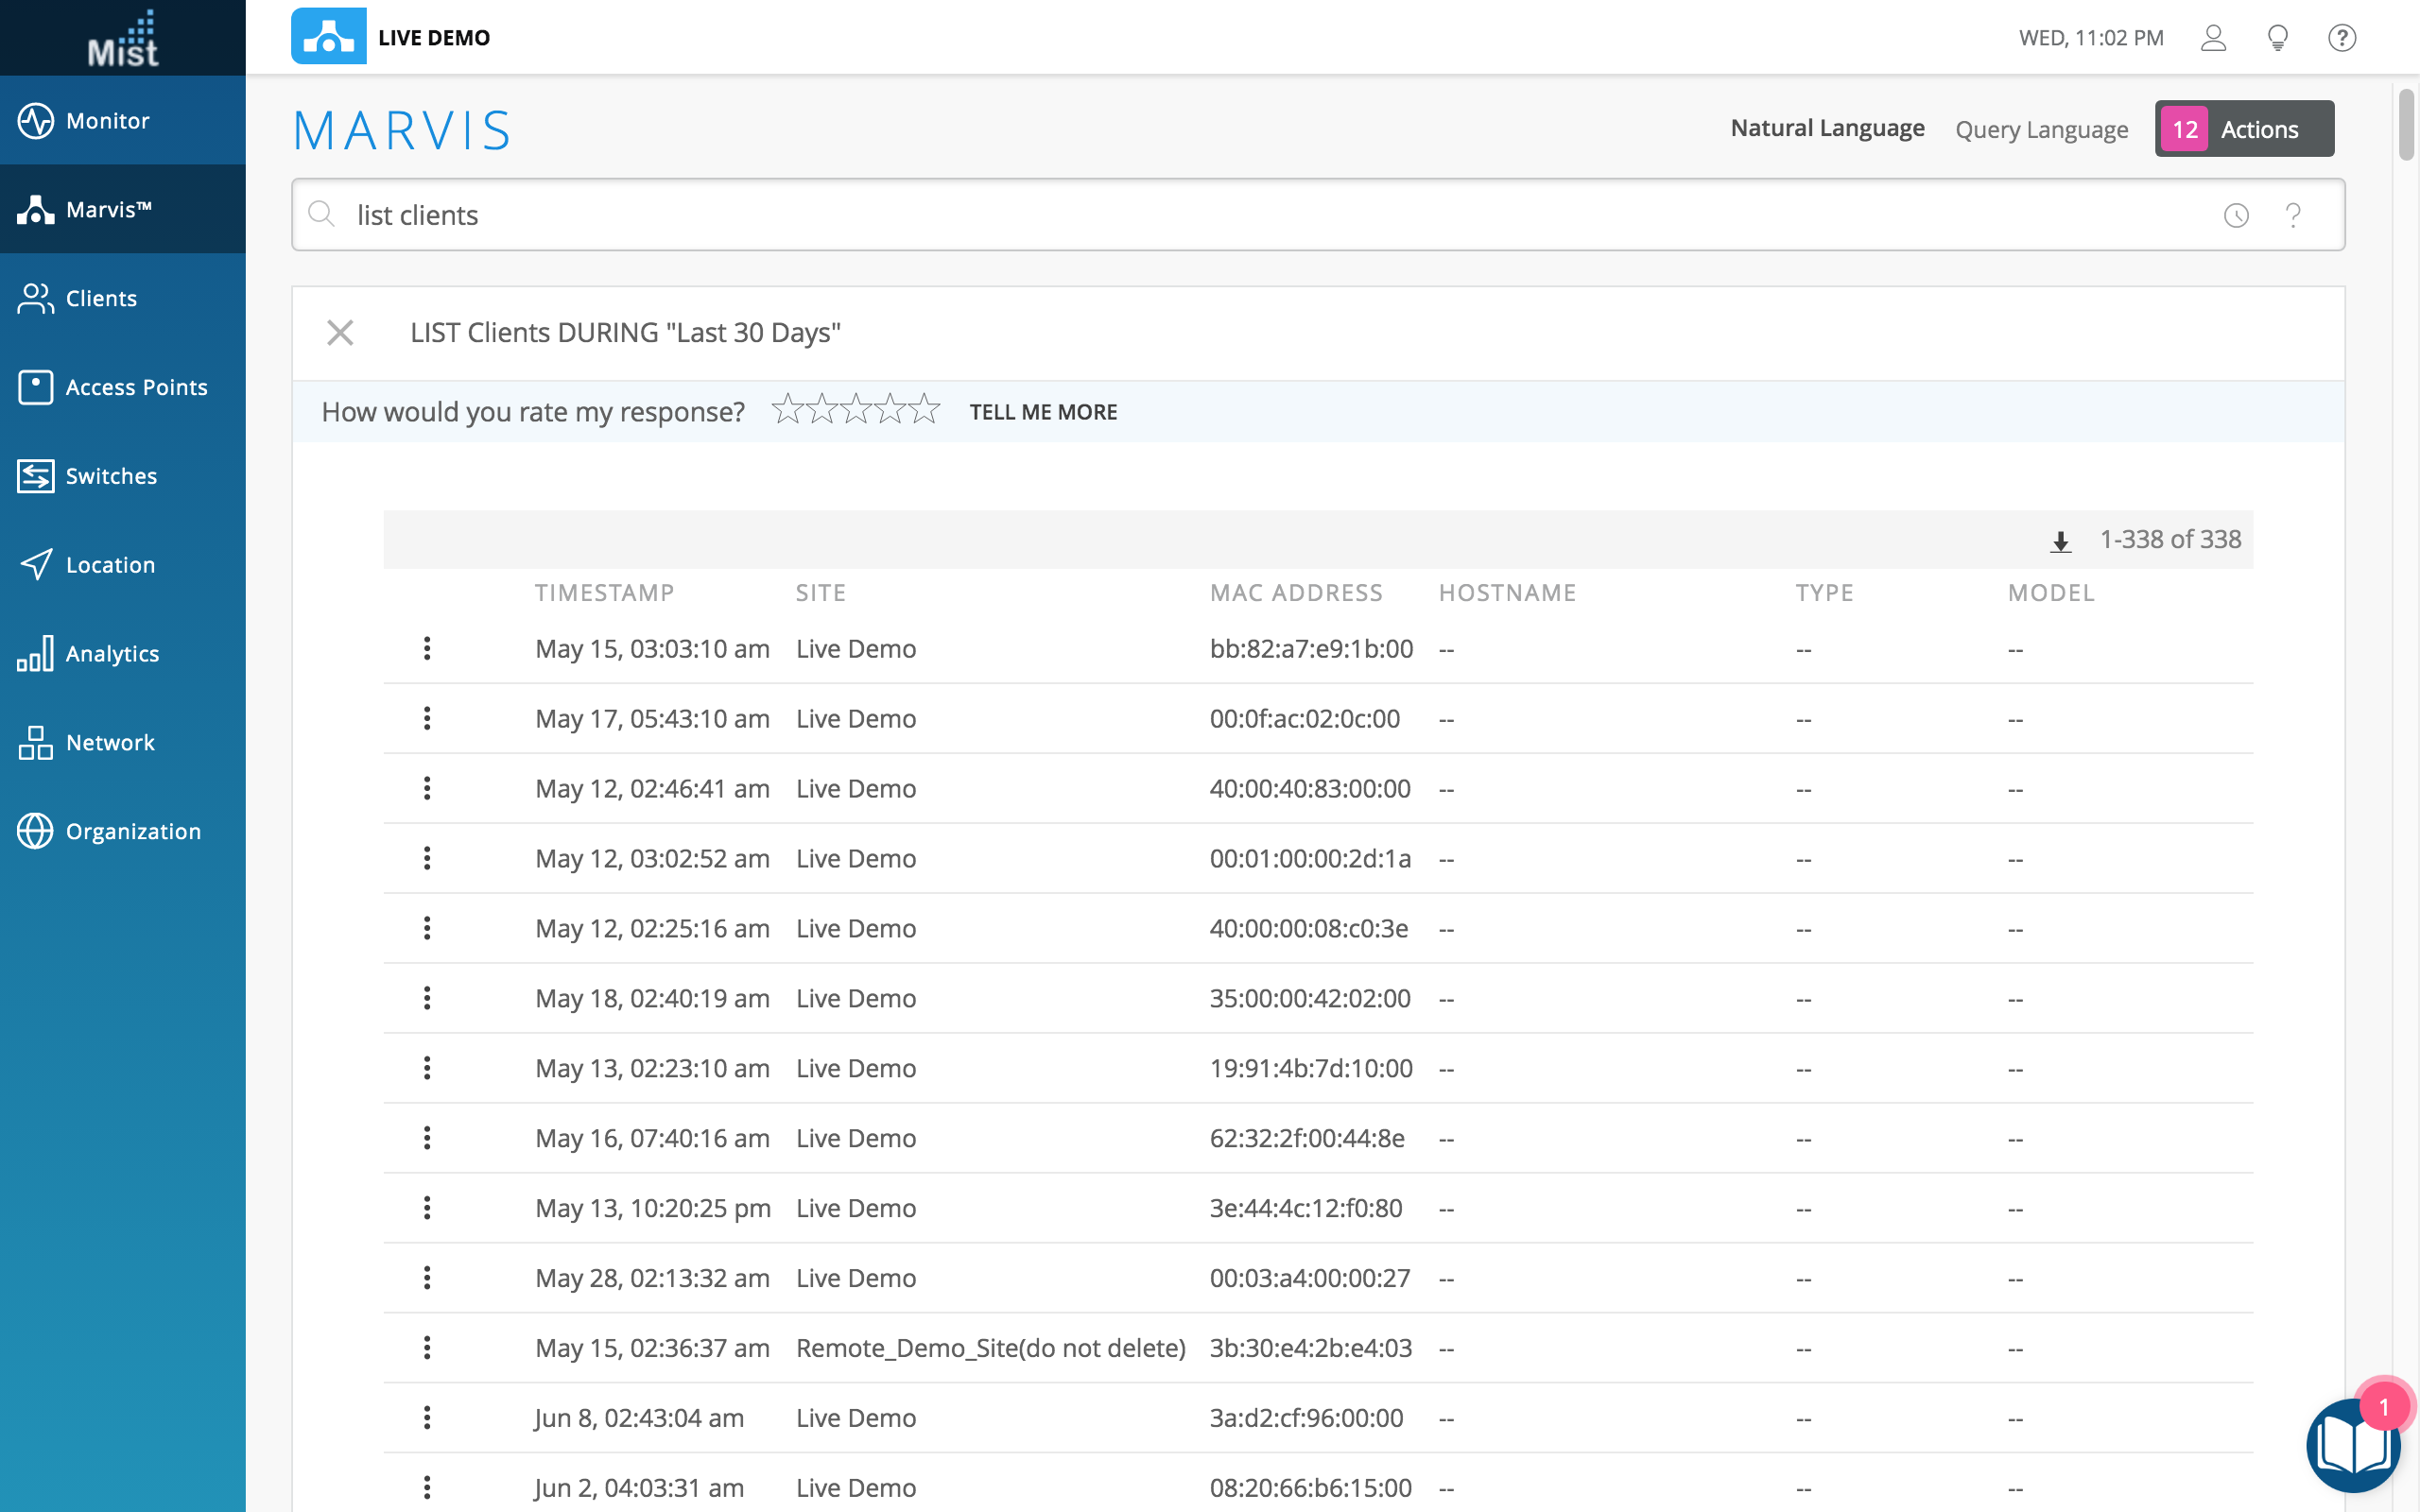
To get started, make sure you have zones set up in the Location Live View page. To see more details on how to set up zones in your site map, please visit this documentation page: https://www.mist.com/documentation/zones/
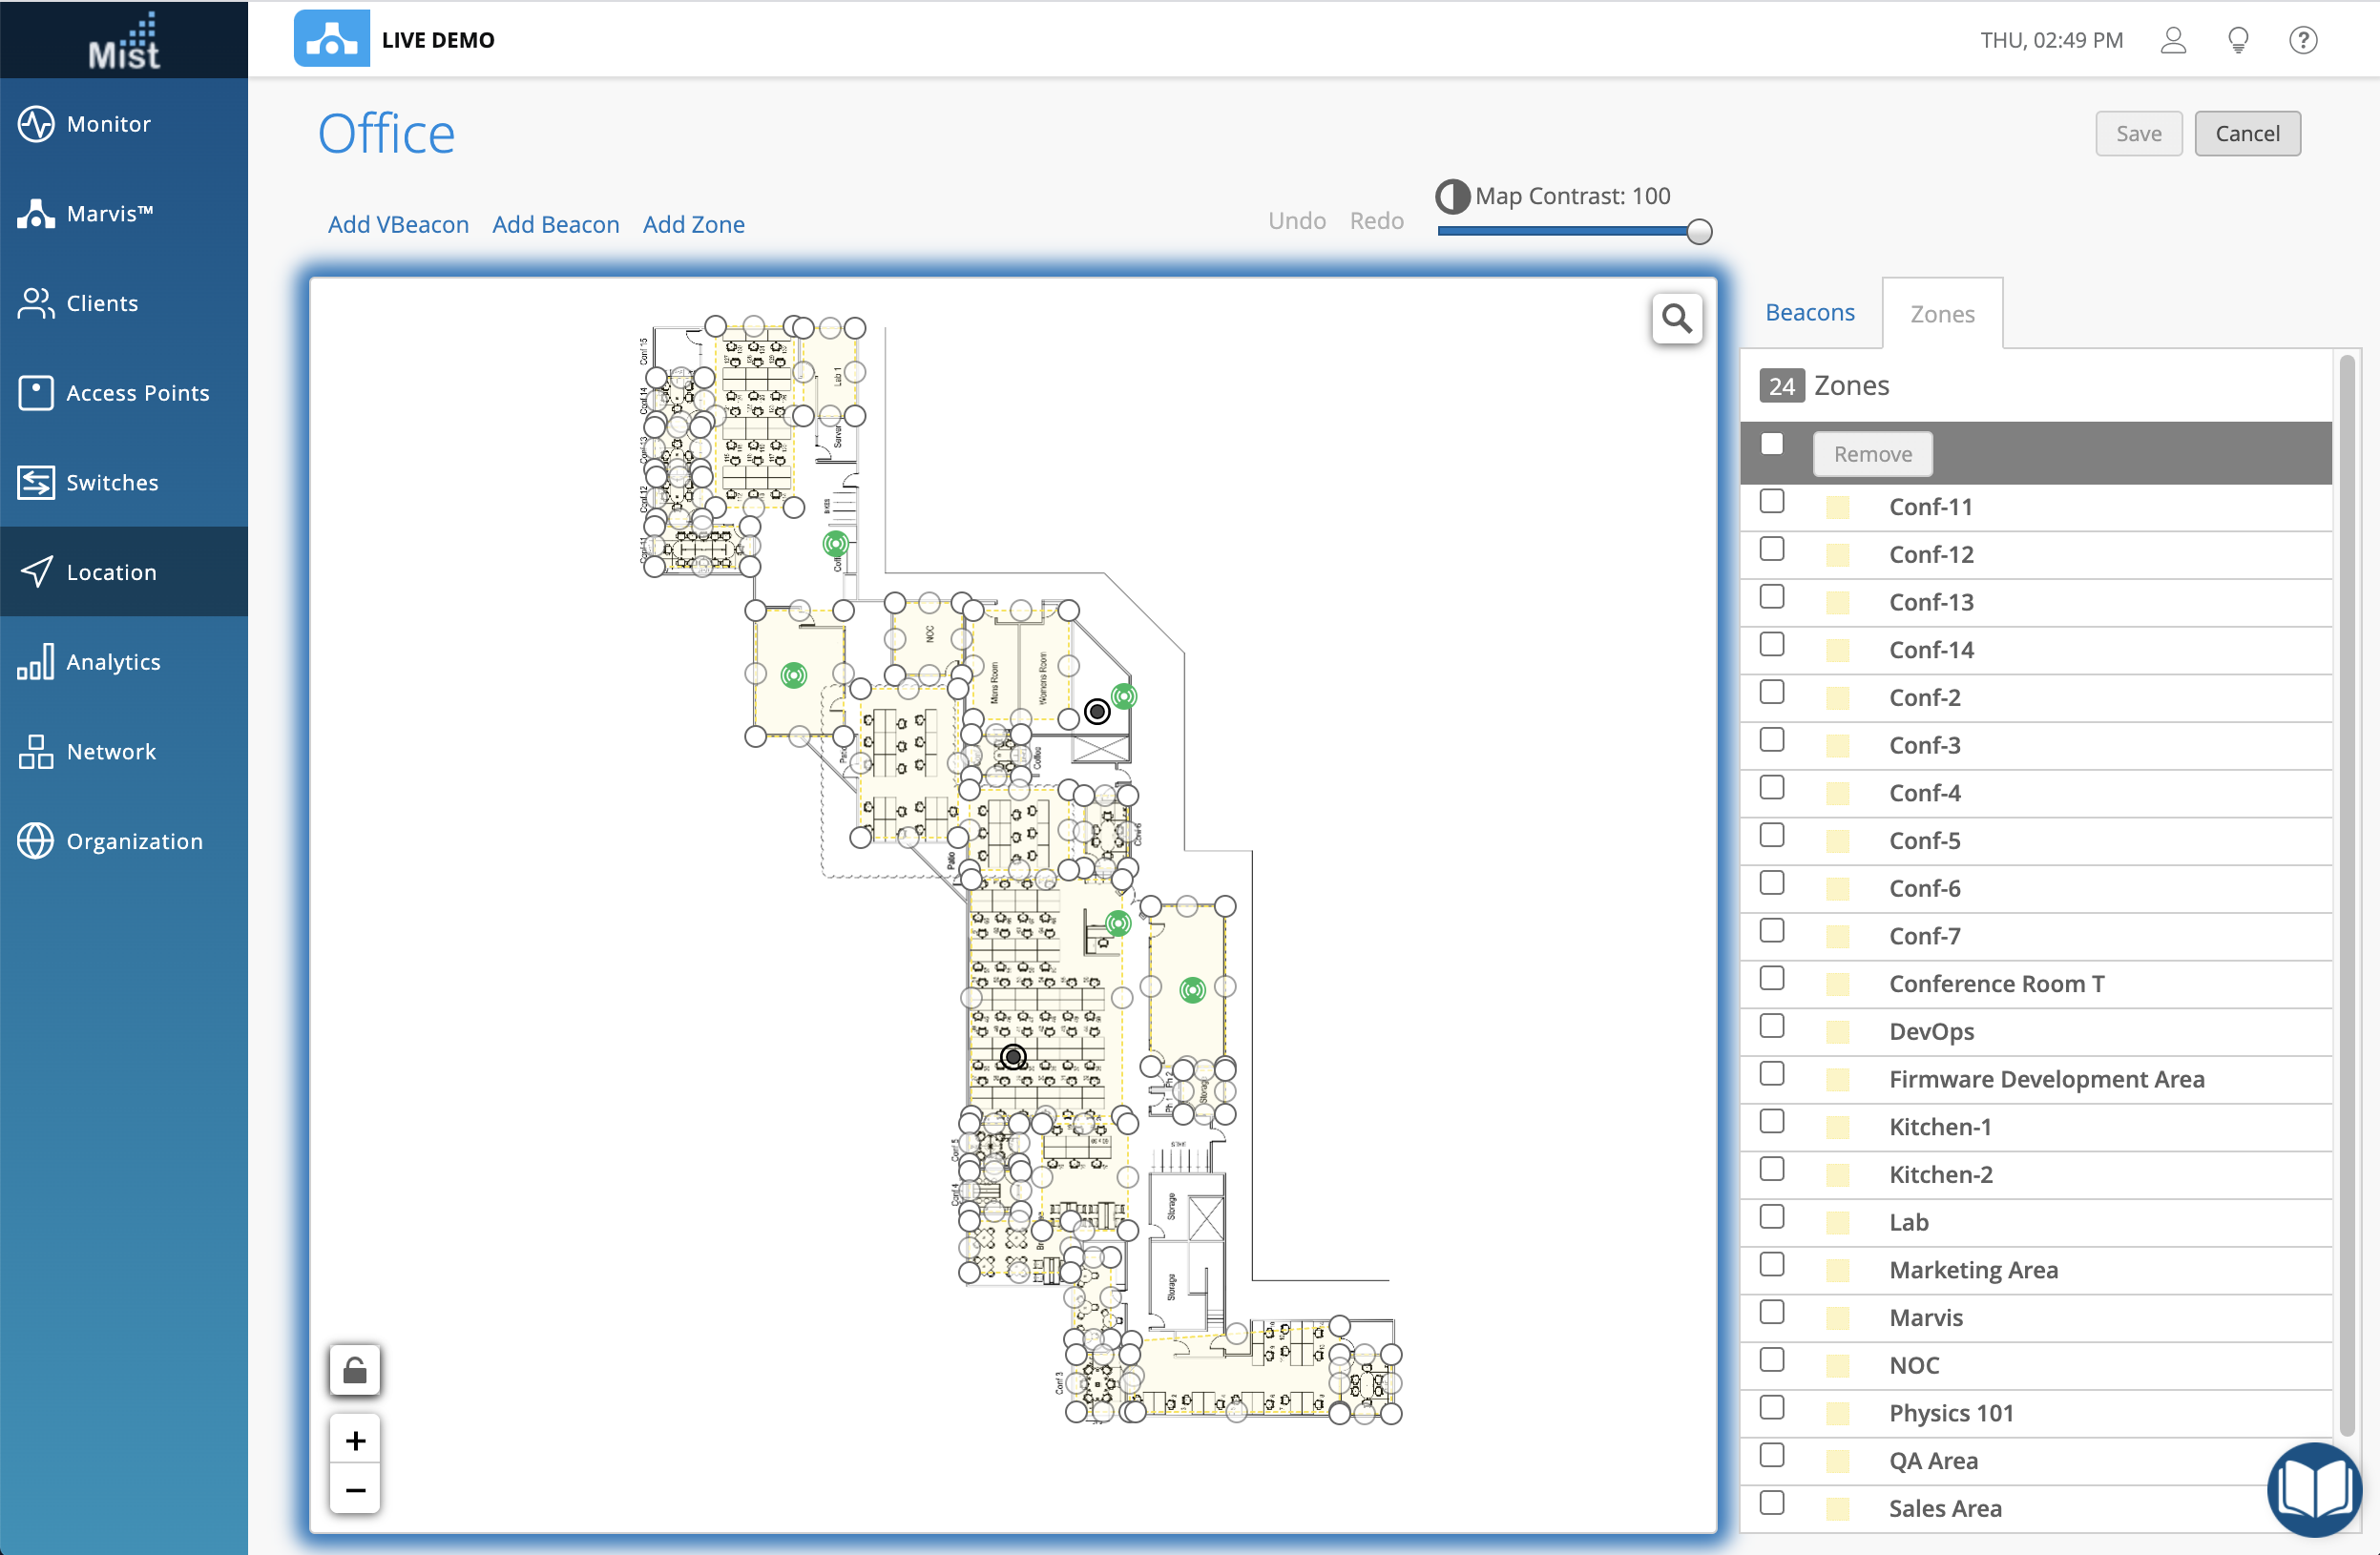
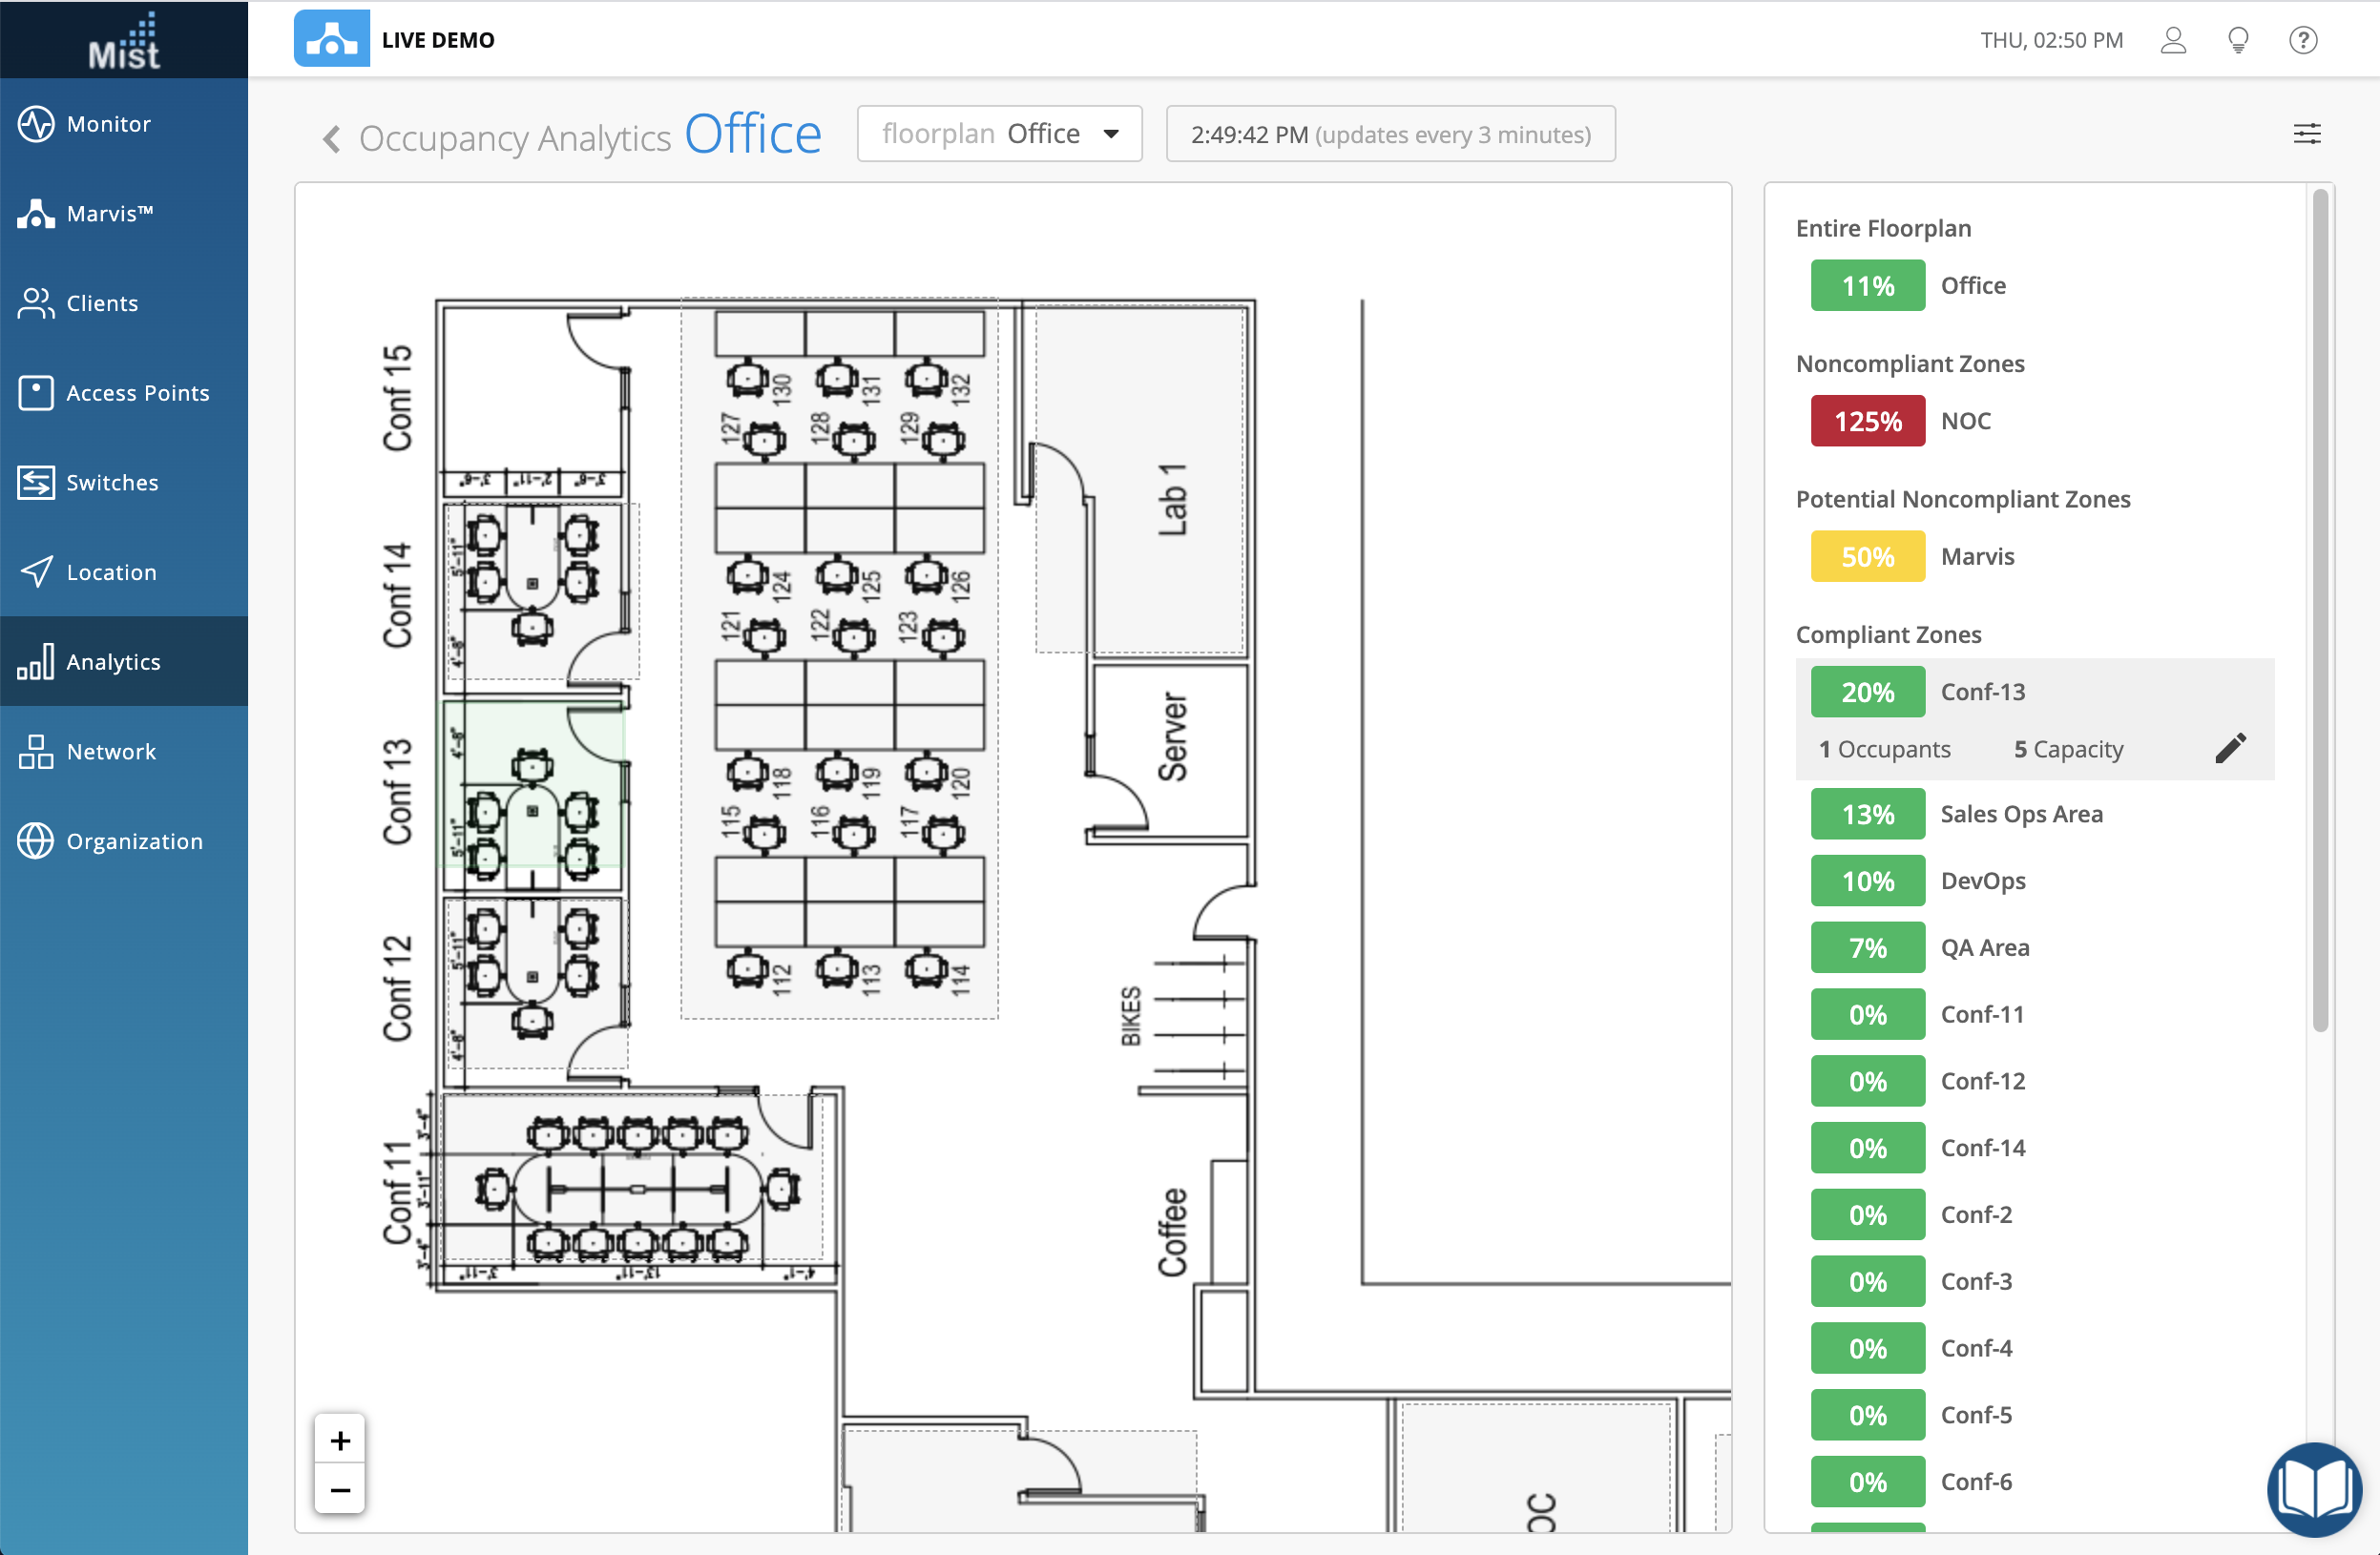
With your zones set up, navigate to Analytics > Occupancy Analytics. Here, you will see a visual of your zones on the floor plan, and the list of zones on the right column.
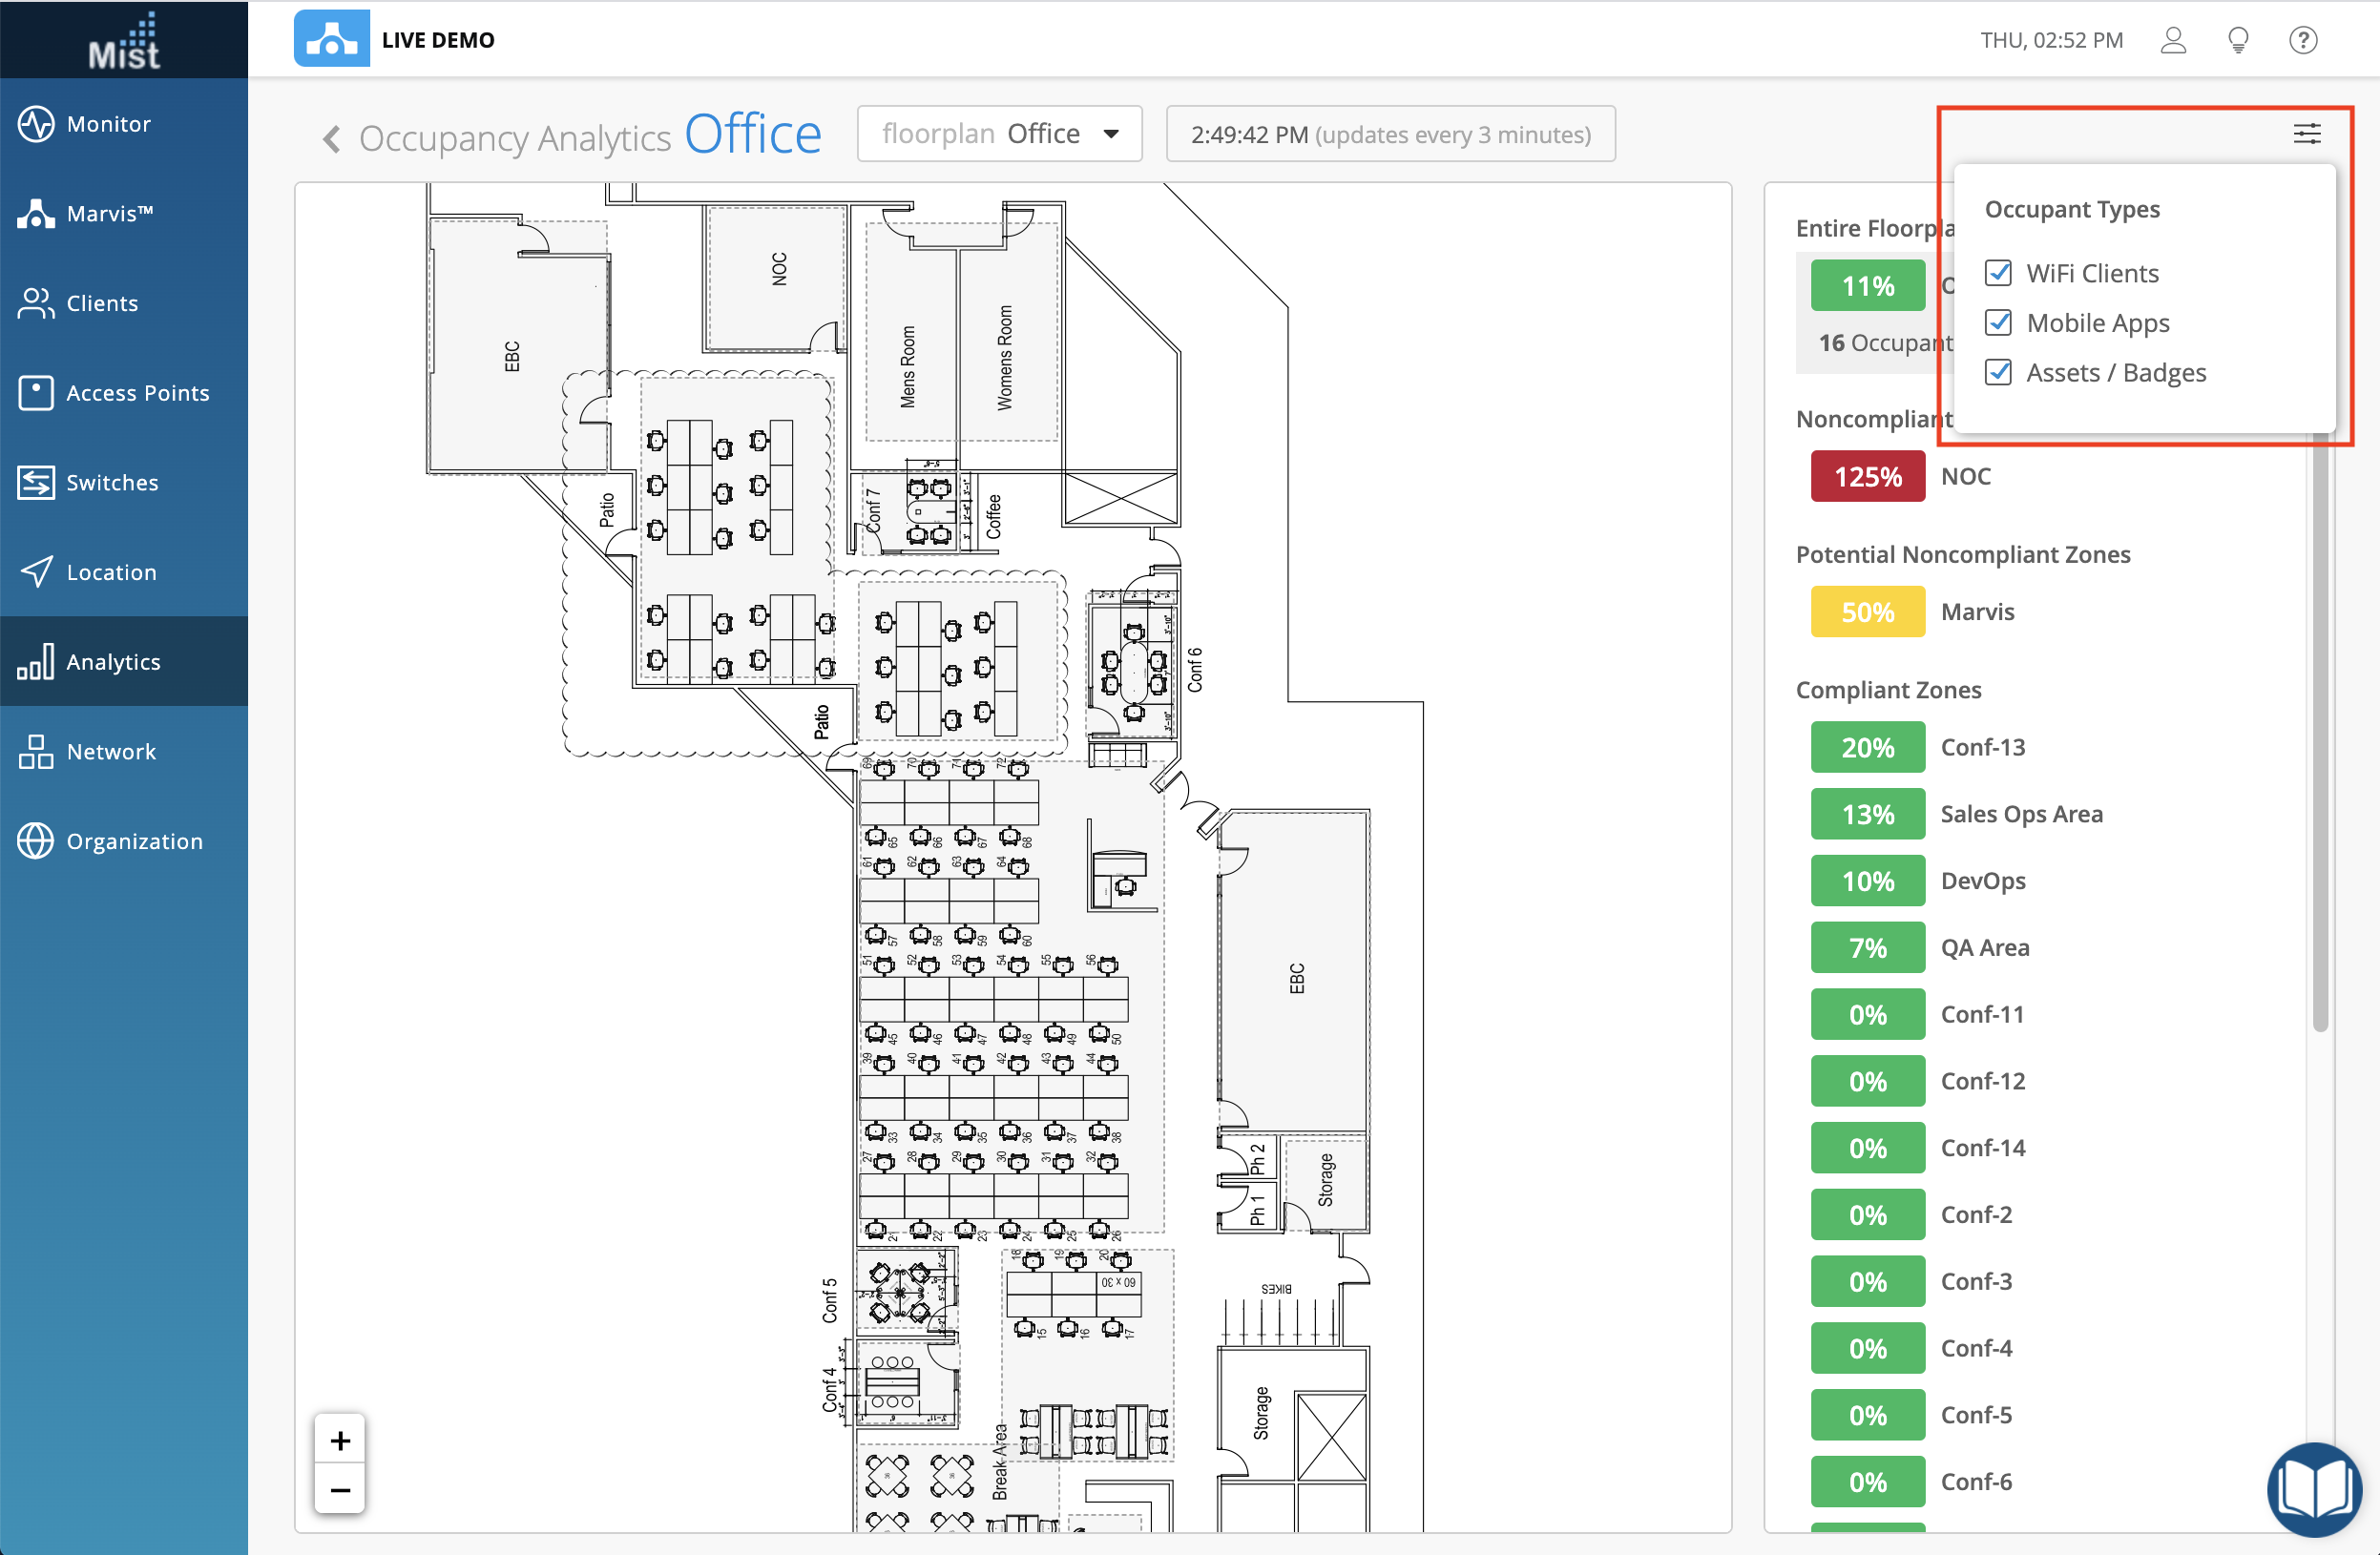
In the hamburger menu, specify the types of clients you wish to include in the occupancy count of each zone. By default all 3 types of clients are counted: WiFi Clients, Mobile Apps, and Assets/Badges.
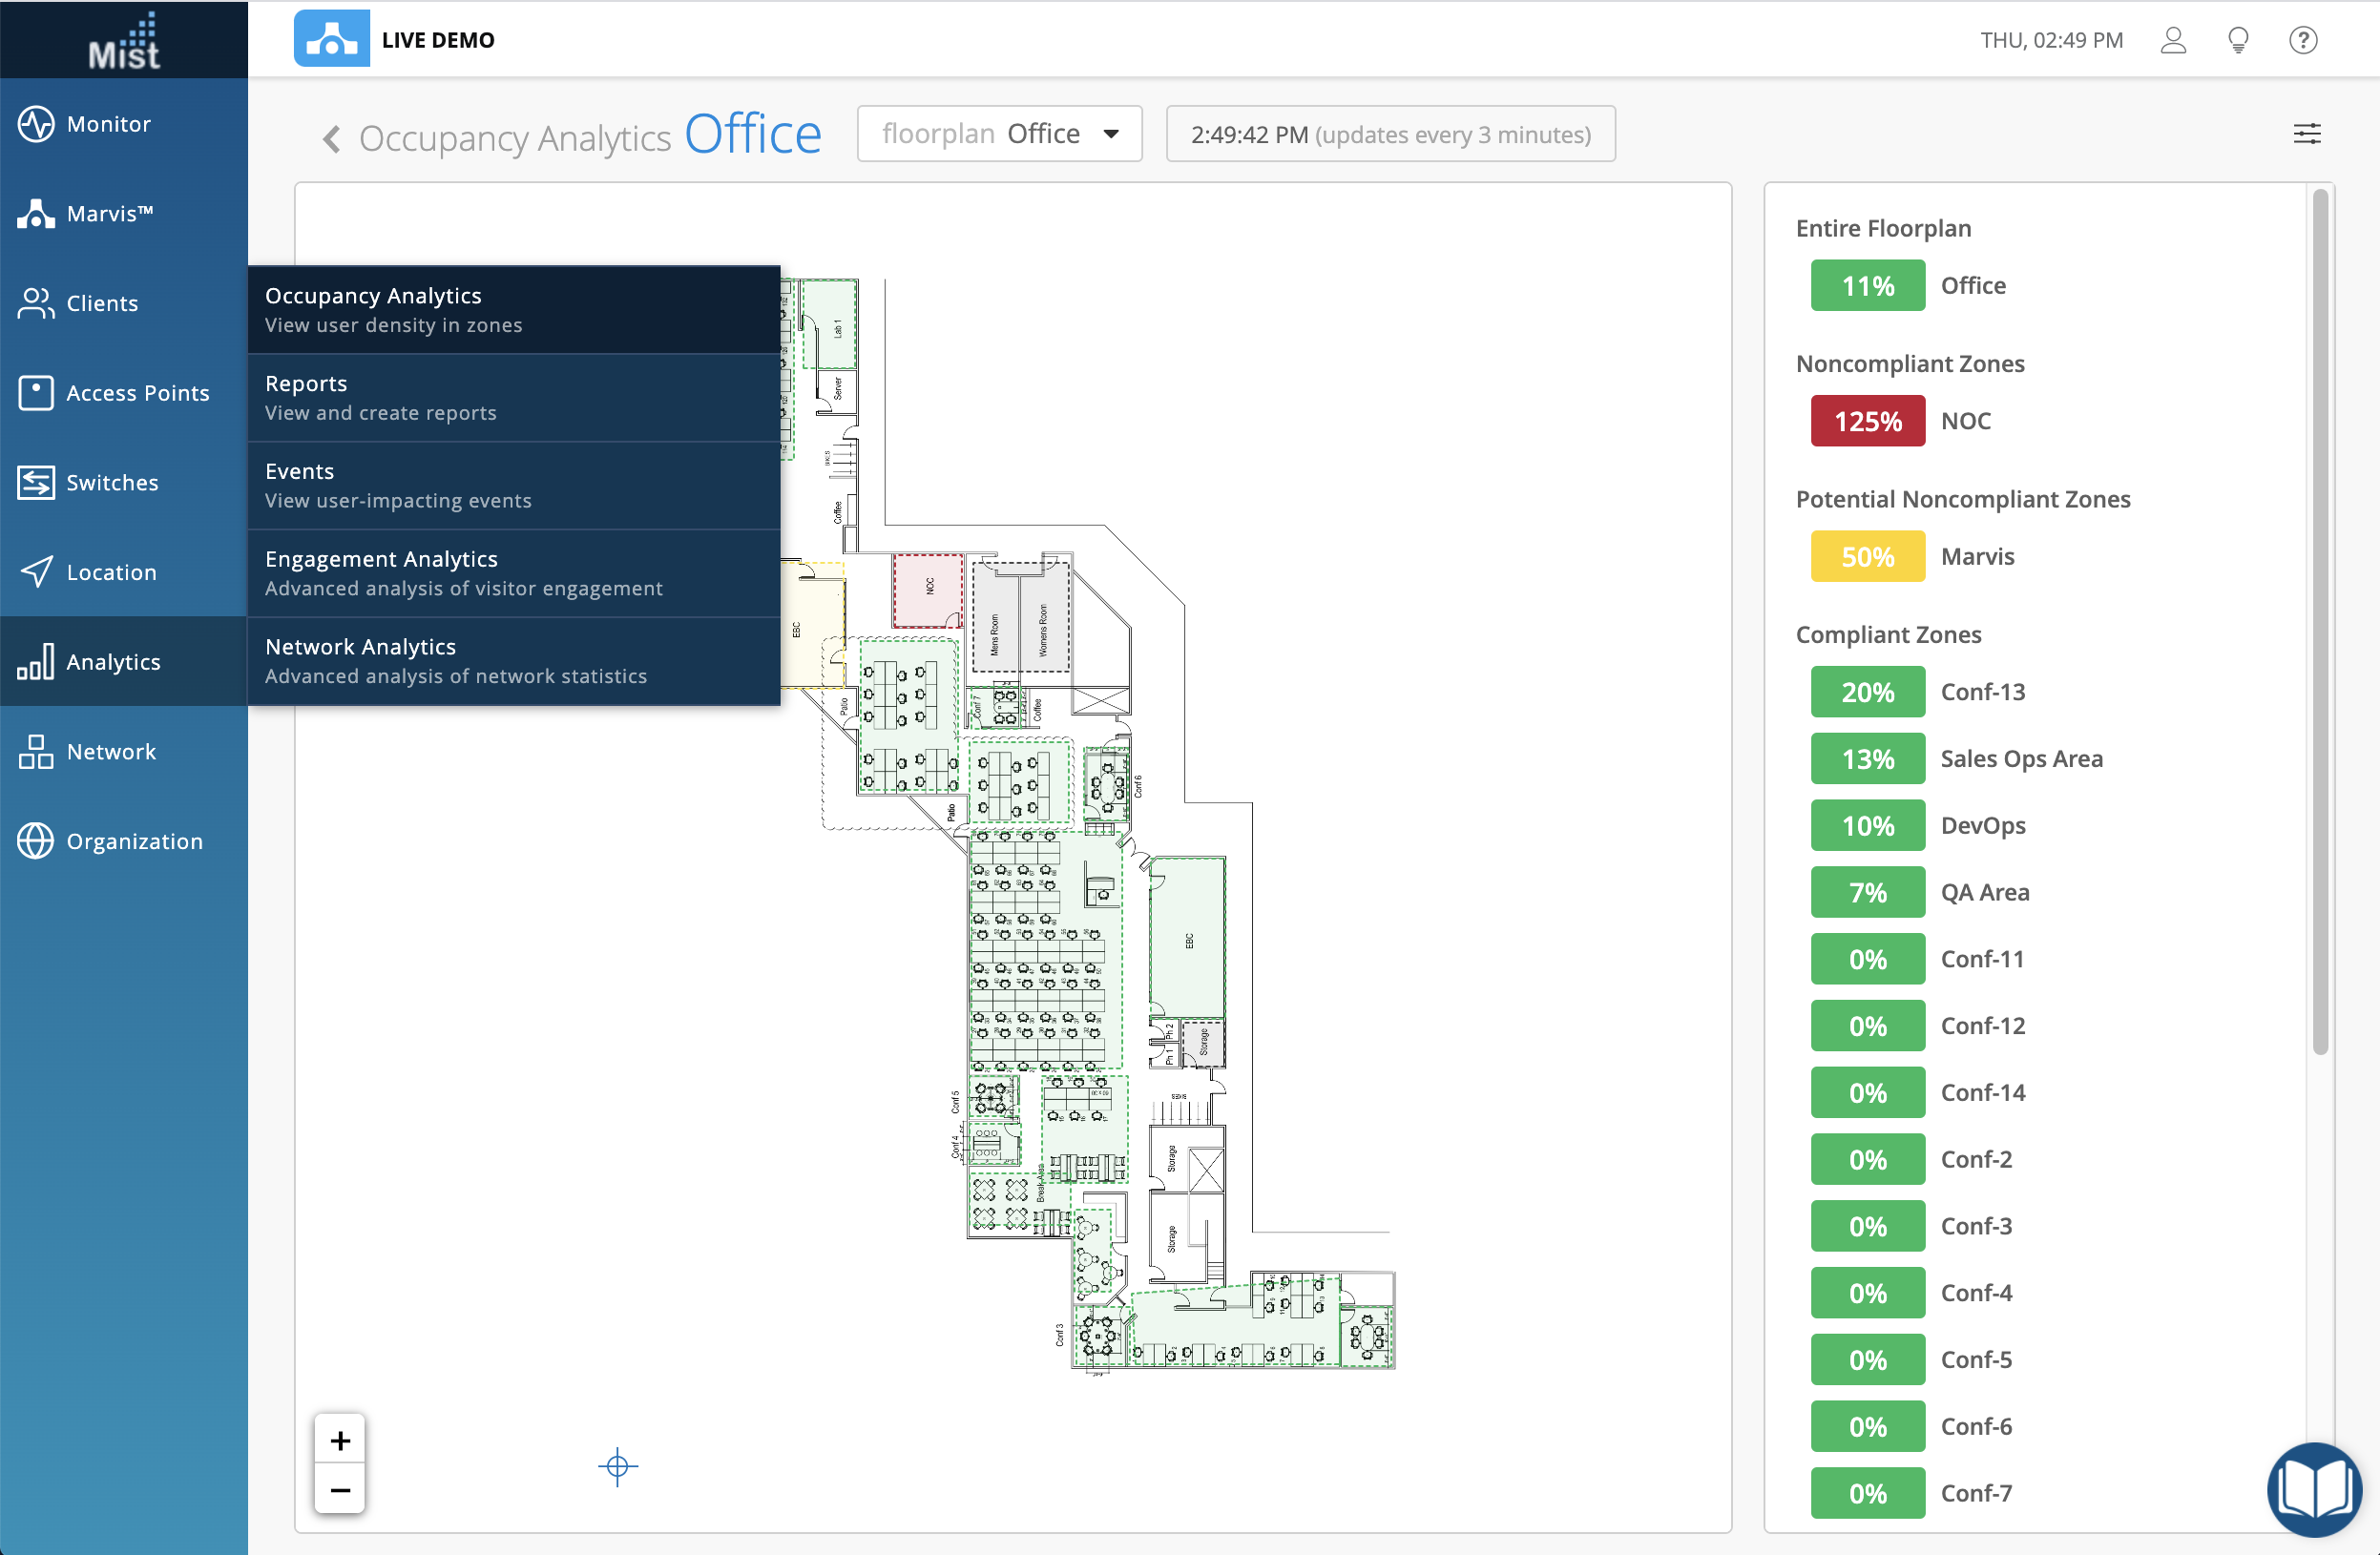
To set capacity limits on your zone, simply select a zone either by clicking on the map or the list. Here, our Conf-13 zone has a maximum limit of 5. Currently there is 1 occupant in the zone, so the zone shows 20% full to capacity.
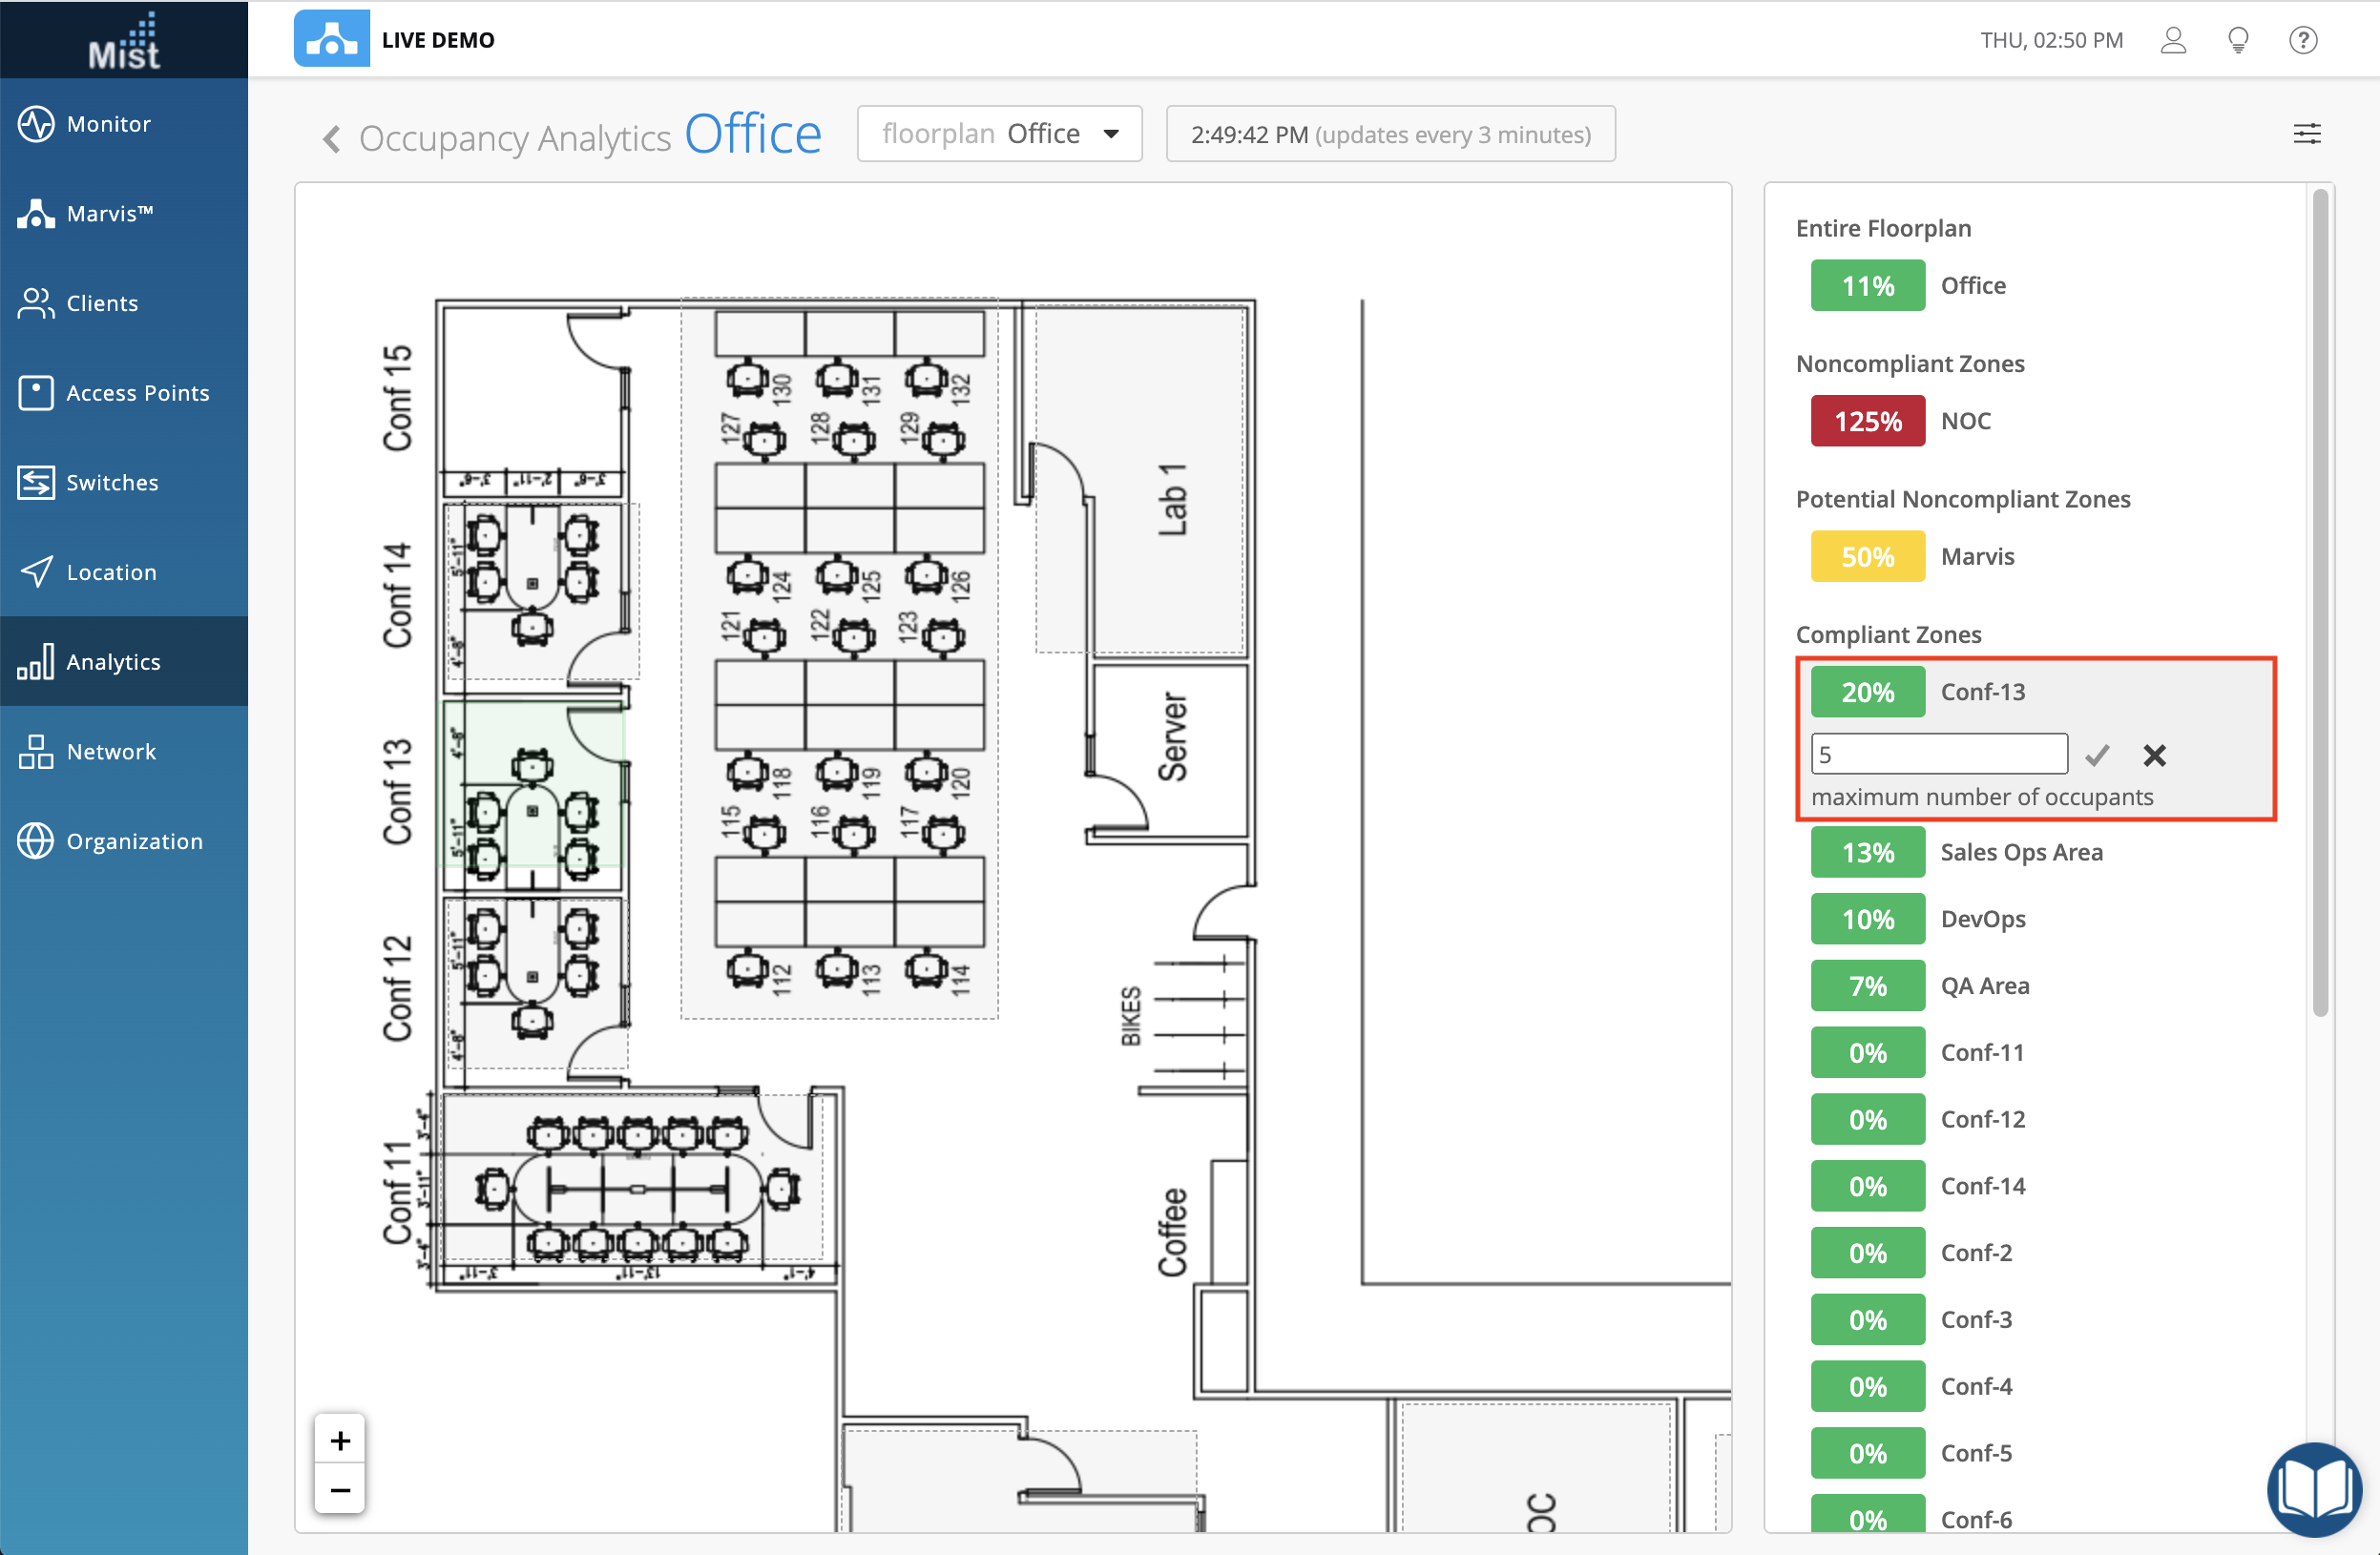
To edit the capacity limit, click on the pencil button to make any changes and select the check mark once finished.
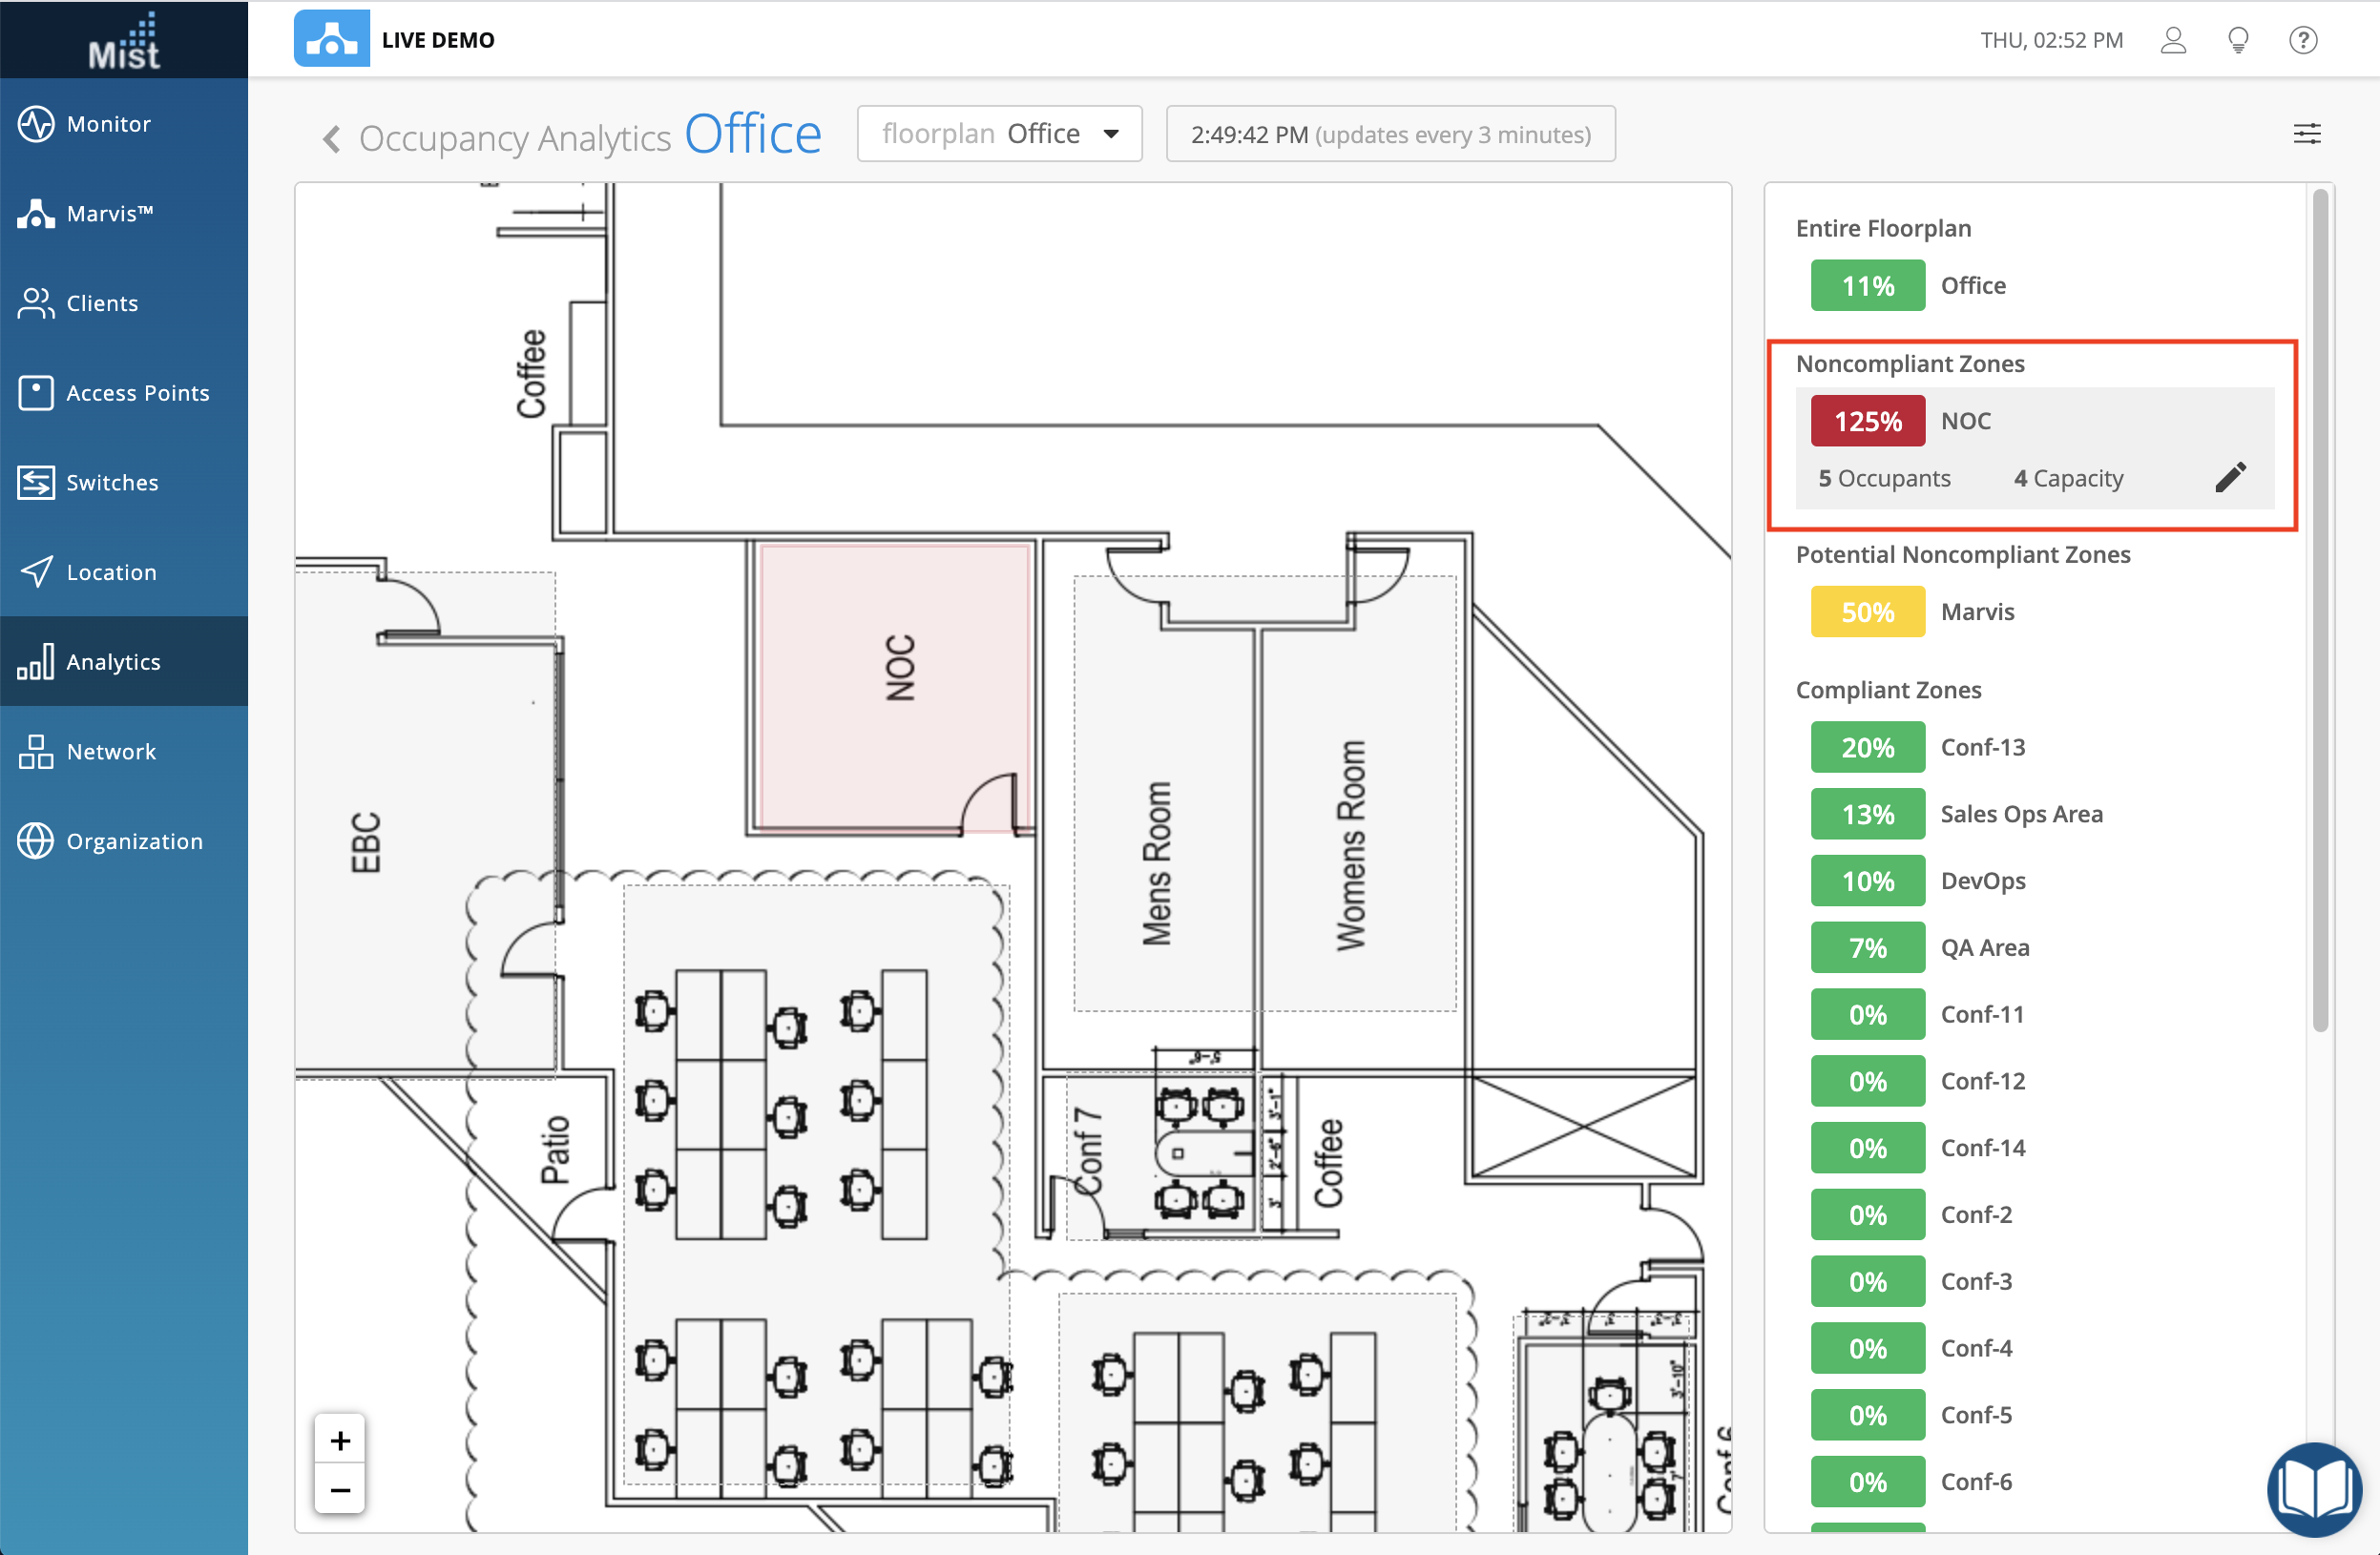
Noncompliant Zones are shown in red. These zones detect an overflow in the number of users and exceeds the capacity limit you set. Our NOC zone has 1 more occupant than the allowed maximum.
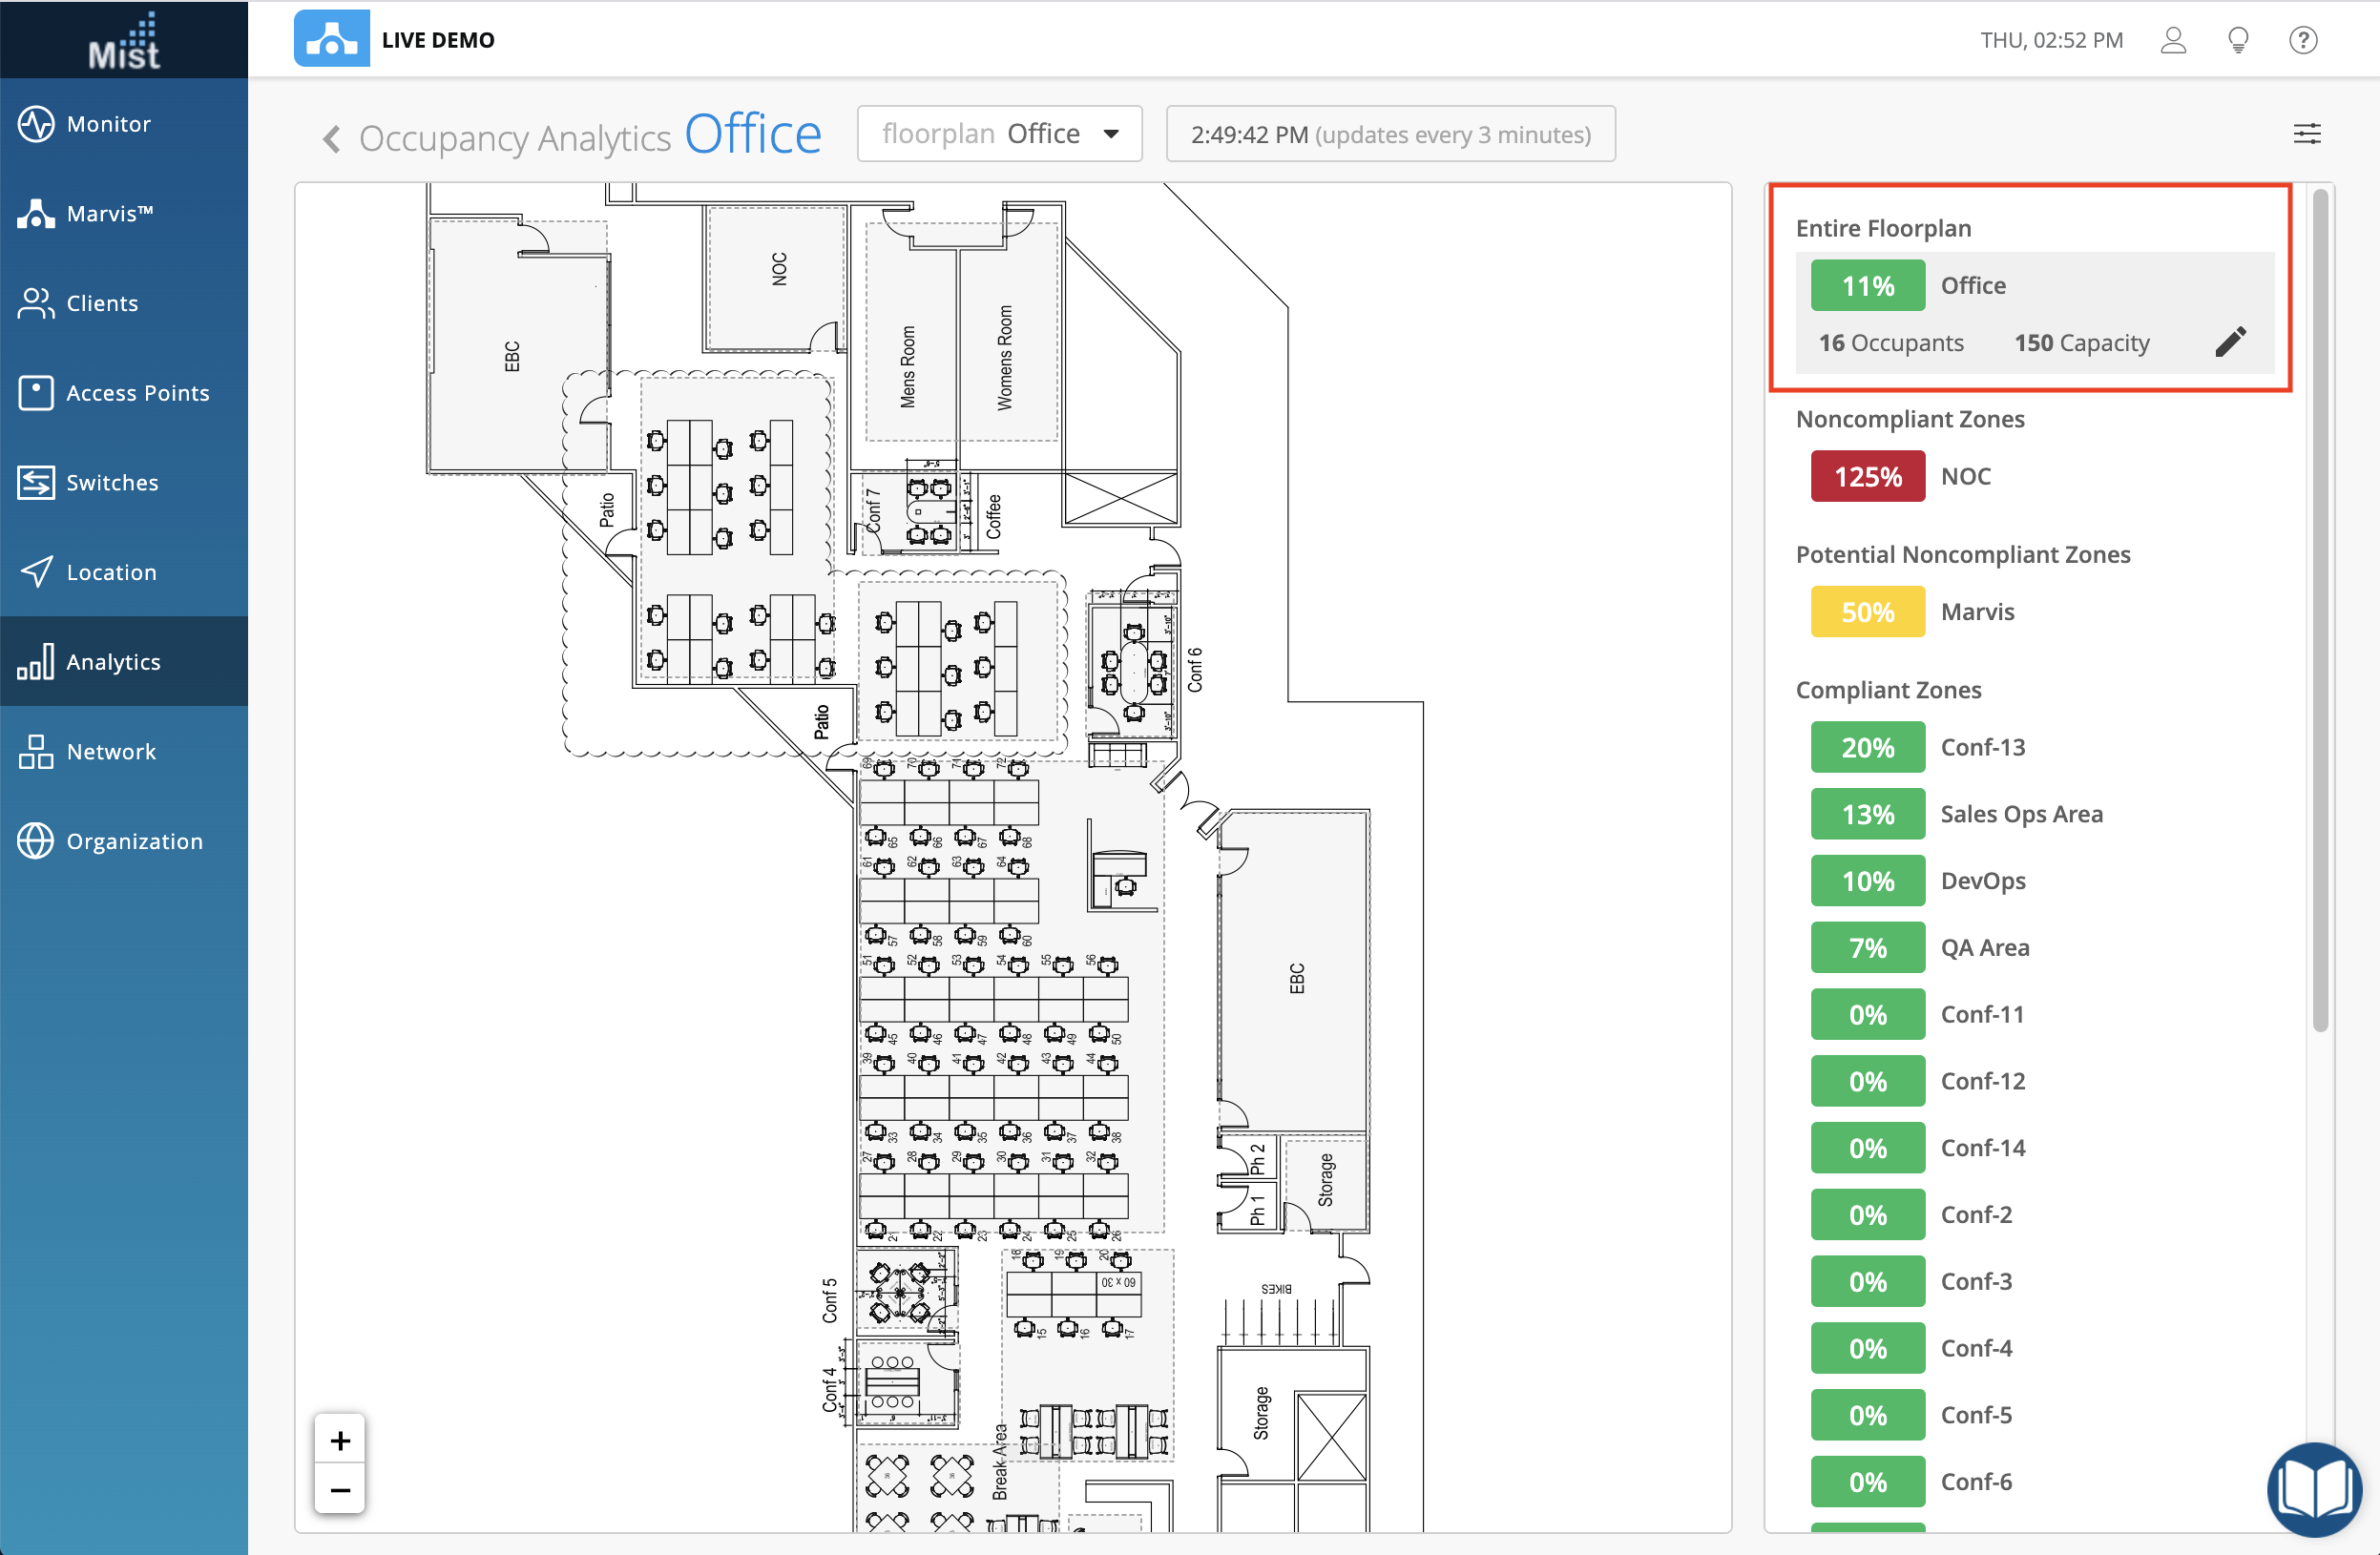
Click the Entire Floorplan to see a general overview of the total number of occupants vs the maximum capacity of all your zones
This page is the beginning of our larger effort to support location based contact tracing solutions for your sites. Currently this is still an alpha feature and is available by request only. If you would like access, please reach out to your sales team and we will be more than happy to help you get set up.
Simplified Operations
AP Photos on the Web Dashboard
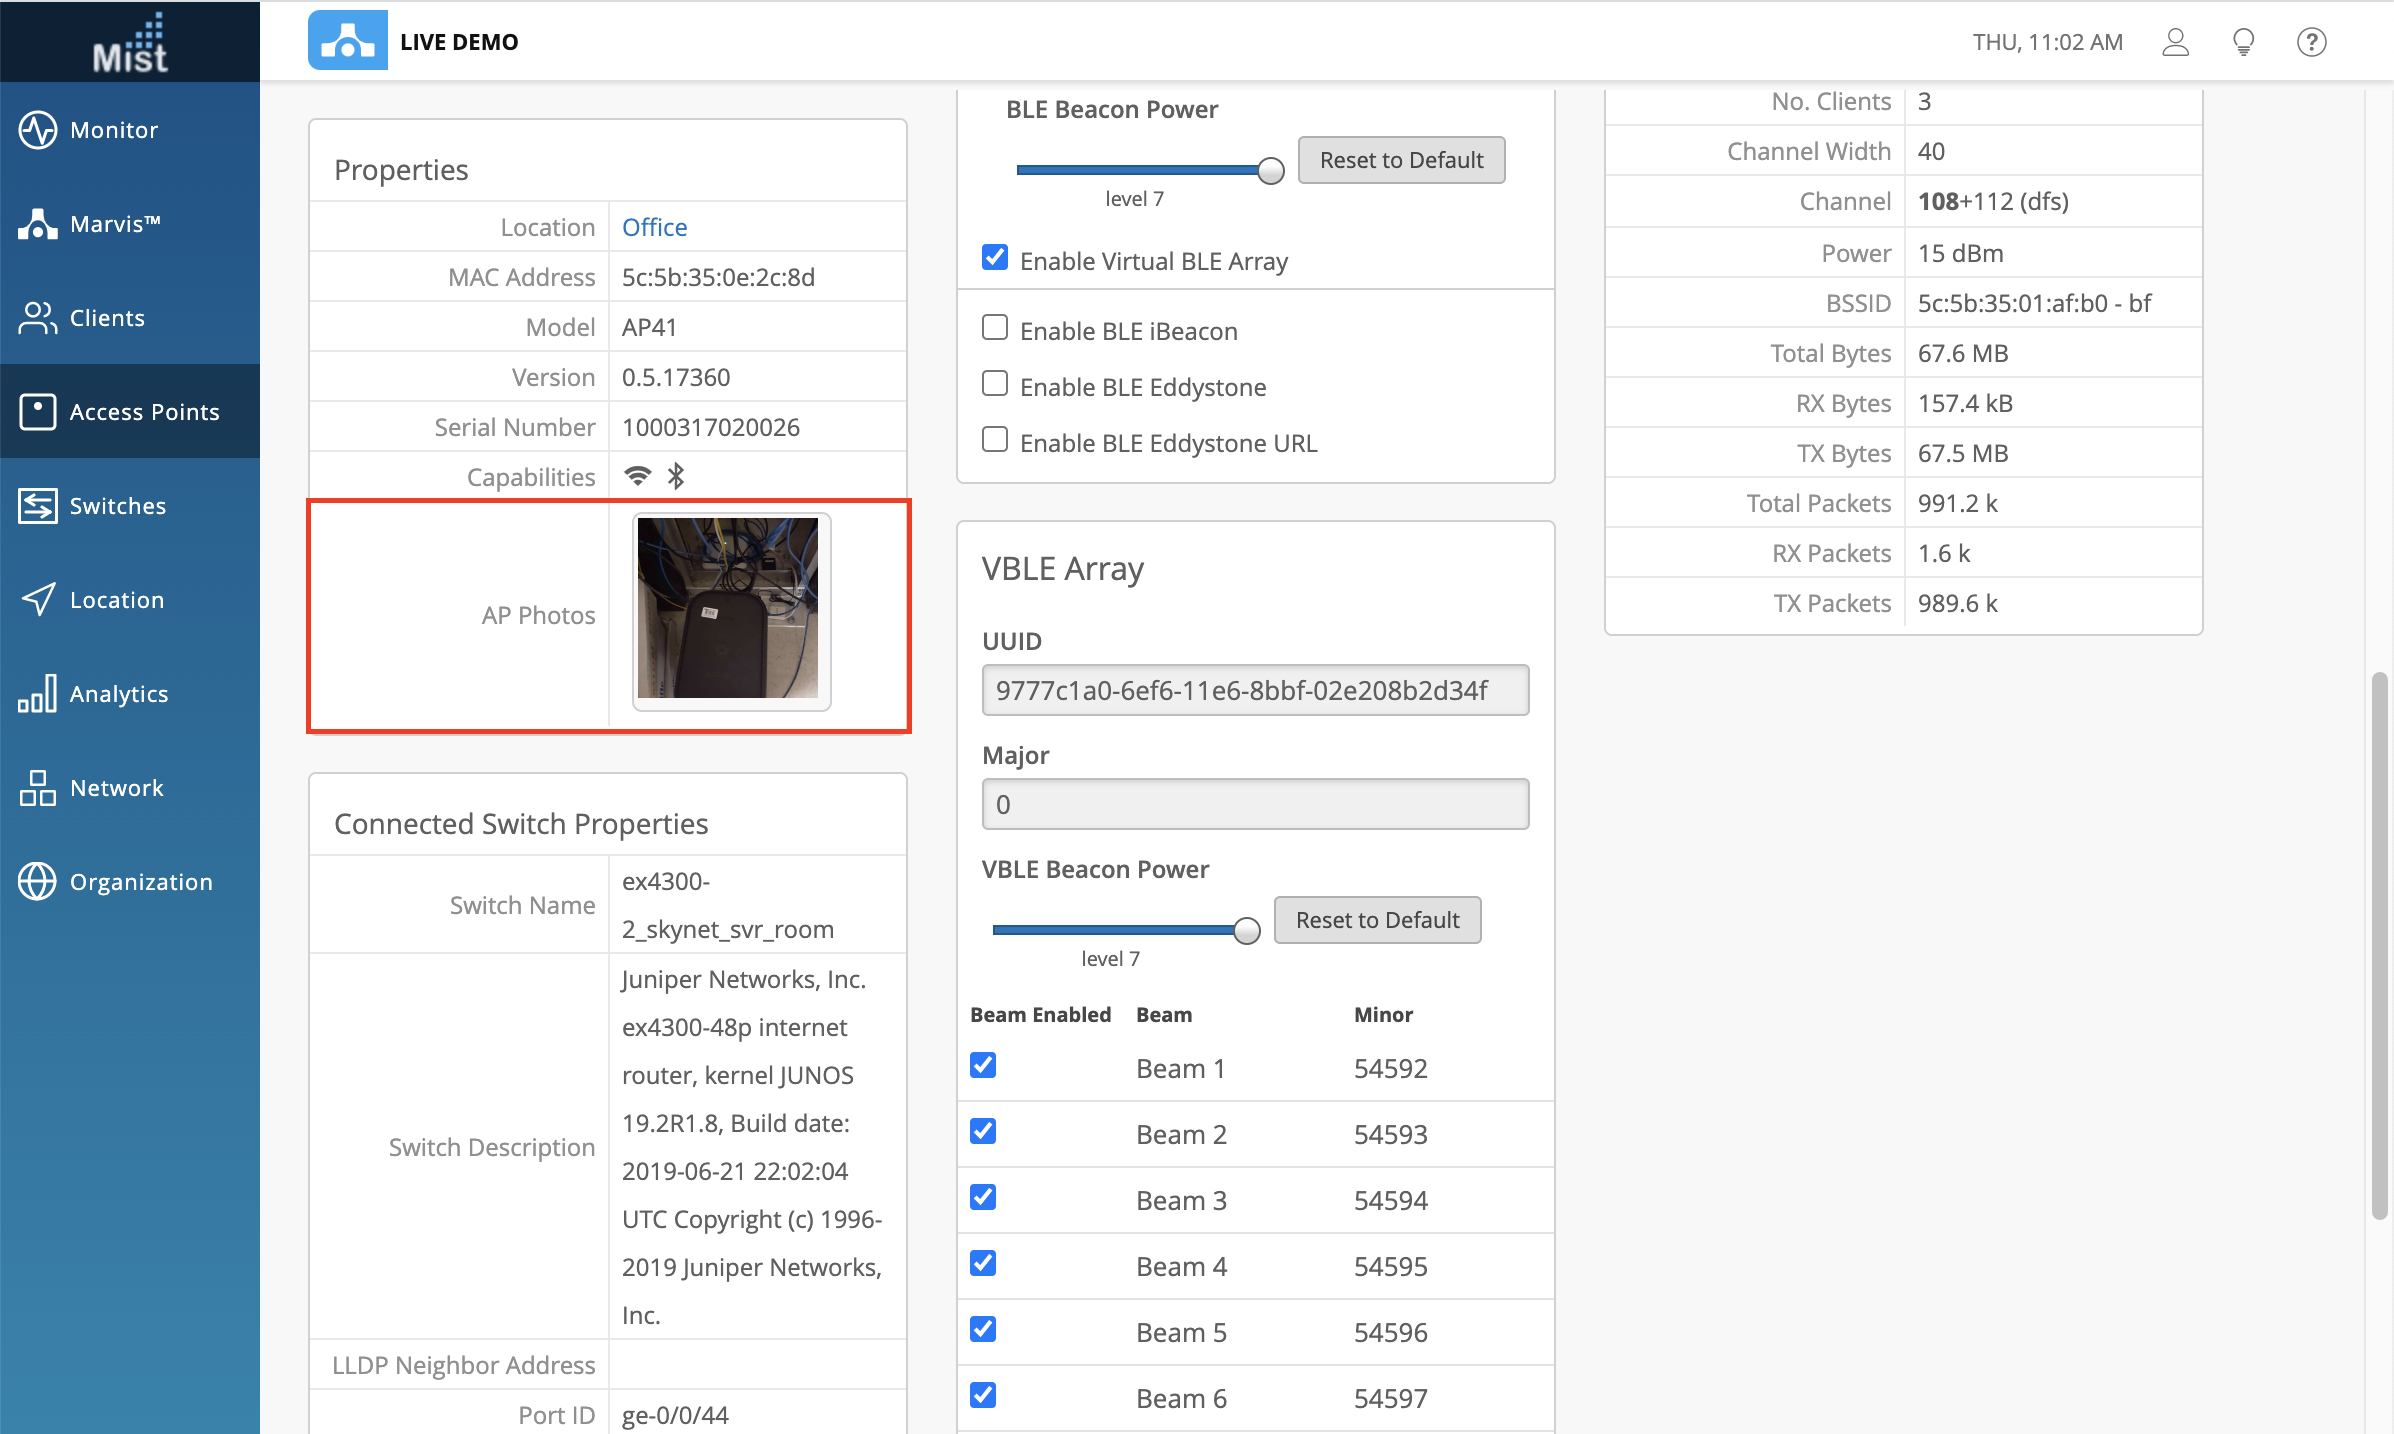
The AP Photos function on our Mist AI app is a very useful tool used to locate APs in large deployment sites, especially if they are mounted in hard-to-find areas. We are glad to announce that this feature is now fully functional on our web dashboard as well! Take pictures of the APs on your site and upload them directly to the AP Details page. Finding APs on your site has never been easier.
To access AP Photos, navigate to your Access Points page and click into an AP you wish to view photos for. In the Properties section, you will see an area for AP Photos.
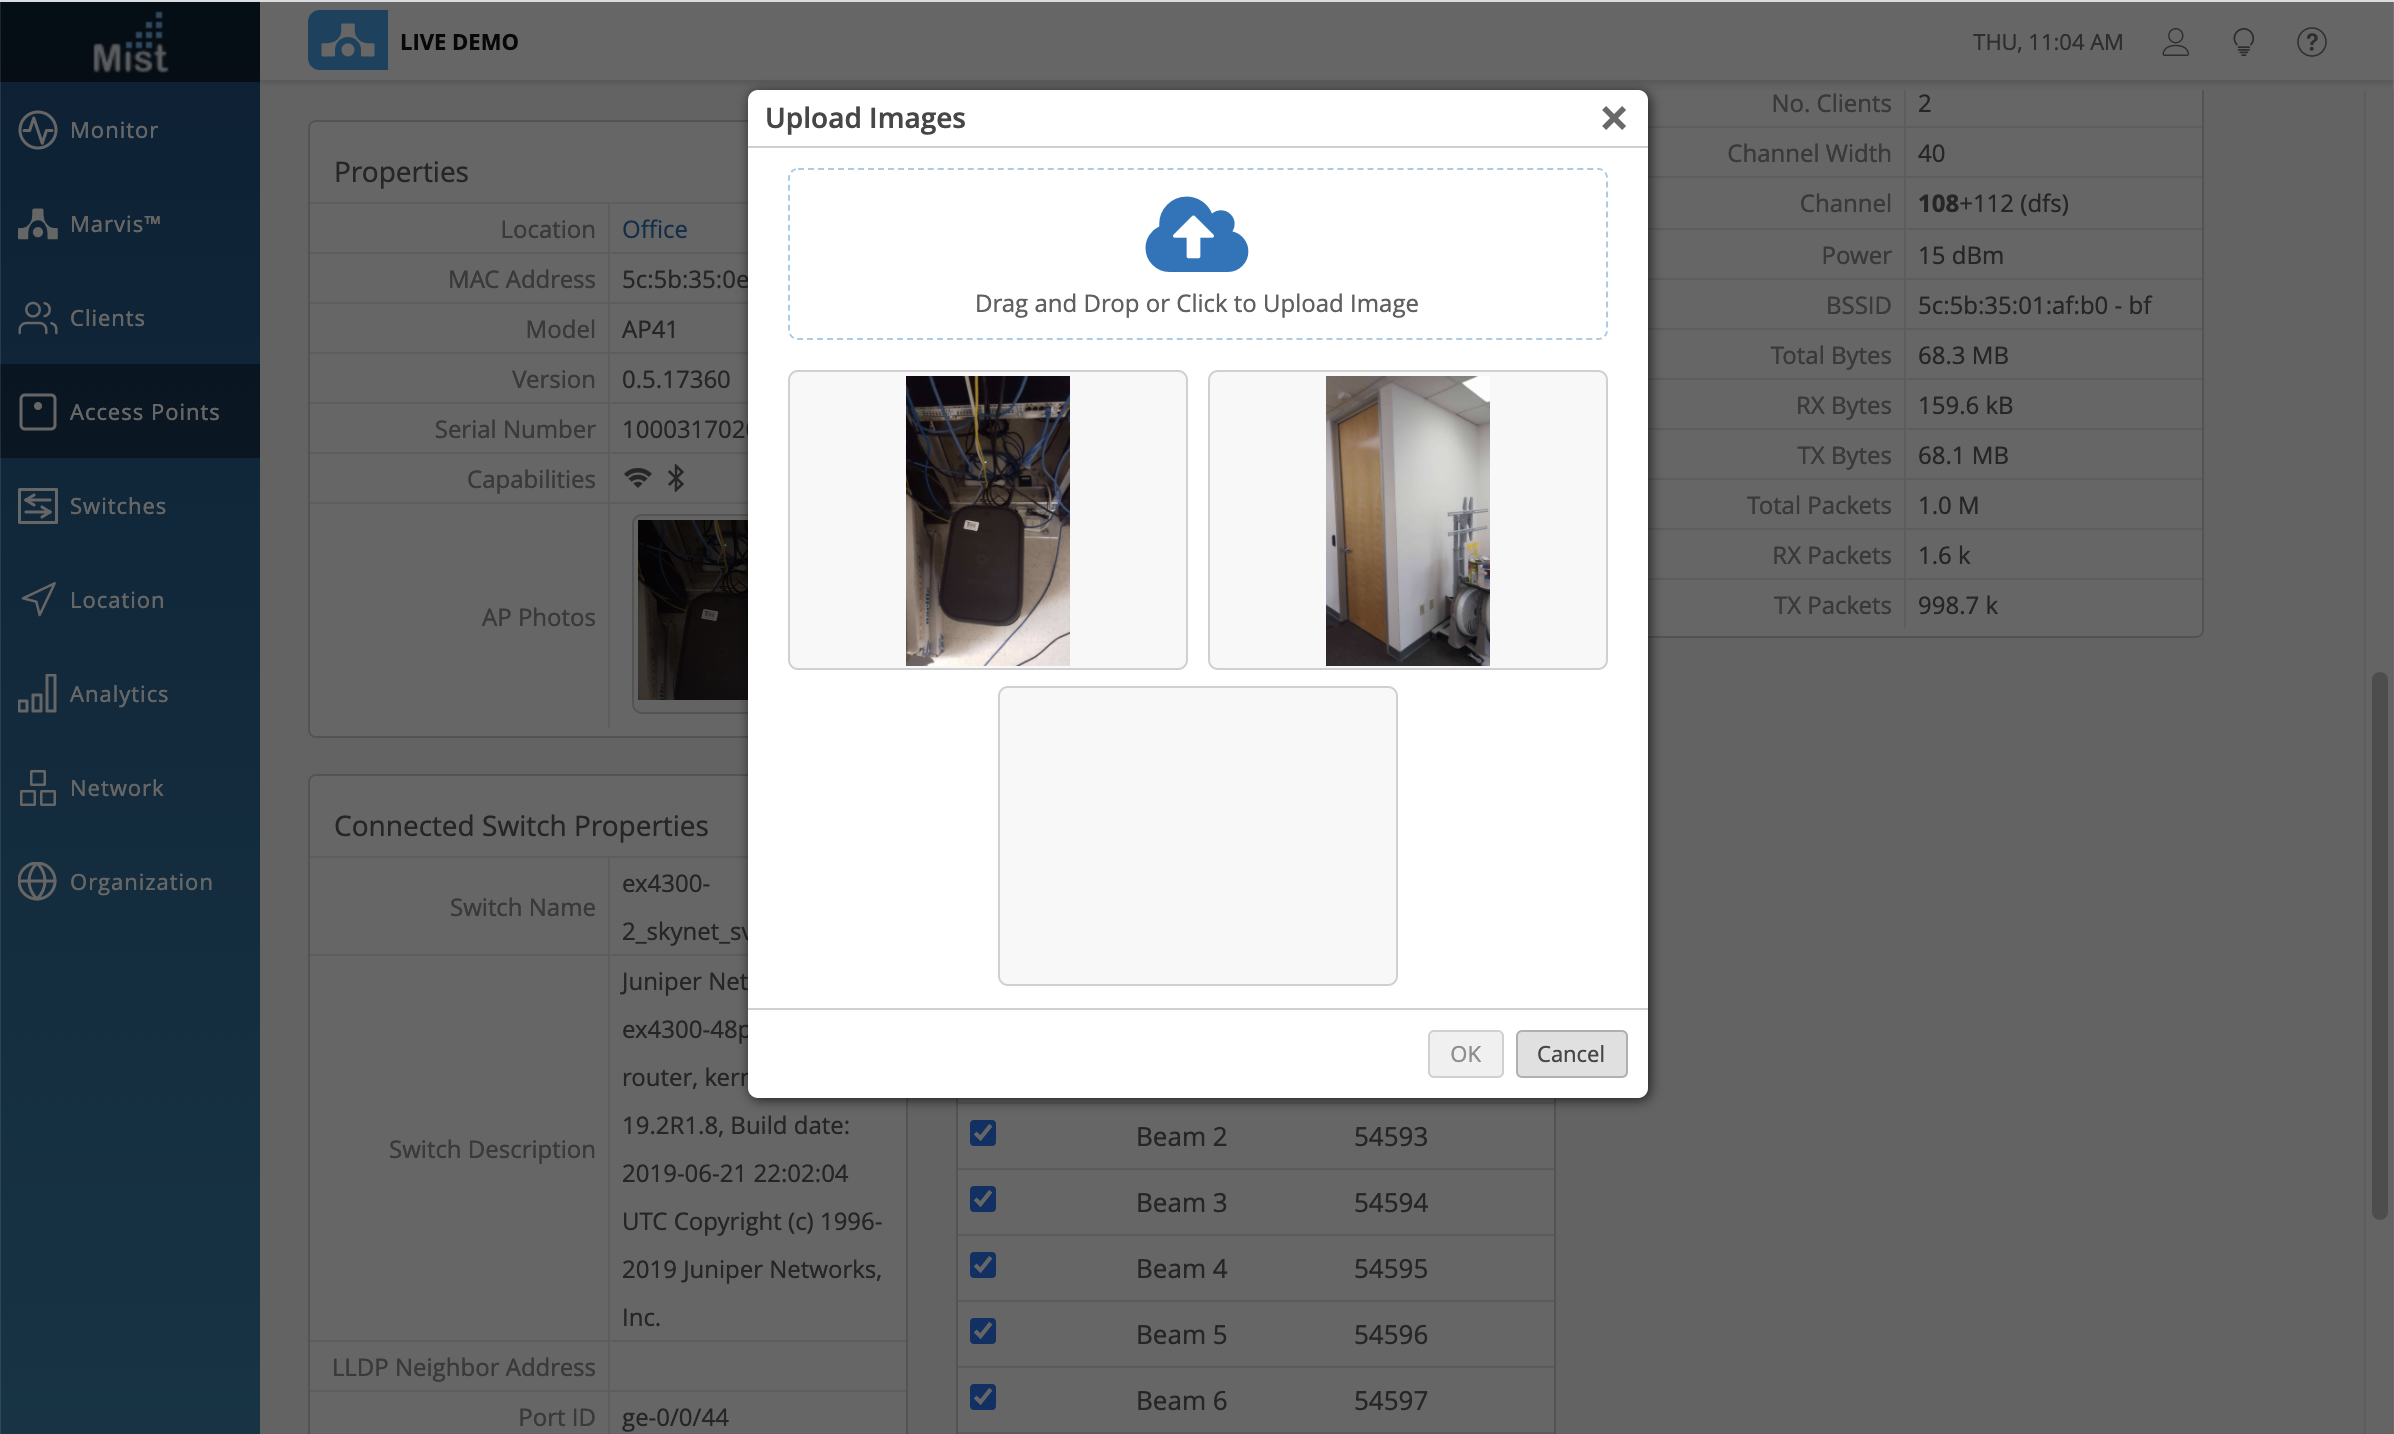
Select the photo box to open up the image upload modal, where you can upload new photos or delete old ones. Make sure to include identifying features of the surroundings in your photos to make it easier to find each AP.
Rogue AP Location
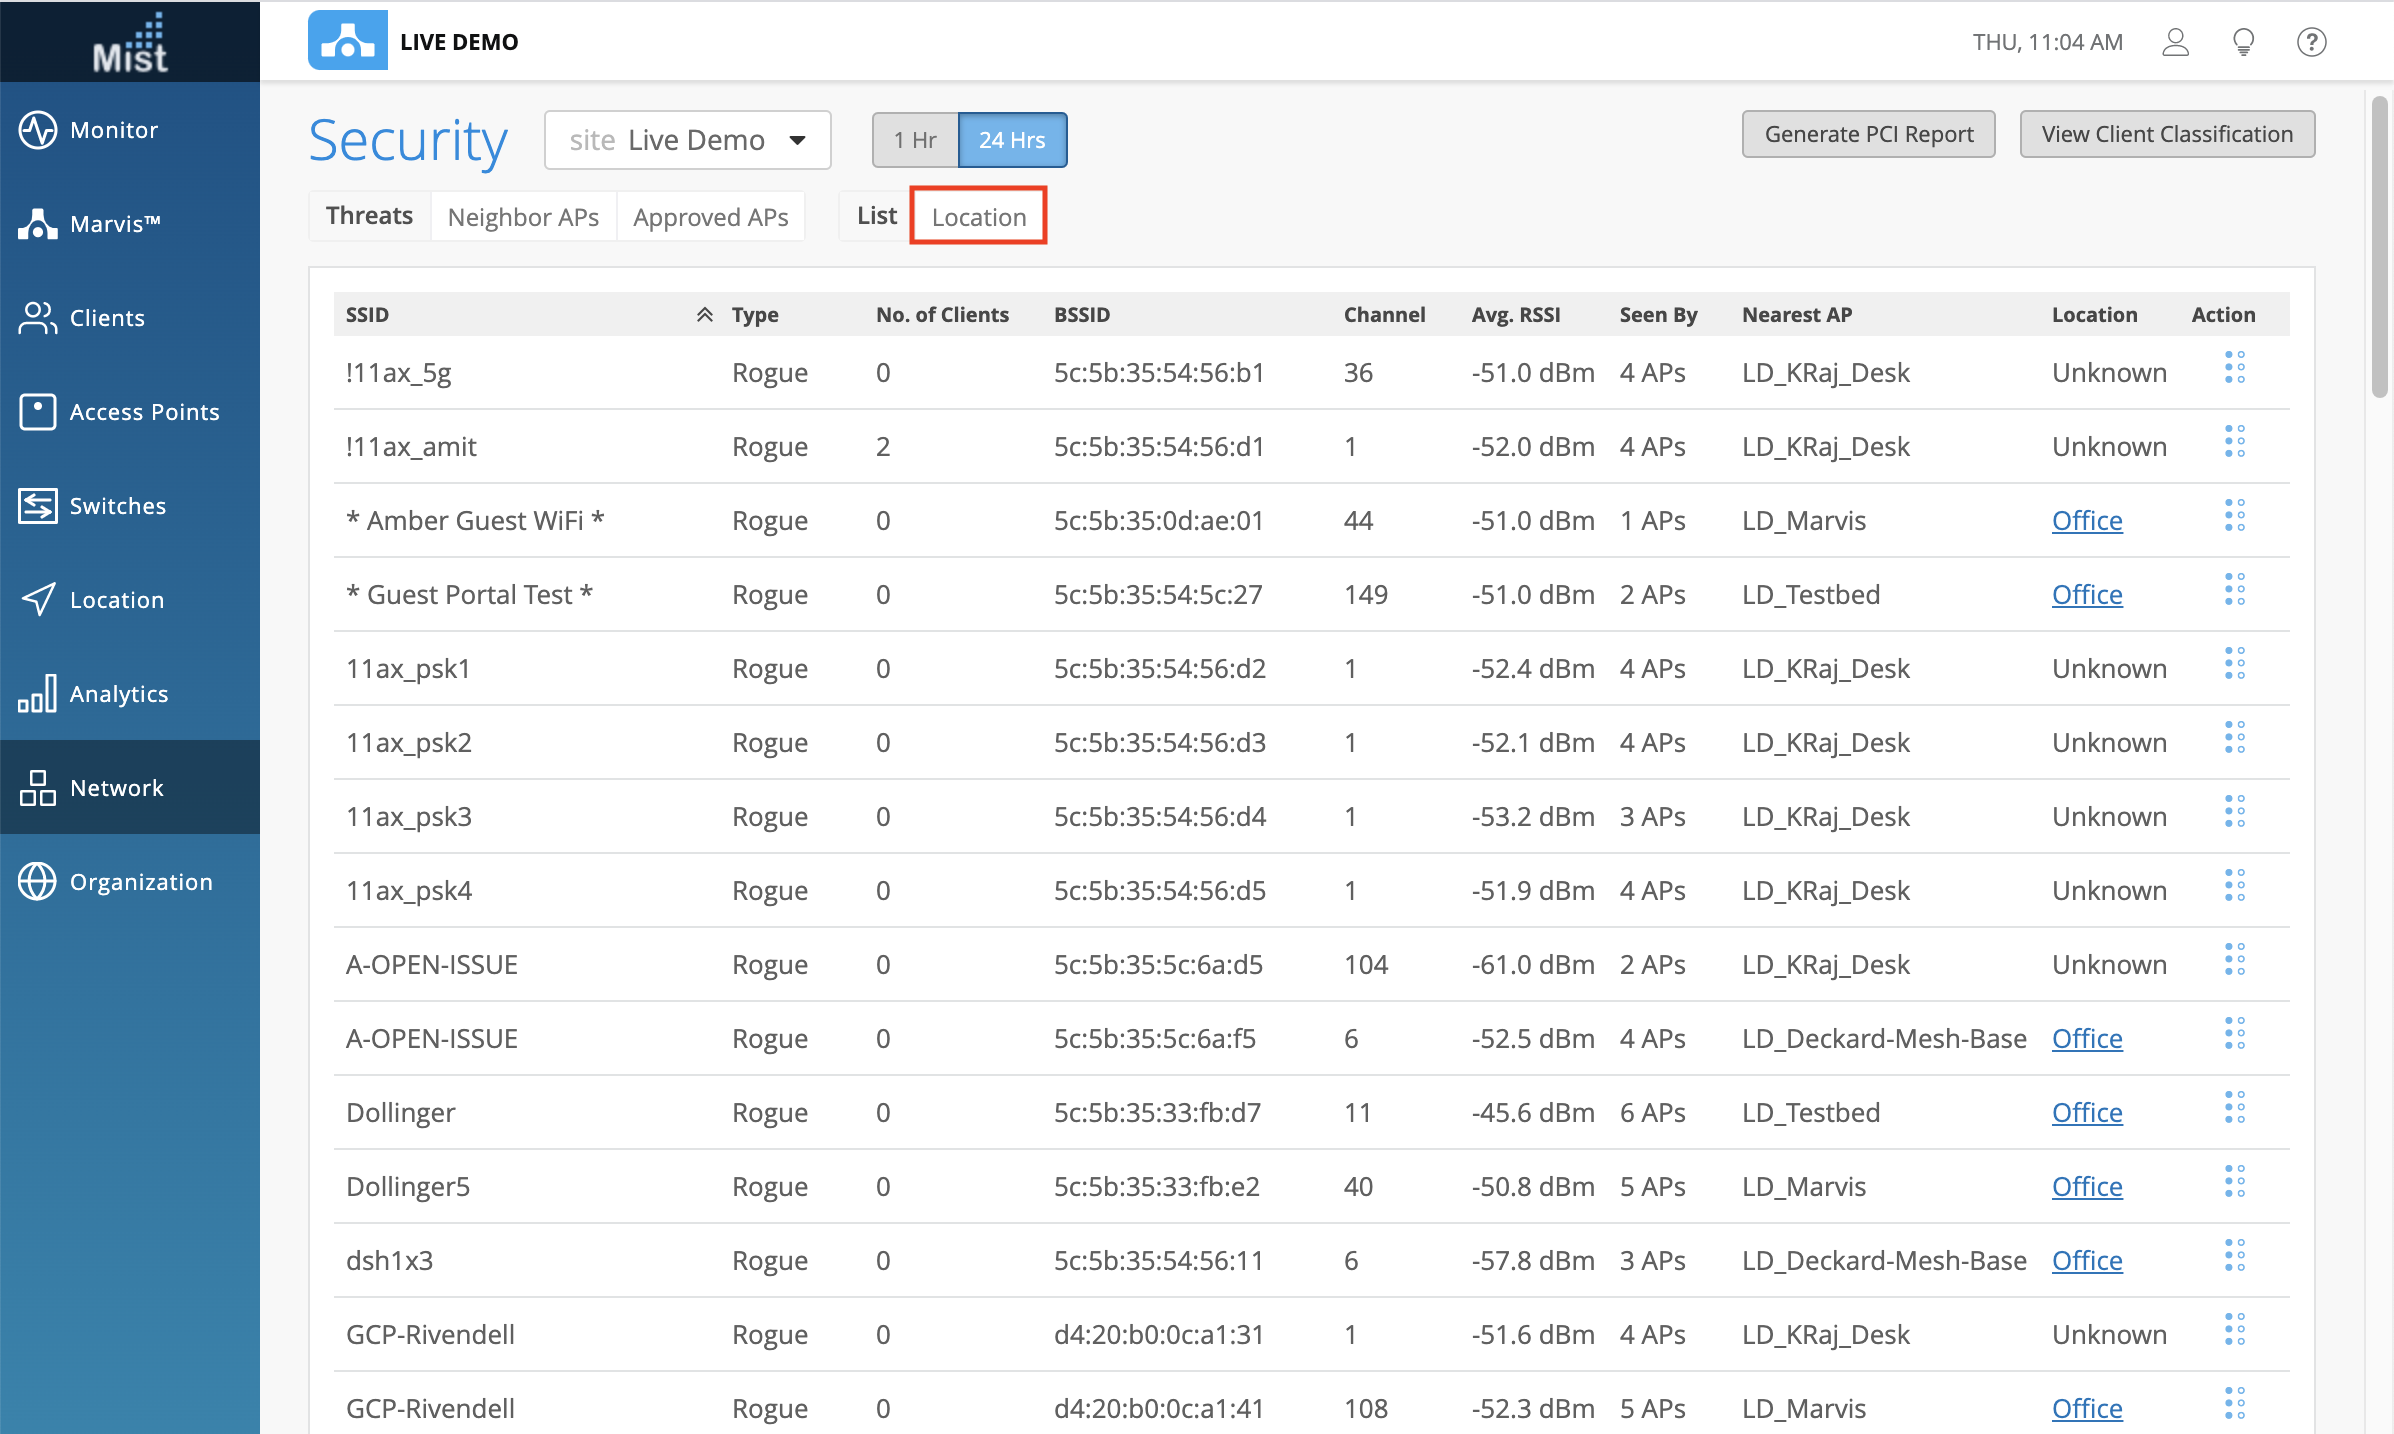
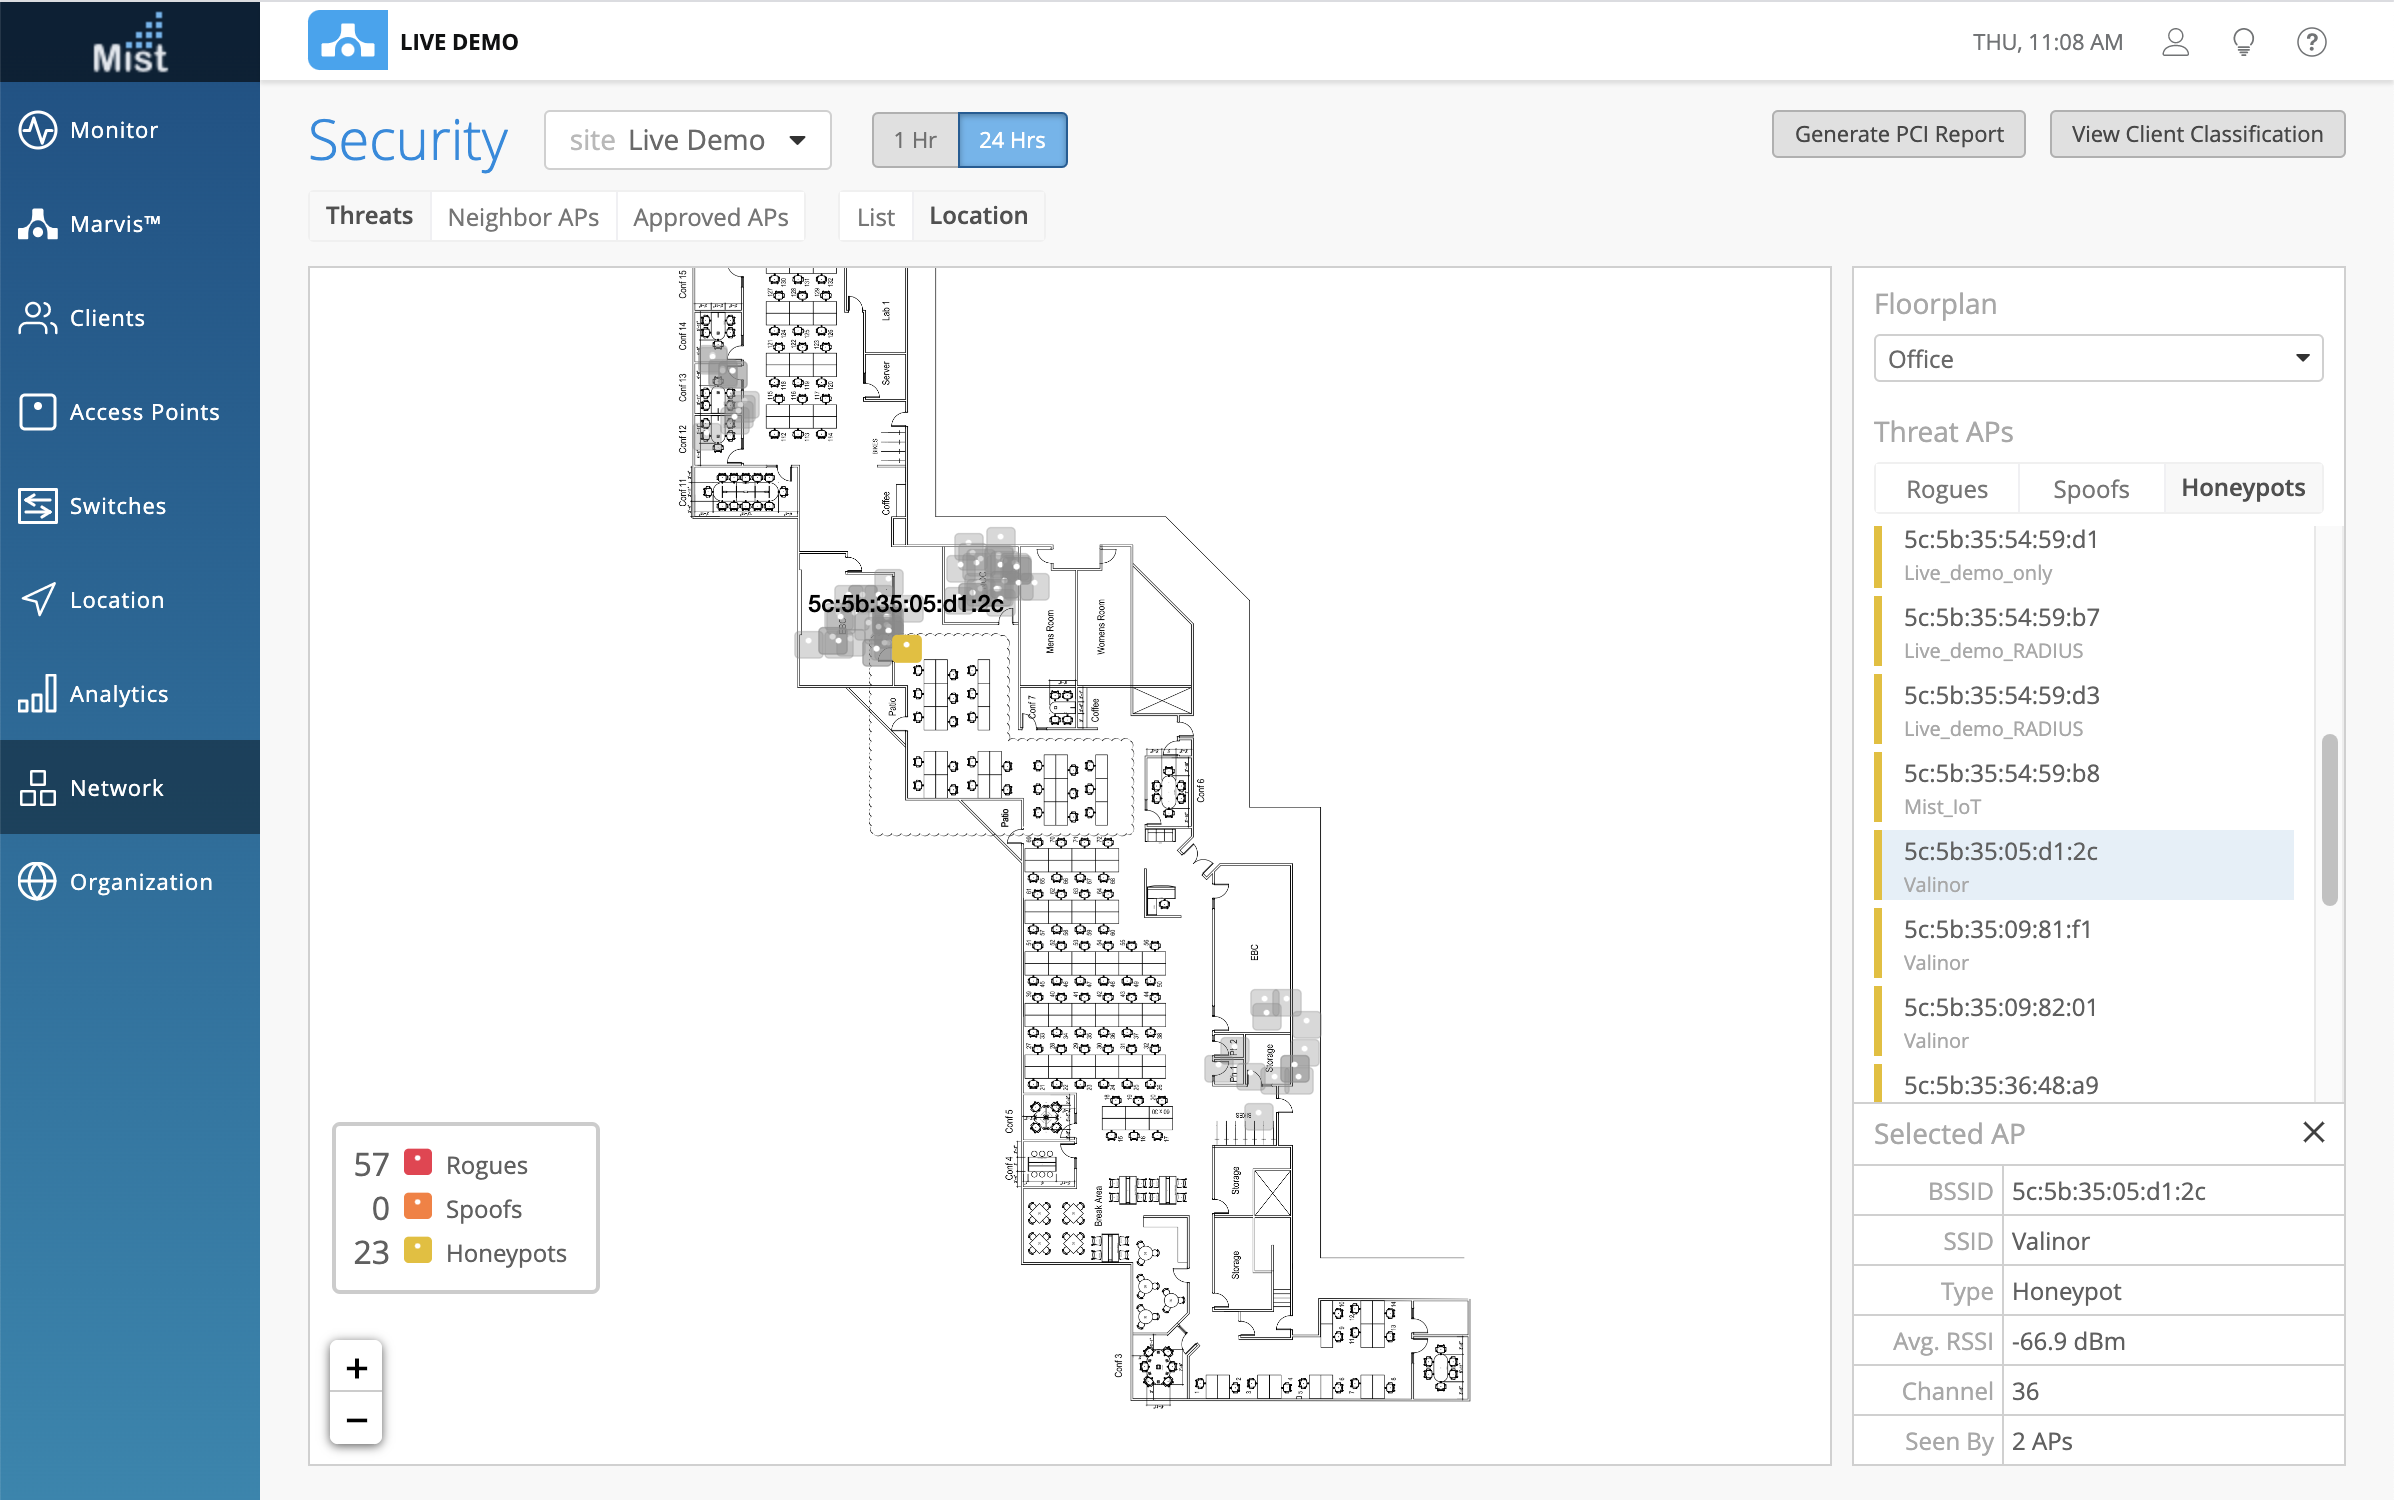
We have included a new location view in the Security page for Rogue and Honeypot APs. Using RSSI data, we can provide an approximation of the location of Rogue, Spoofed, and Honeypot APs detected around your site. Keep in mind that these location coordinates are estimates and may not show an exact position on your site map. On your security page (Network > Security), there is now a Location tab, next to the List view. Select that view to see the mapping of Rogue/Spoof/Honeypot APs.
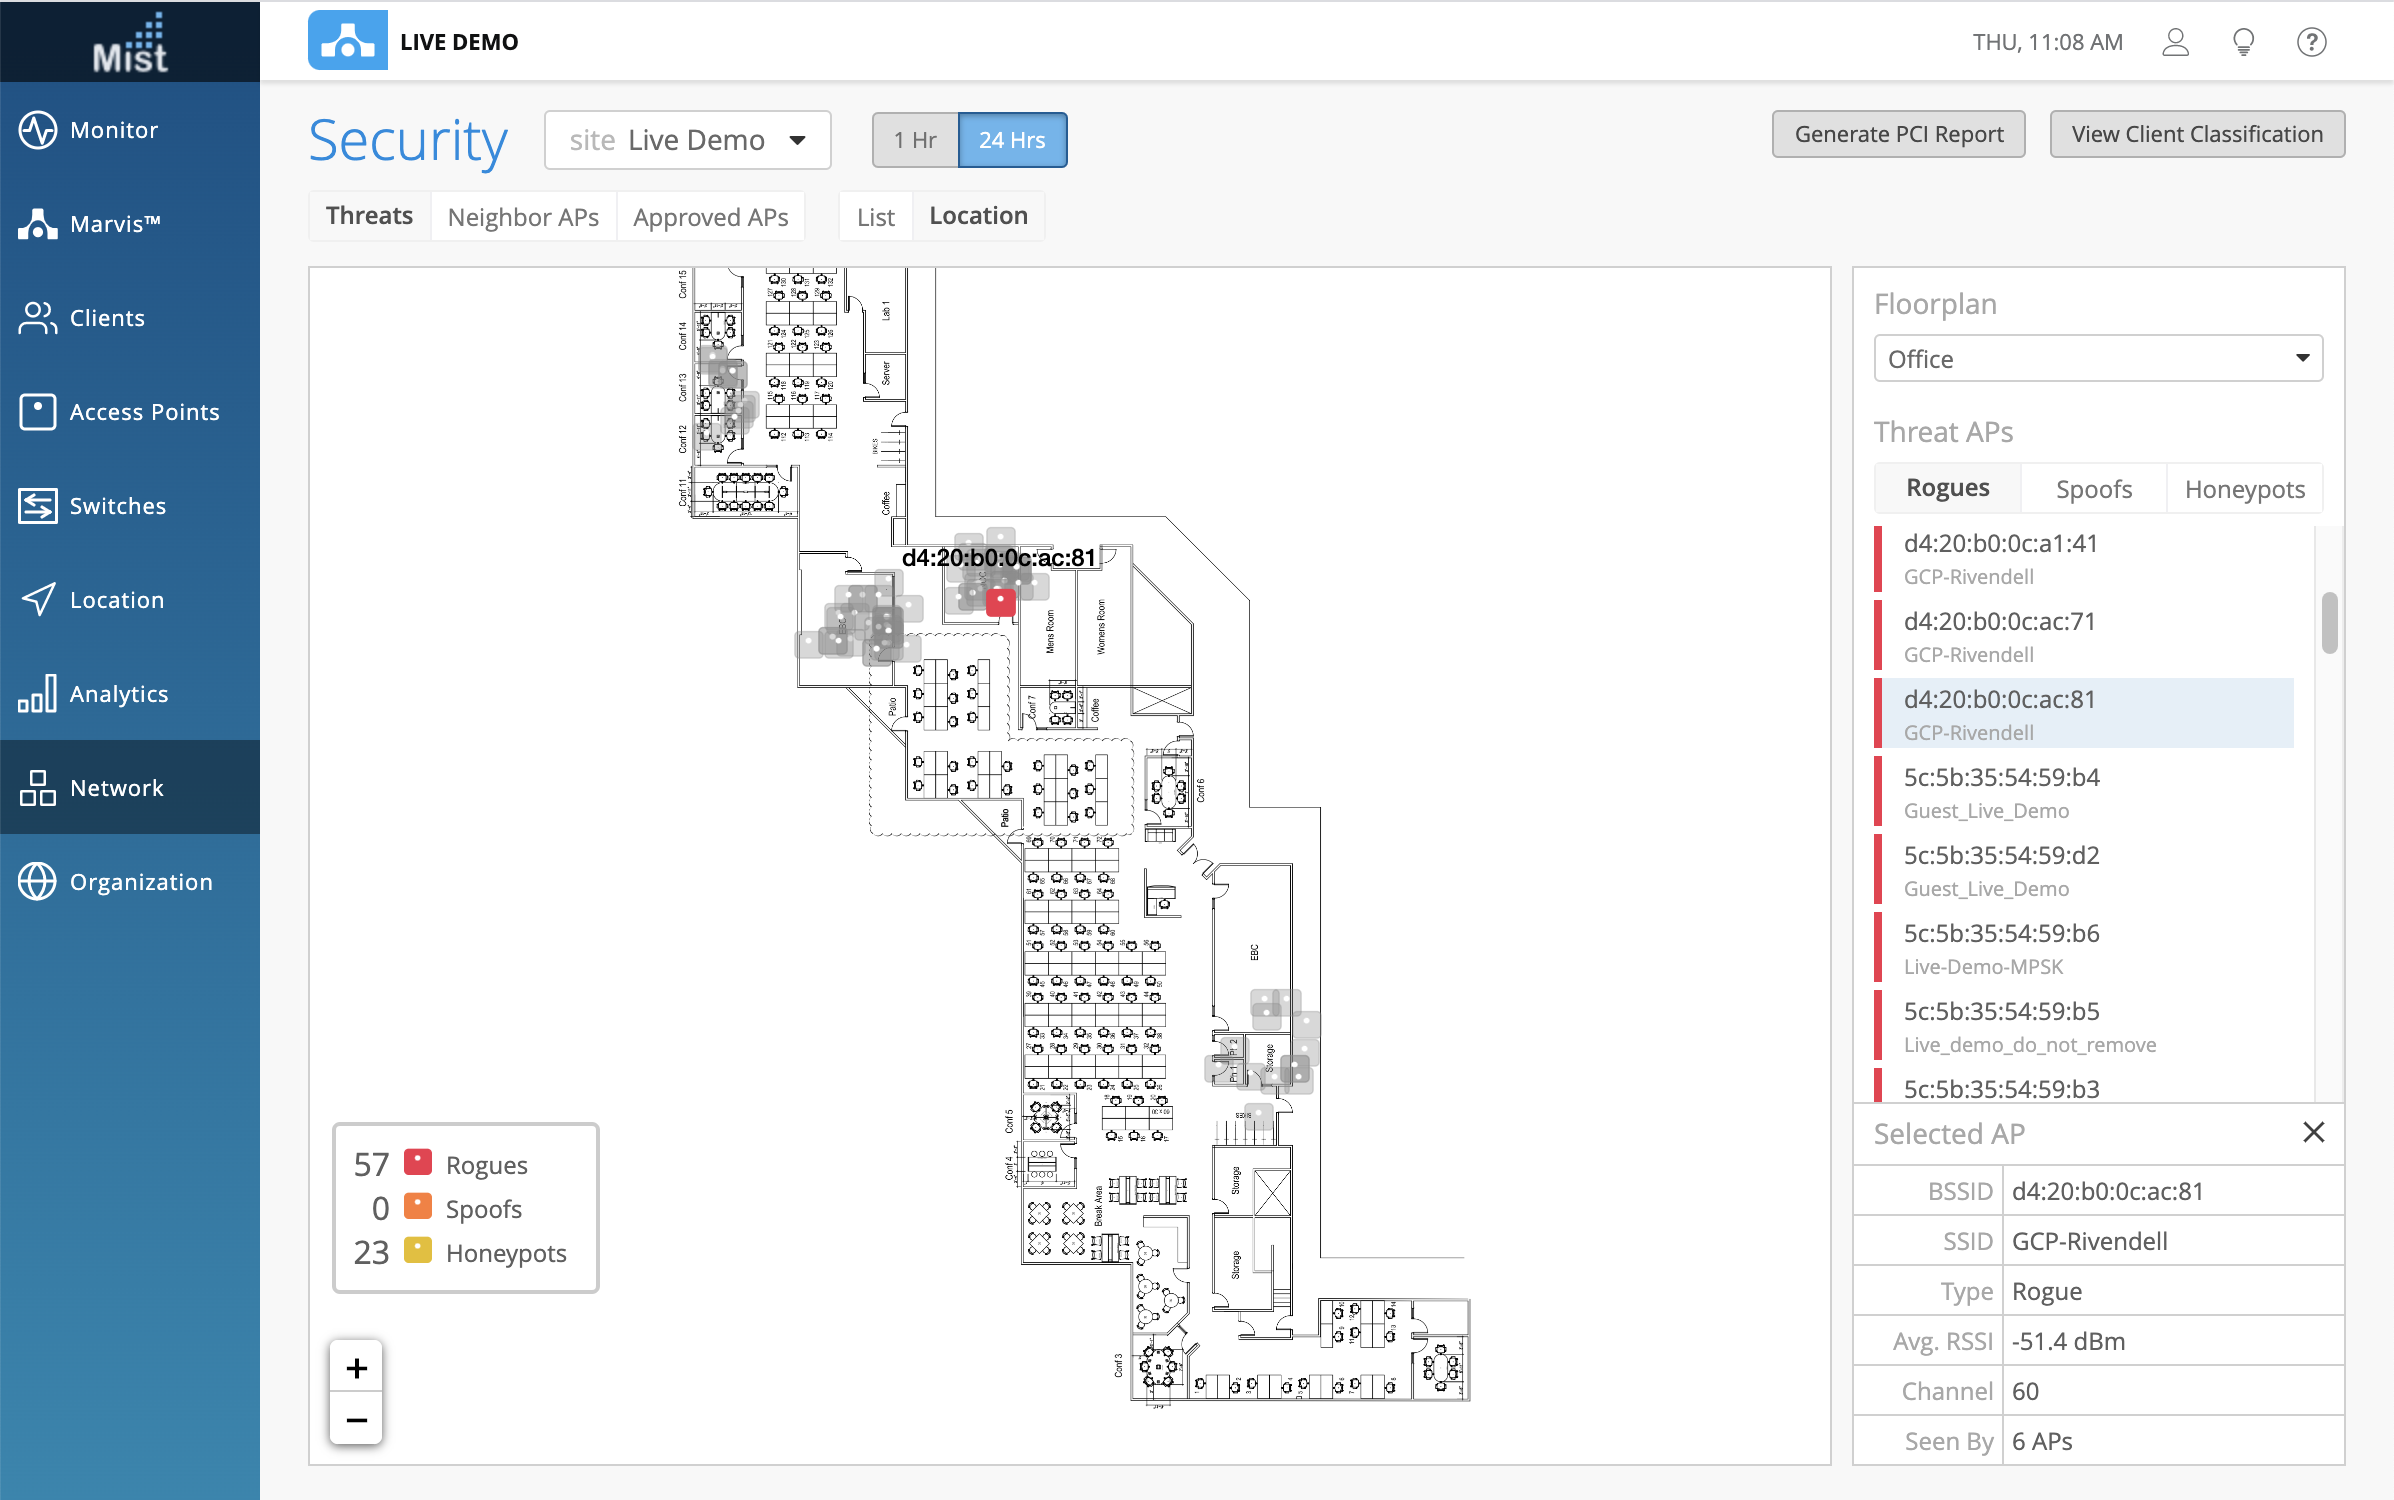
You may select APs directly on the map or from the list of Threat APs on the right. Your selected AP will be highlighted in both places and the Selected AP section will reveal details pertaining to that AP, such as SSID, Channel, and Average RSSI. Here, we selected a Rogue AP on the map.
And here is an example of a Honeypot AP being selected.
Marvis
Marvis Actions – AP Offline [Beta]
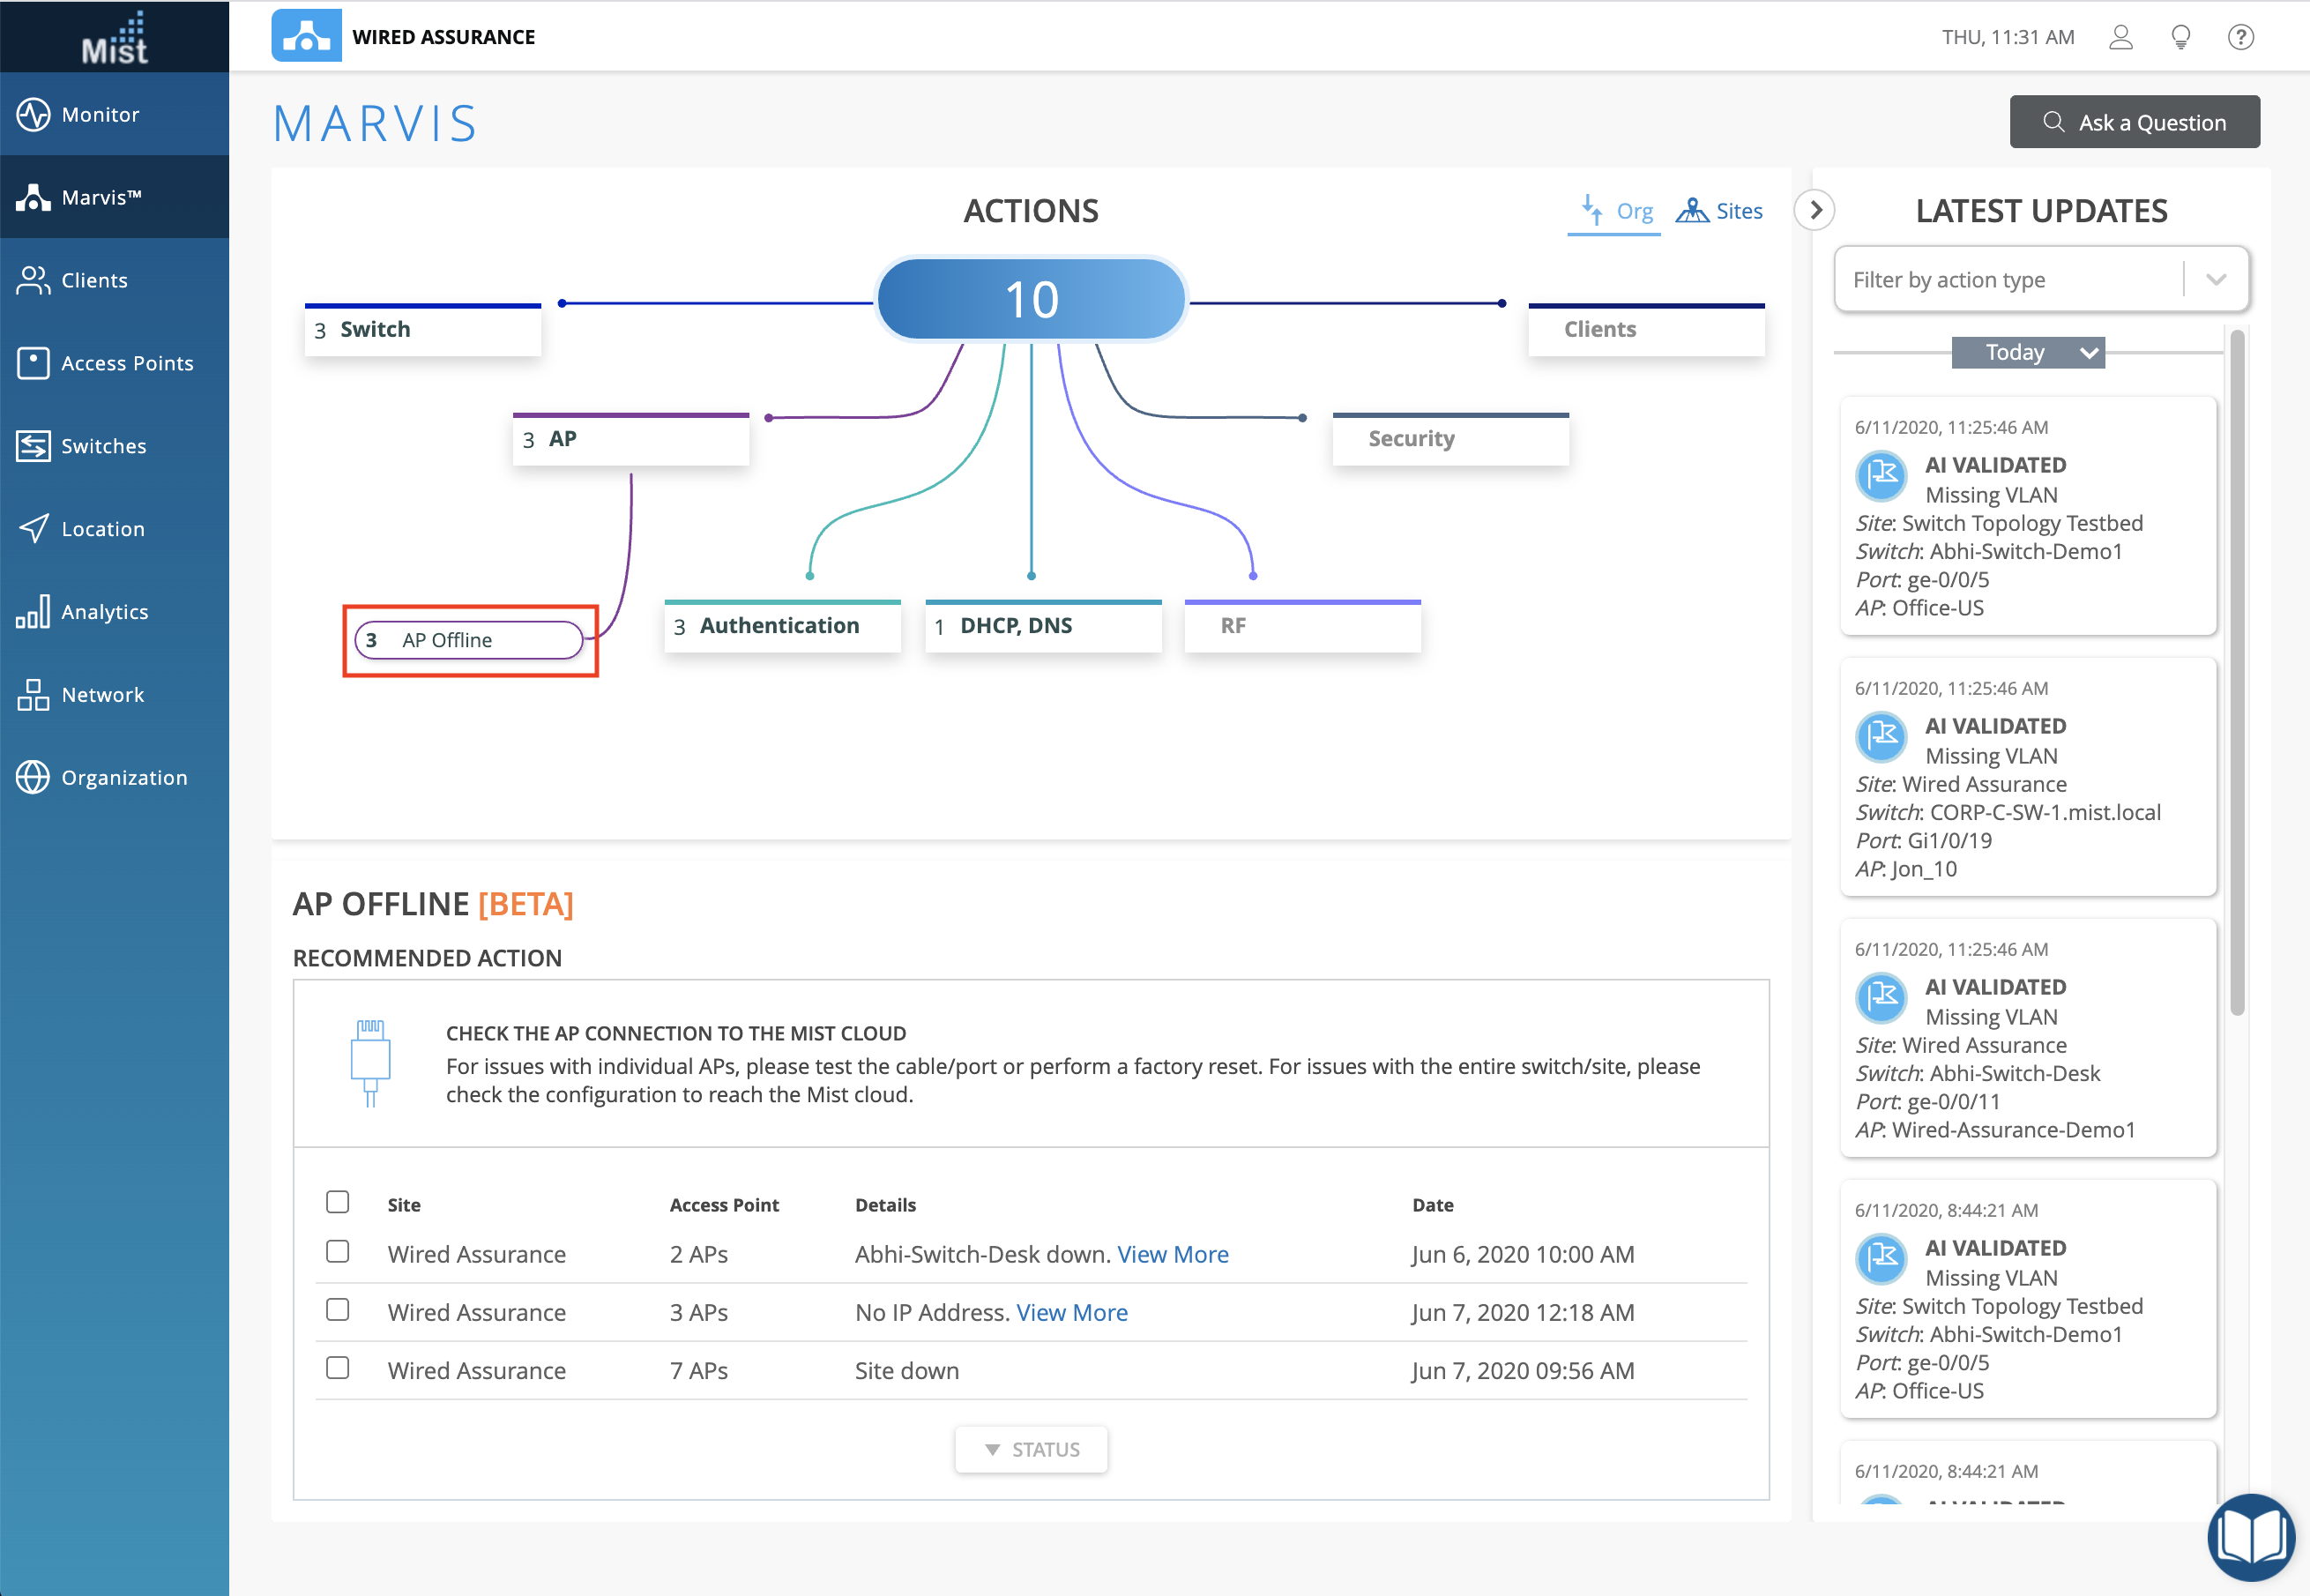
We are excited to introduce another piece to our Marvis Action Dashboard! This week we are rolling out detection for offline APs on your site. From the Action Dashboard, we will expose your disconnected APs and help determine the scope of the offline AP issue – individual APs disconnected, a switch being down, or the entire site having issues. From our Marvis Actions Dashboard, select the AP Offline bubble to view the details. You can see how many APs are affected by each error, as well as the Switches the offline APs are connected to. At the moment this feature is in a Beta mode, and we are still in the midst of working to refine the feature more.
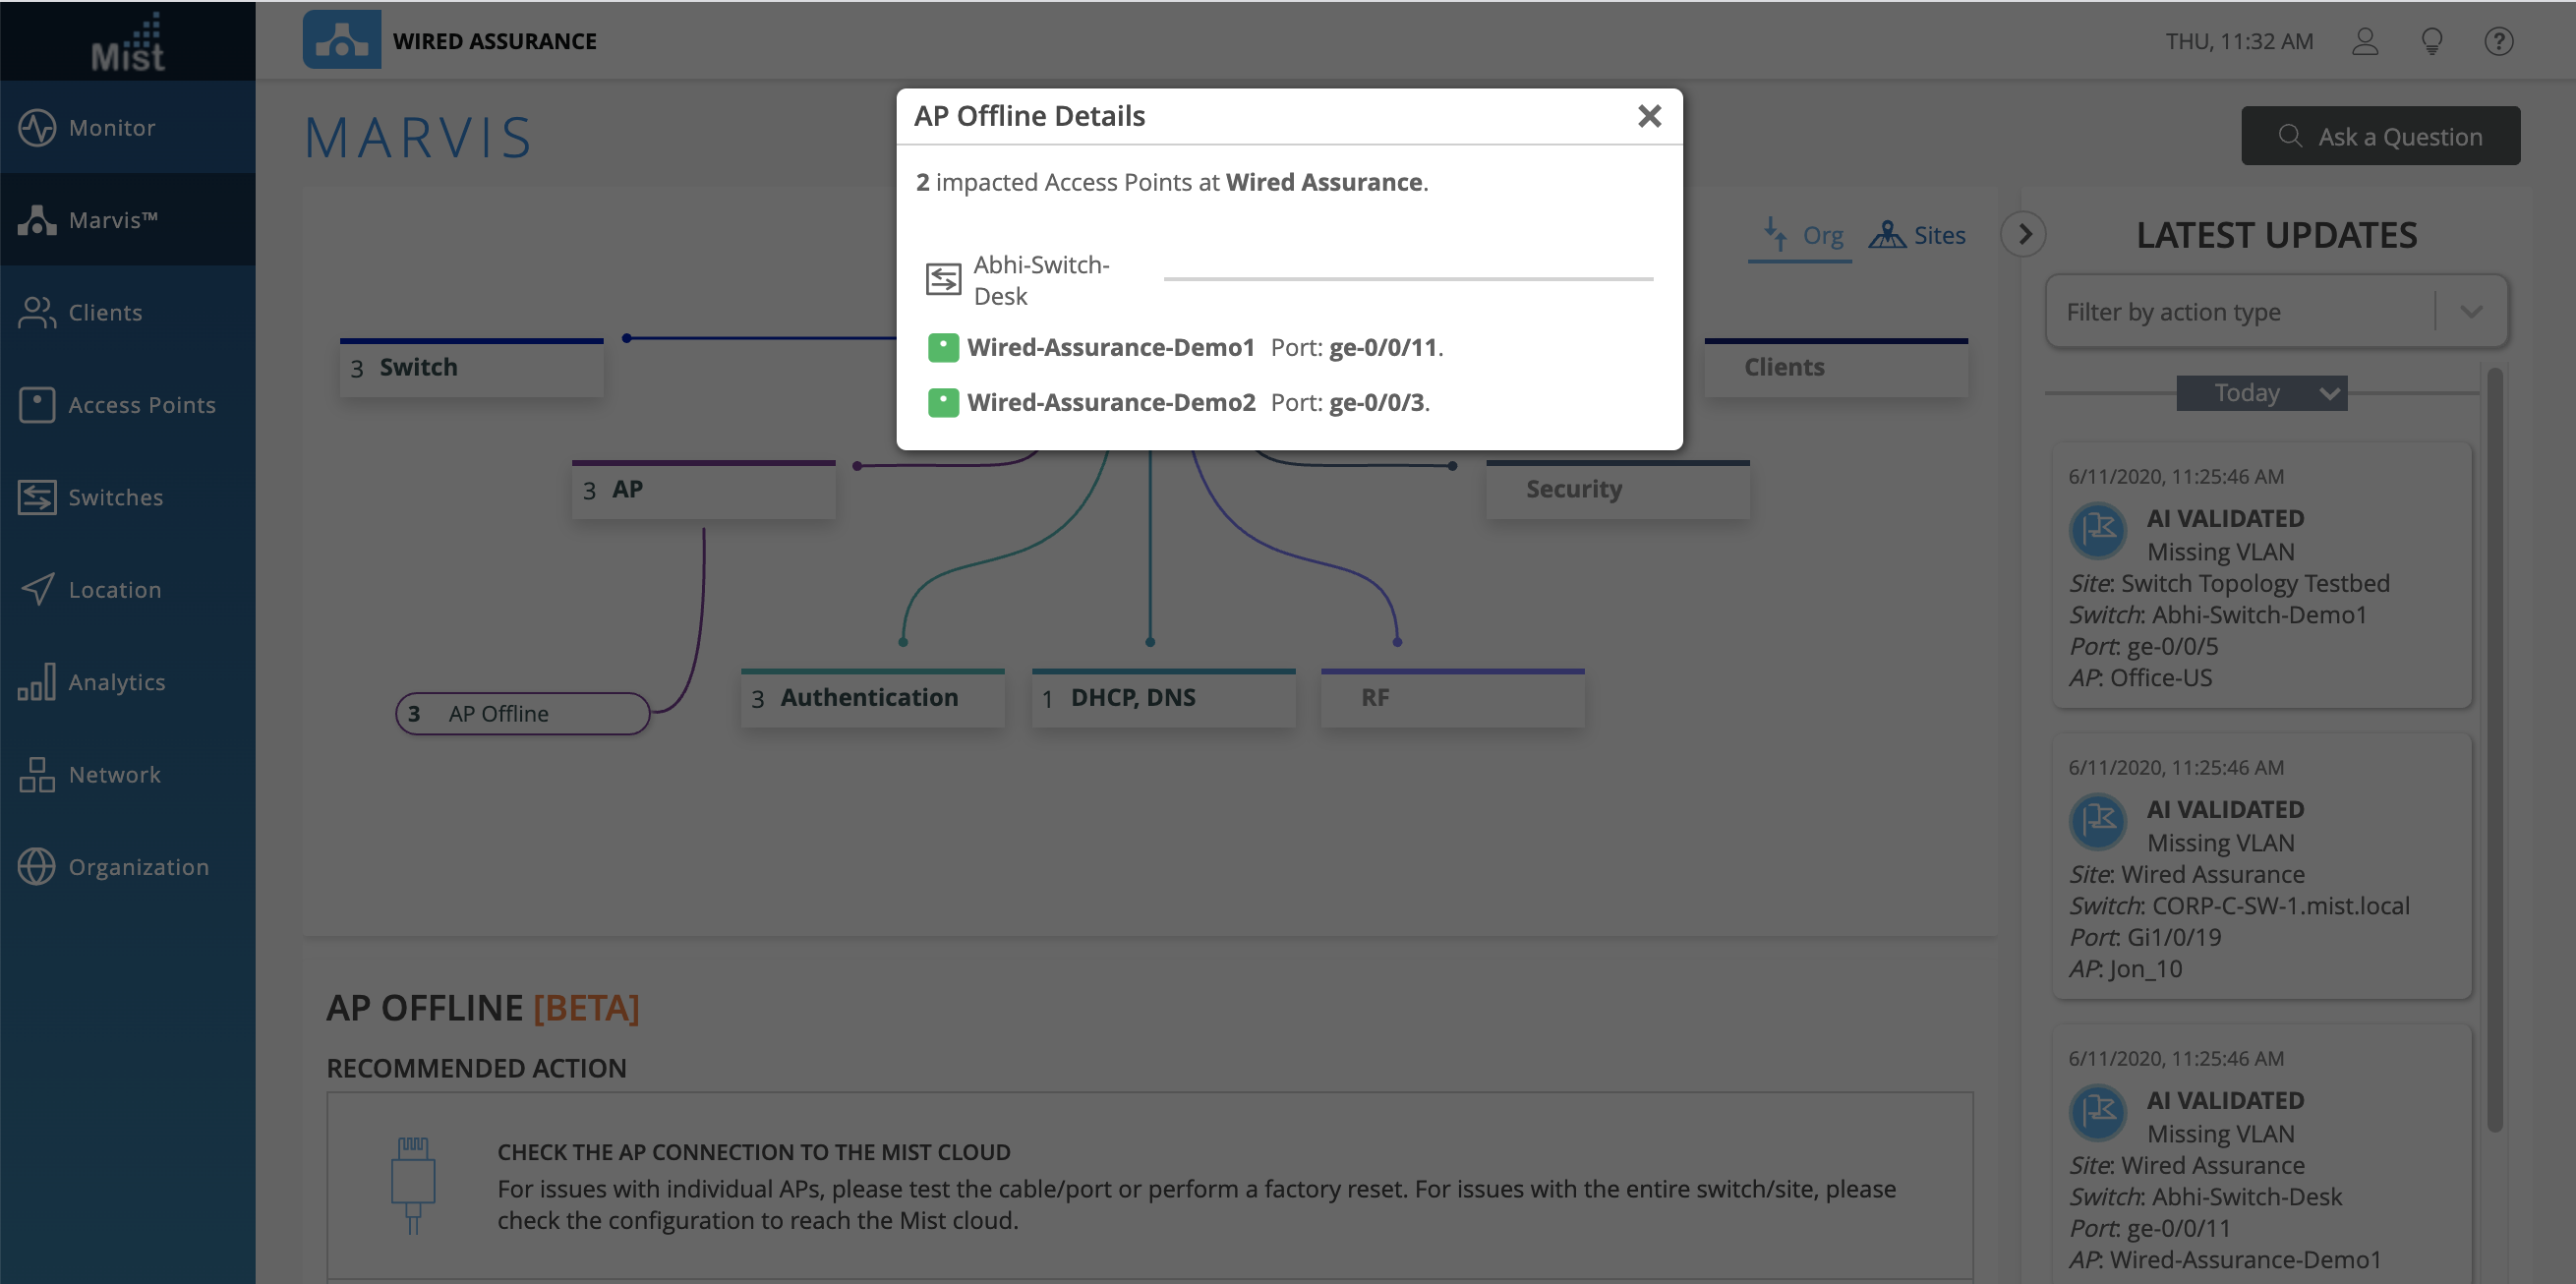
Select View More in the Details column to pop open a more detailed visual of the Switches, APs, and ports affected.
Marvis Search – Org Level Search Queries for All Admin Roles
We are expanding our Marvis Search functionality to allow all admin roles to have access to org level search queries. This can help out organizations with many admins in roles such as Observer and Helpdesk with limited read/write abilities to still have full visibility in the Marvis Search.