Simplified Operations
Network and Engagement Analytics
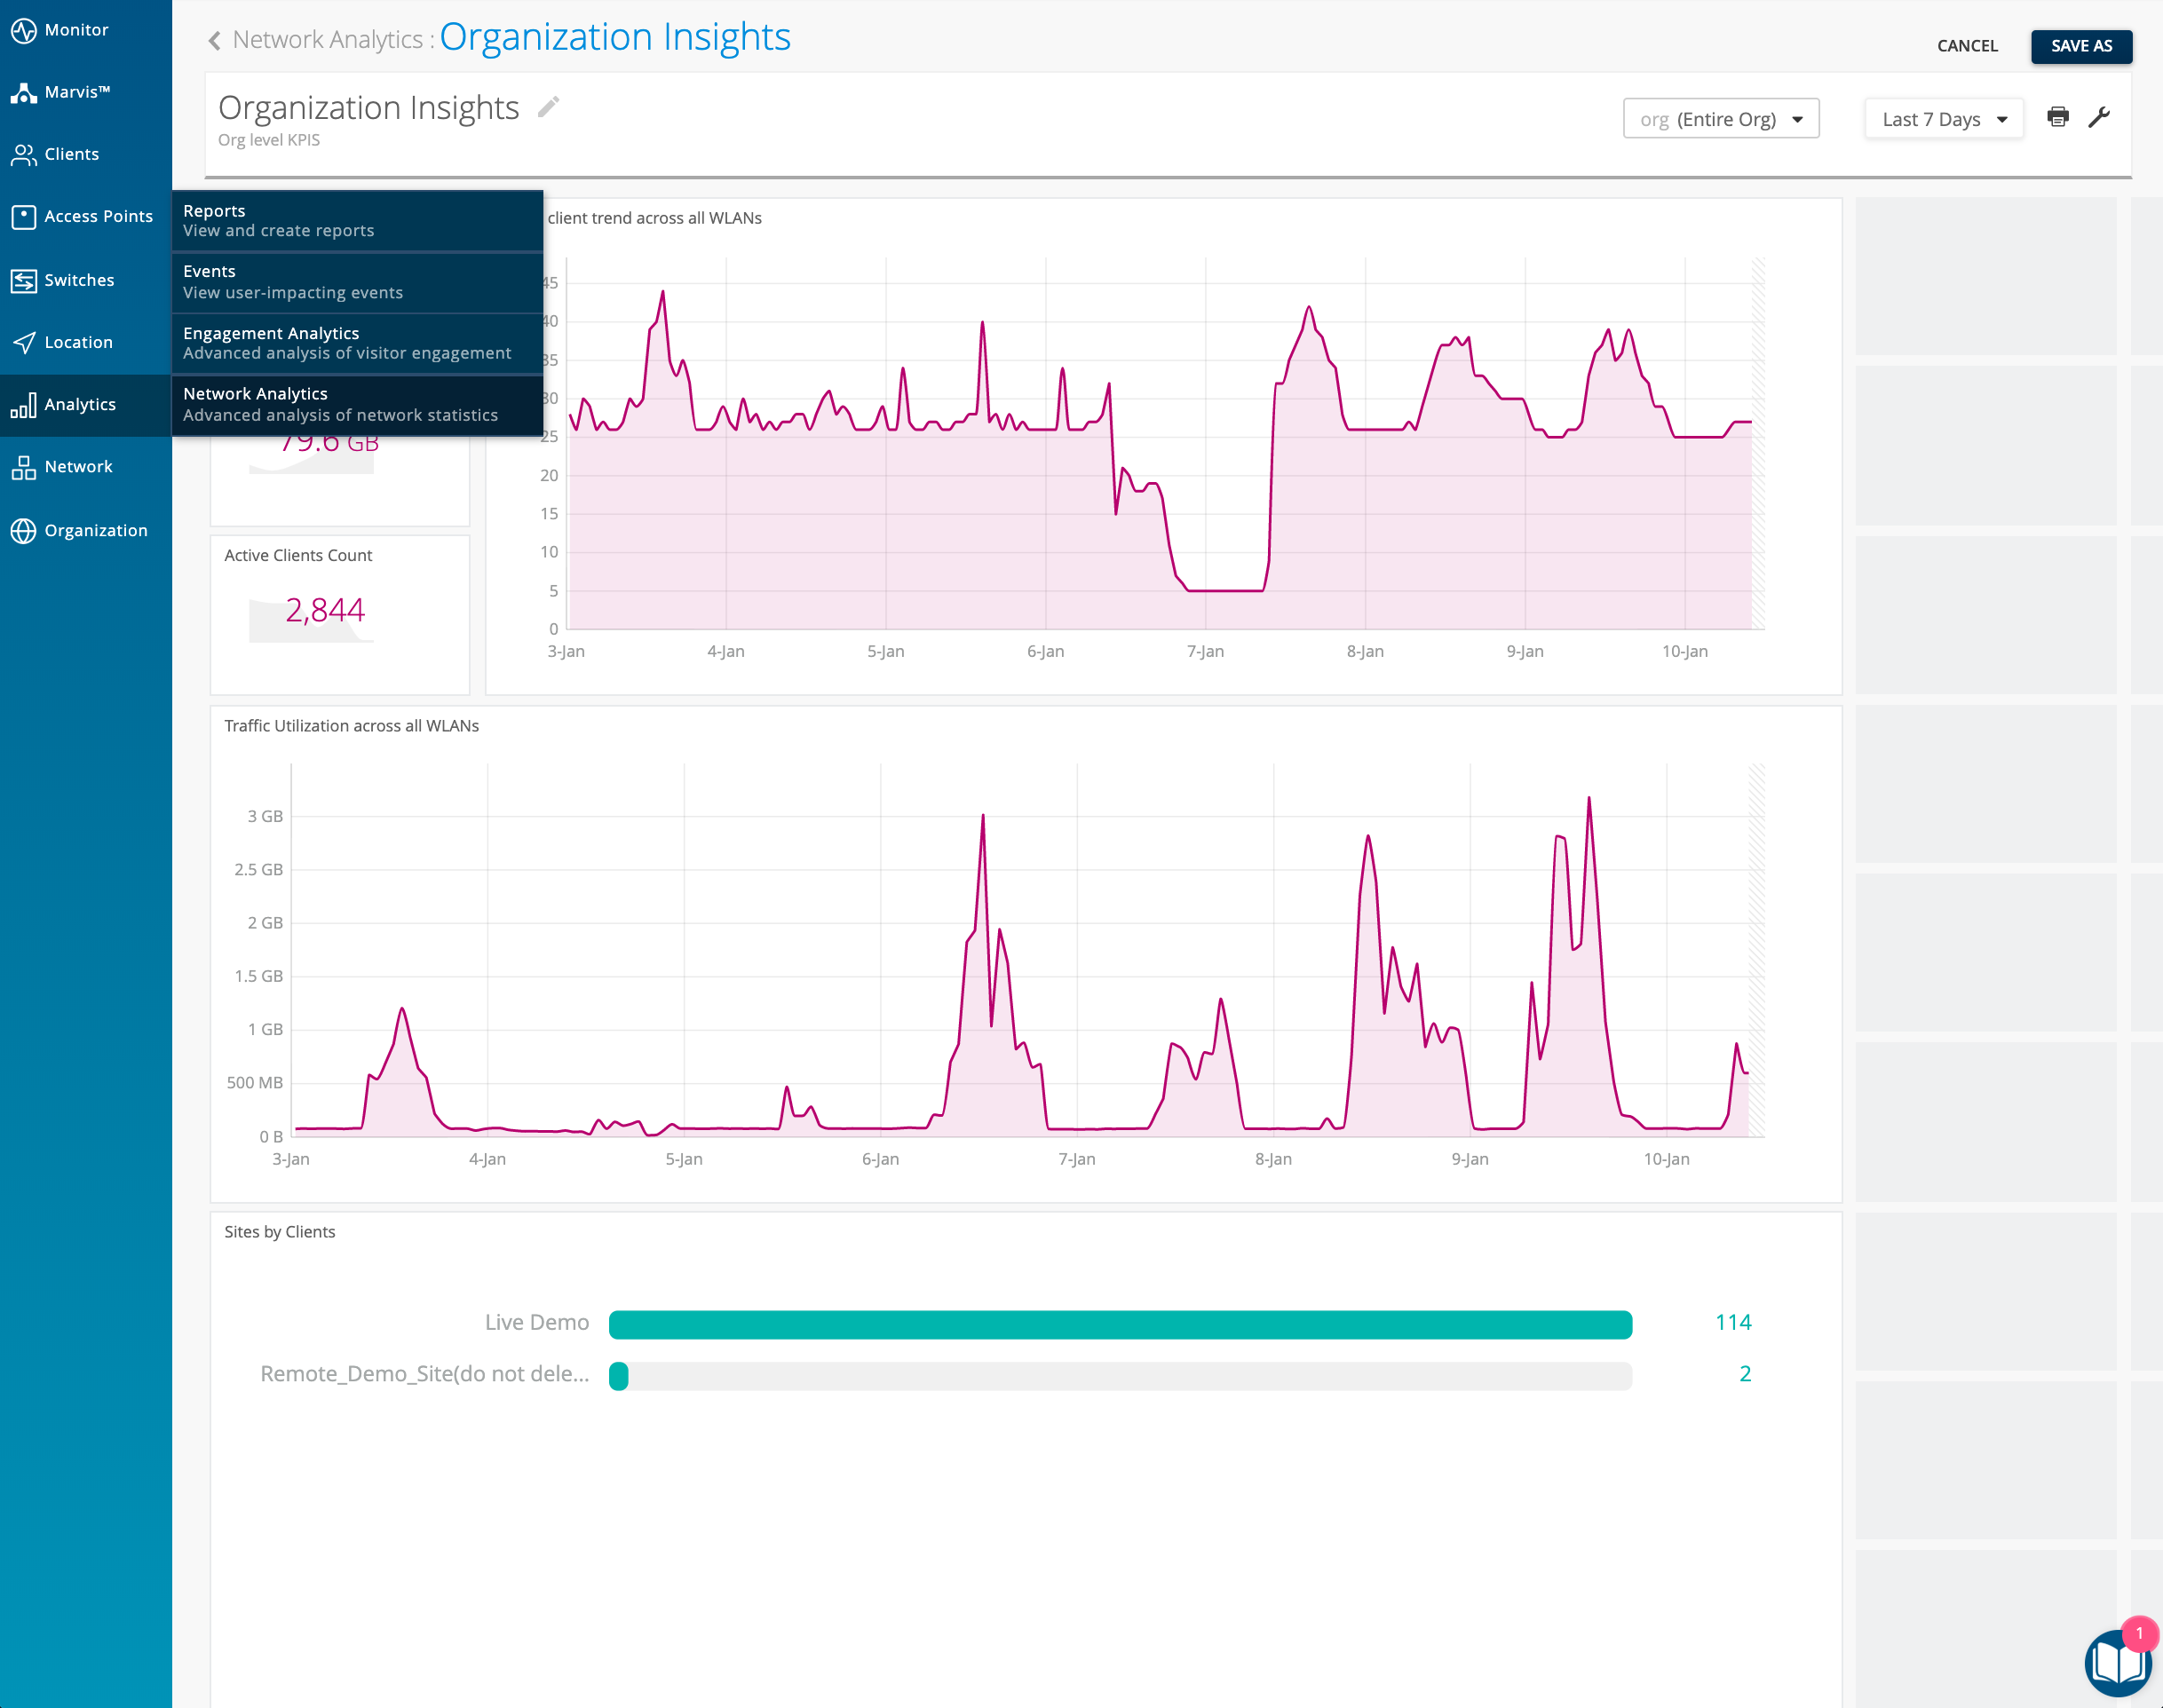
We are pleased to announce that the Network and Engagement Analytics pages are now available for all users! Use these analytics pages to monitor detailed views of client activity and usage rate across all your sites. Customize your view with the most relevant data and resize each information box to your liking. The Engagement Analytics page focuses on client data like dwell time, visit trends, and wait time. The Network Analytics page focuses on site and Org activity such as measures (DHCP/DNS Latency, RSSI, SLE trend), entities (AP, Servers, WLANs), events (client, AP, RMM events), and more.
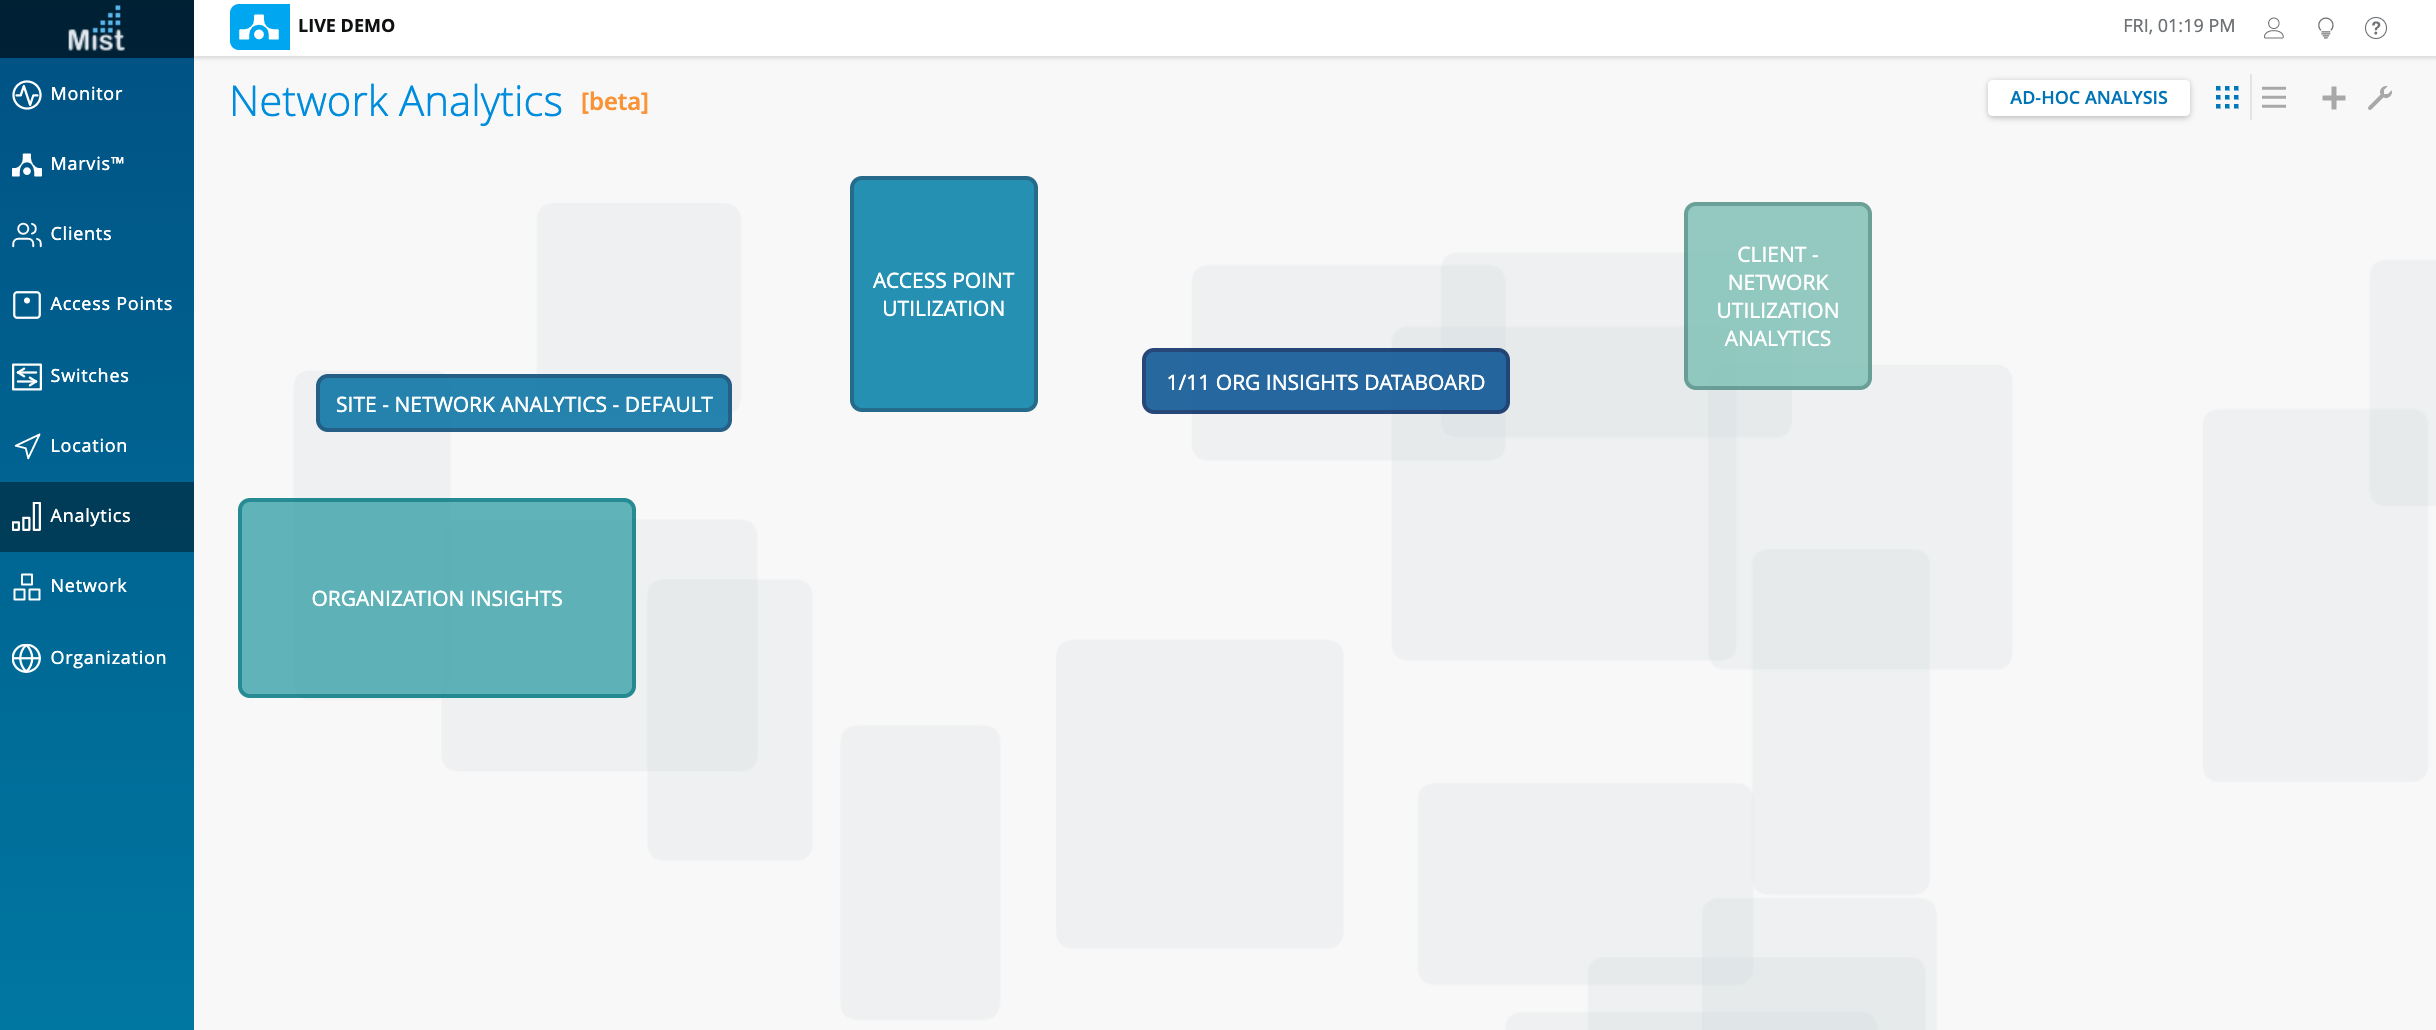
To access the analytics pages, navigate to the Analytics sidebar and select either Engagement Analytics or Network Analytics. Here, we have selected Network Analytics as a demonstration and you can see that some default cells are already set up. On this page, you can select any view from an organization level, all the way down to an individual client level.
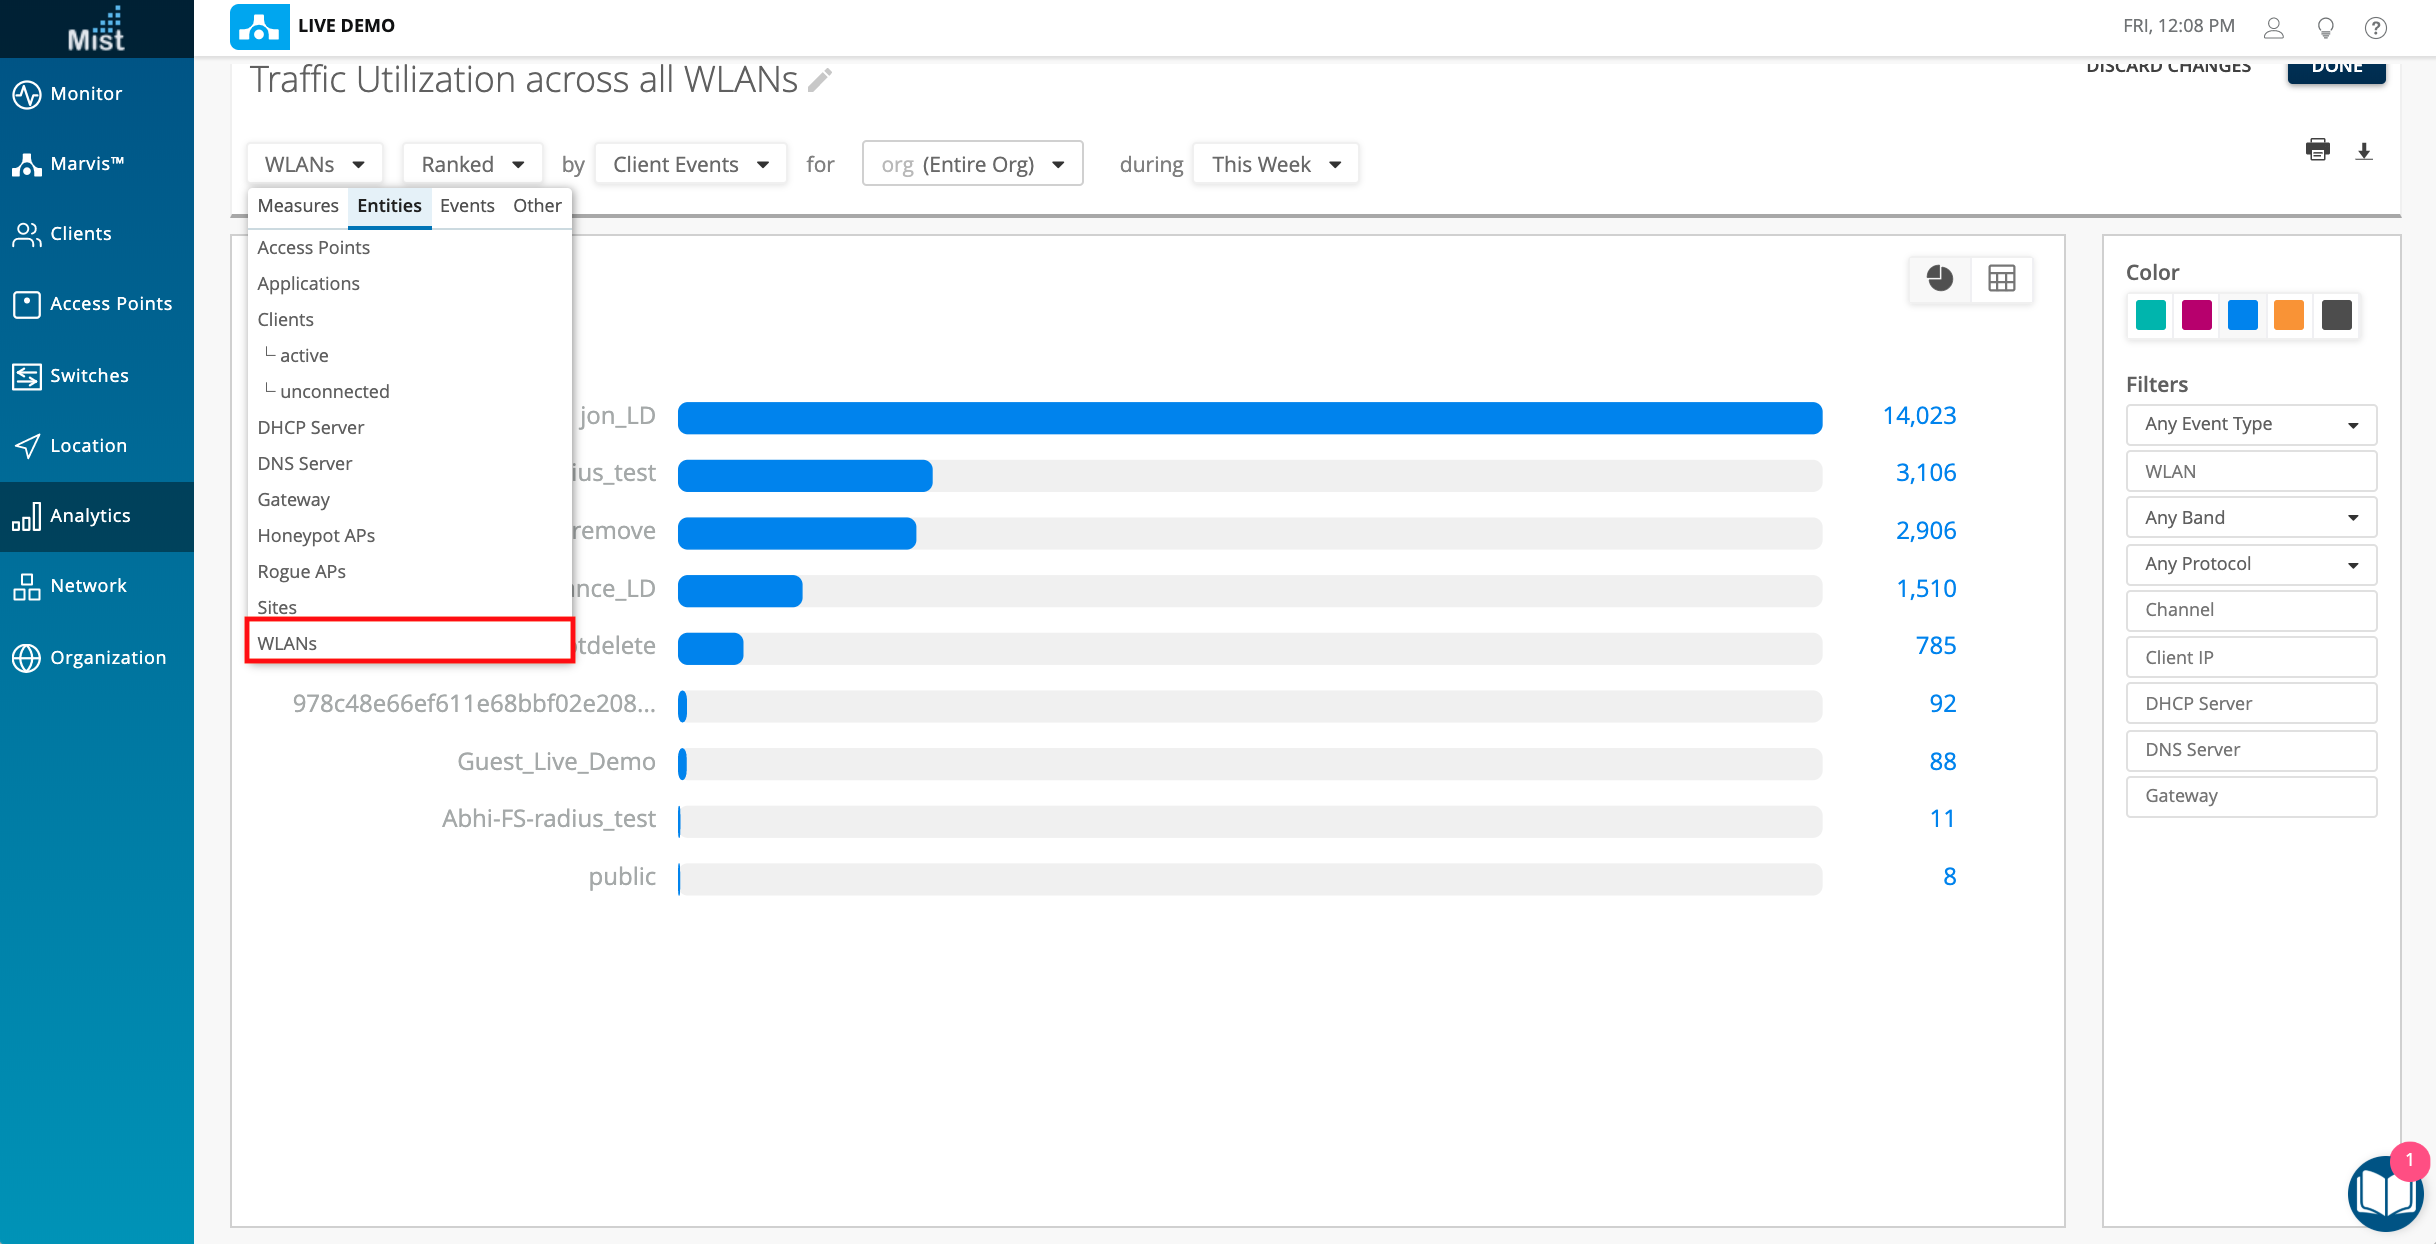
To edit an existing cell, click on the cell and customize the data to your liking.
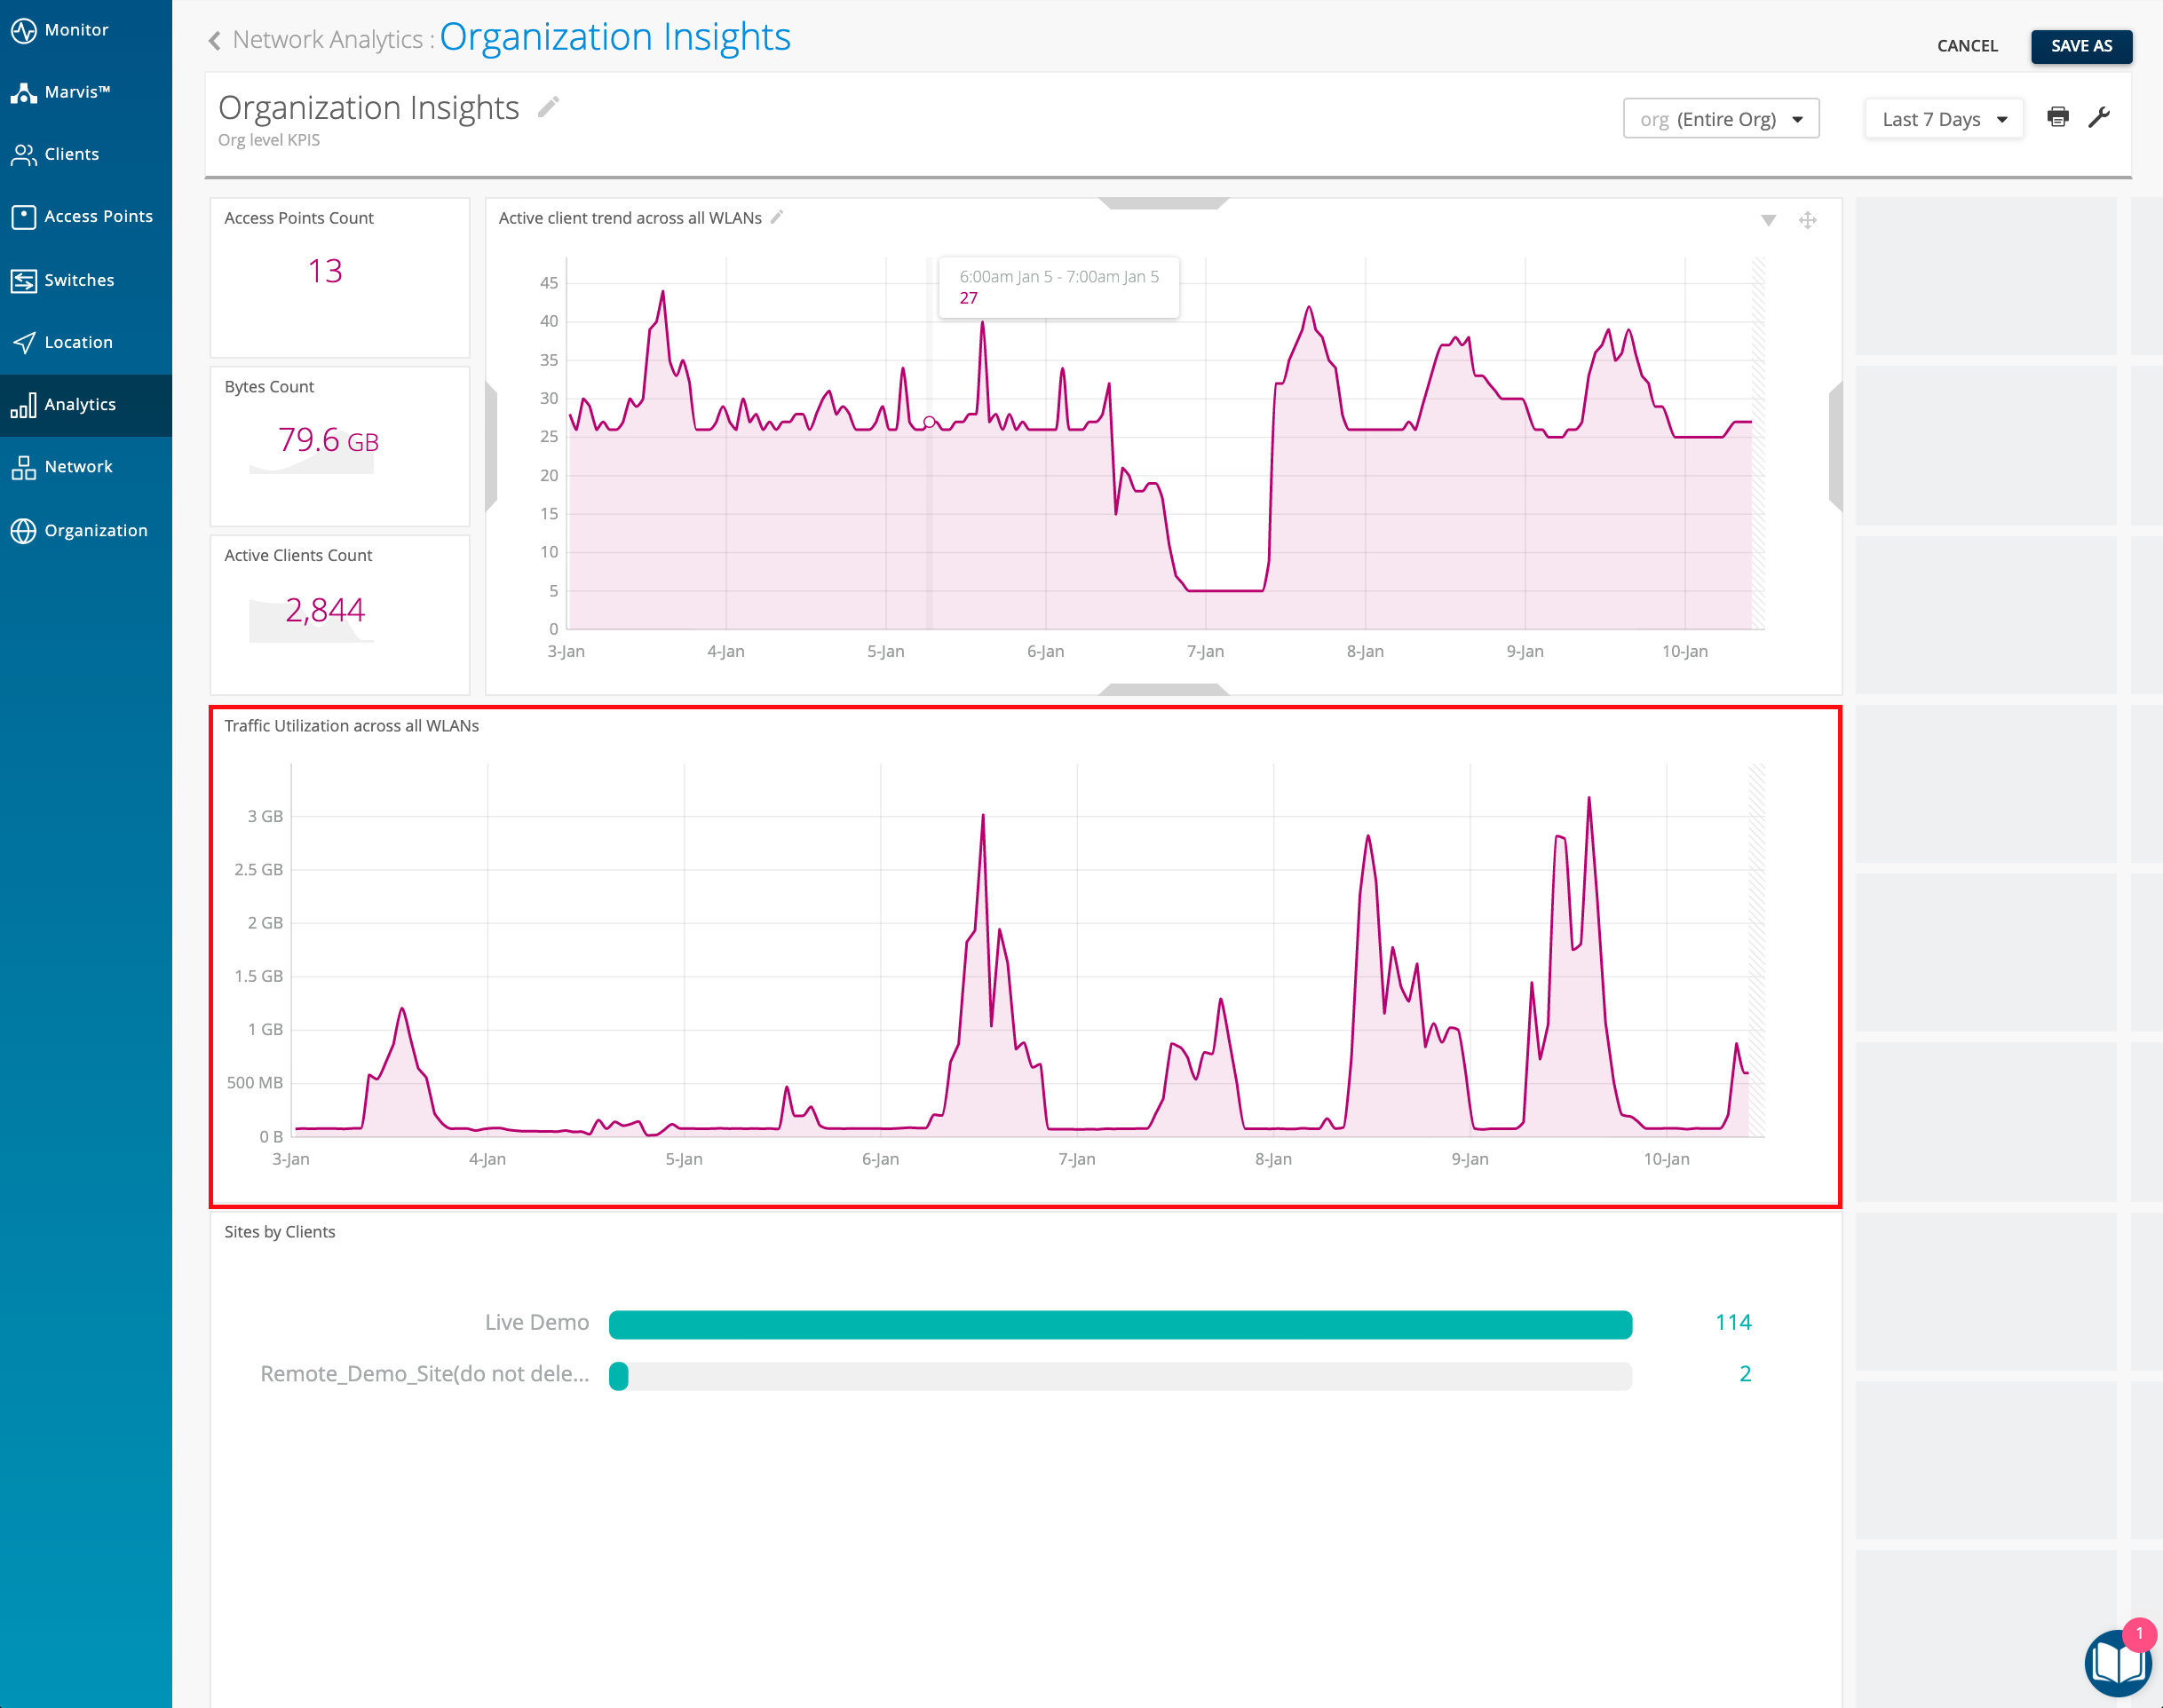
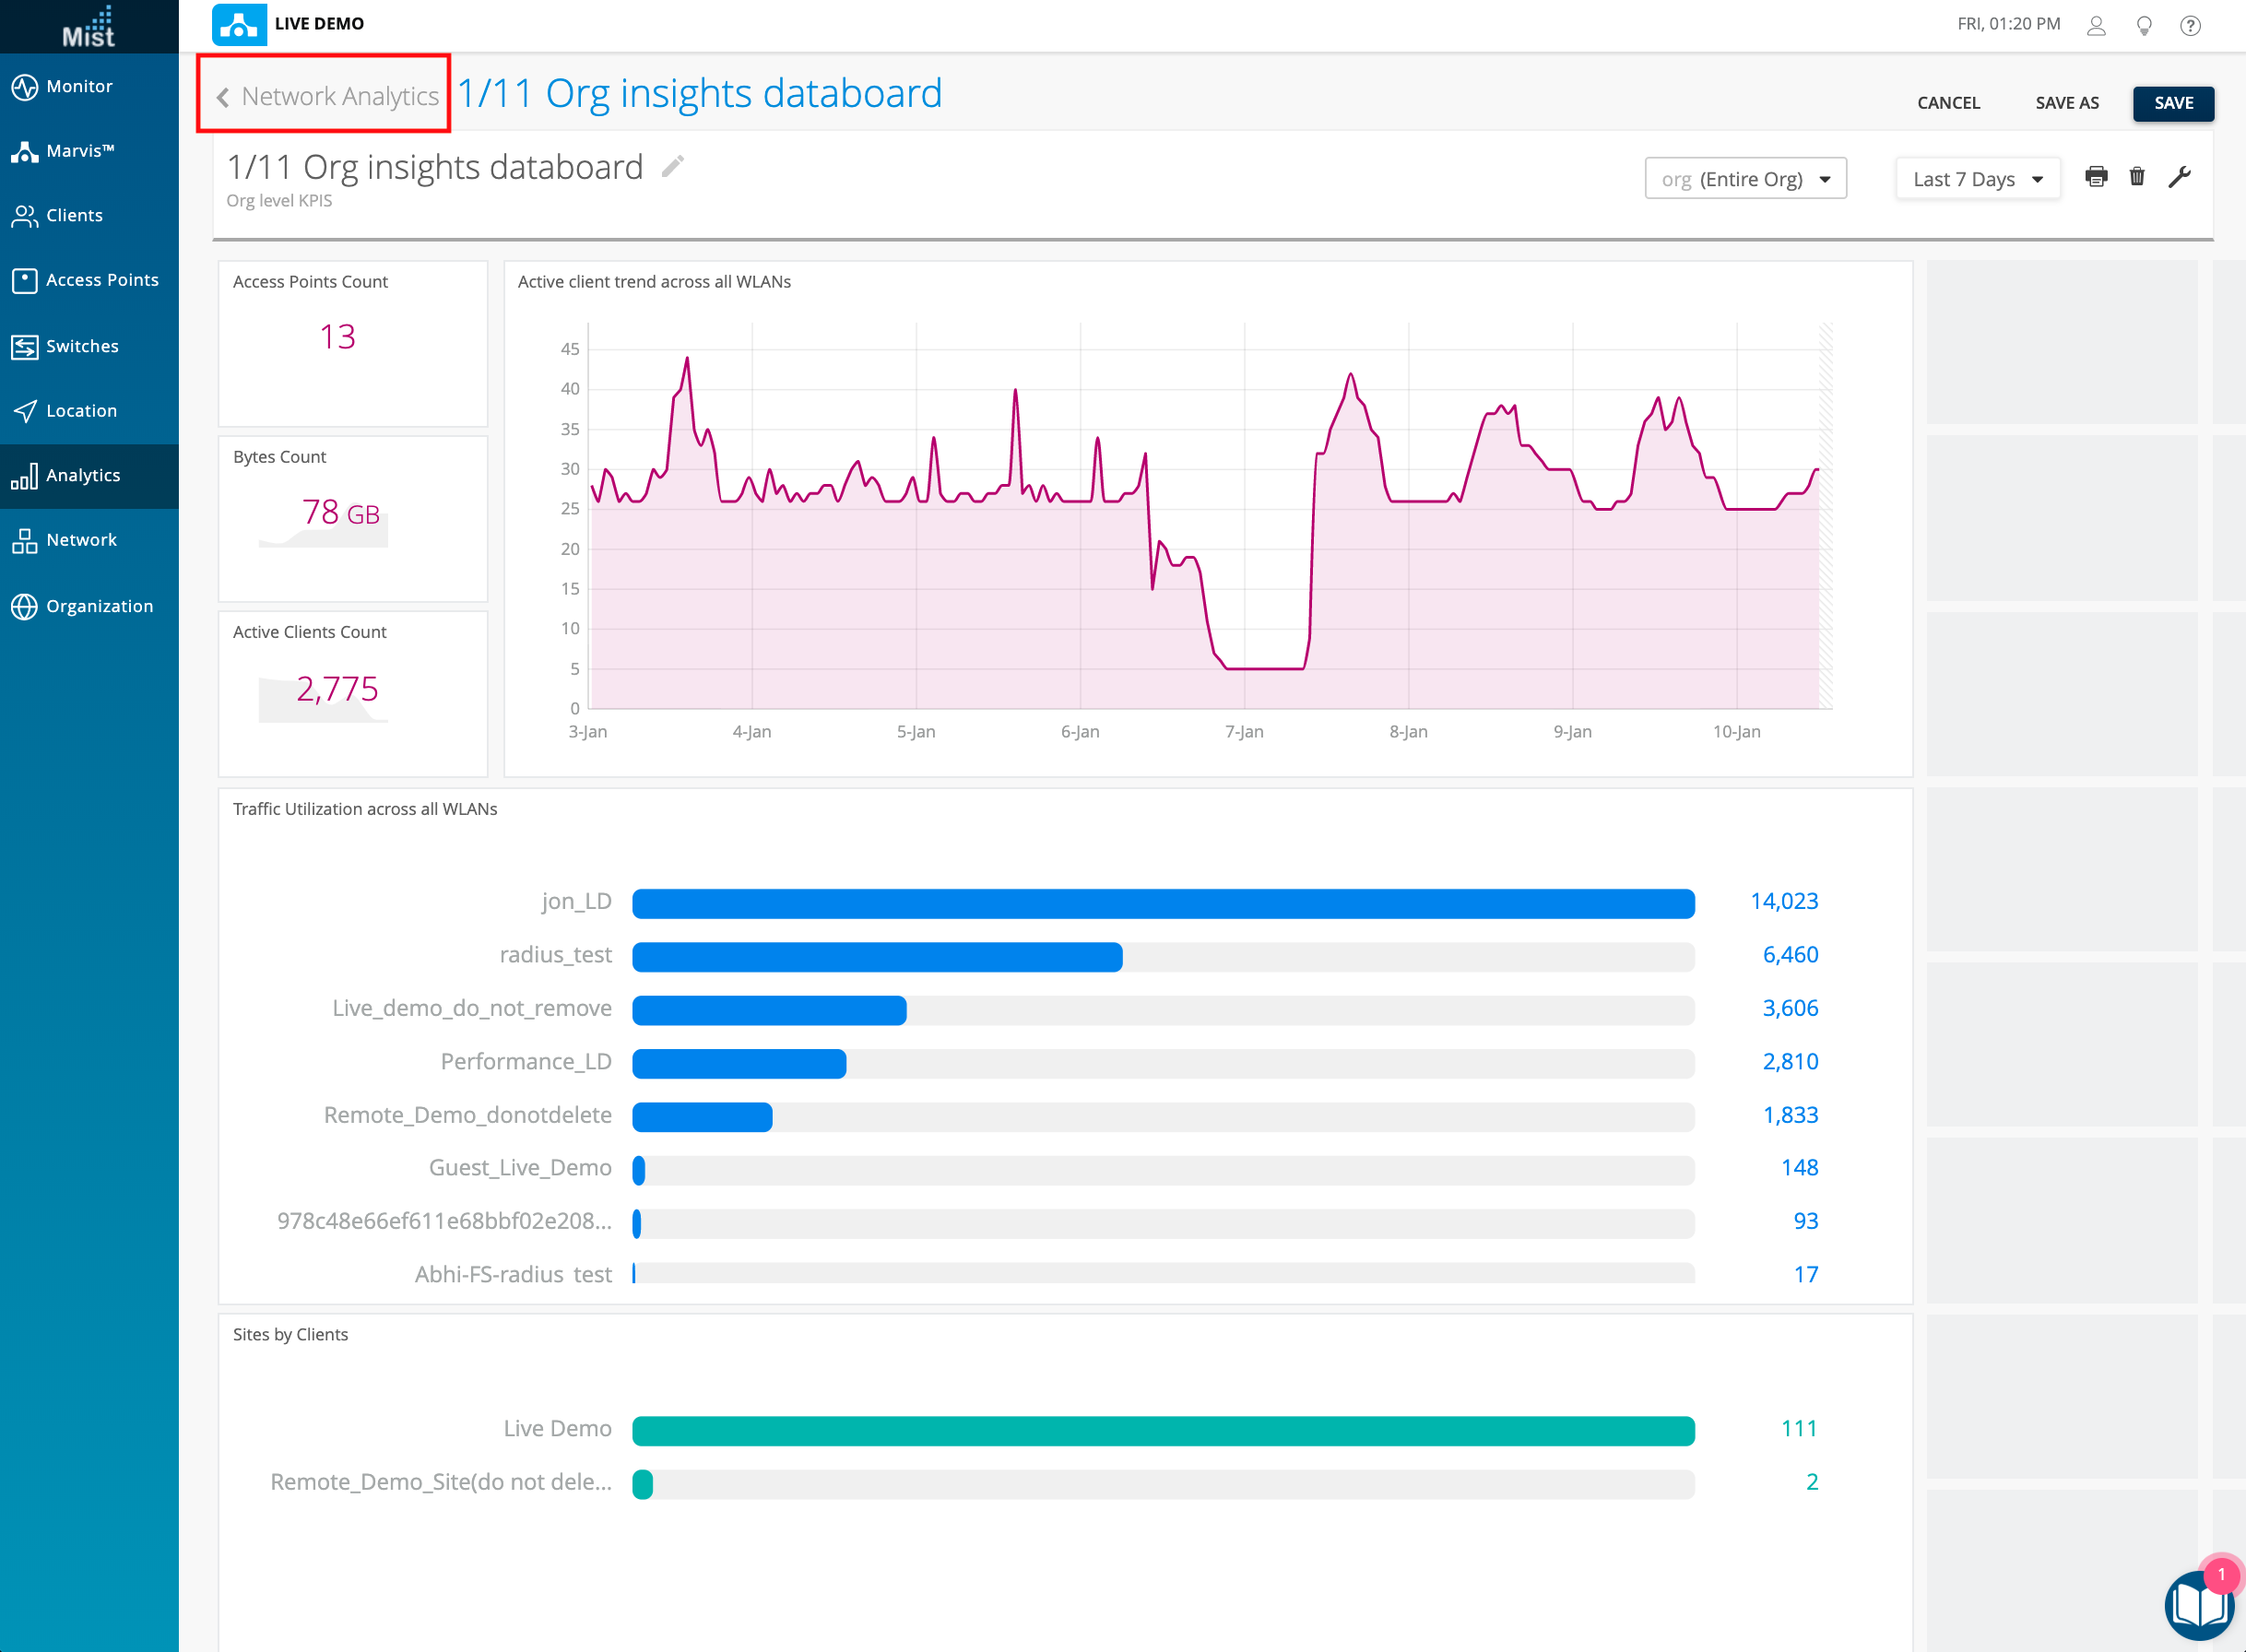
Here, we have changed this cell to display WLANs Ranked by Client Events for the Entire Org during This Week. Click on Done to save your changes.
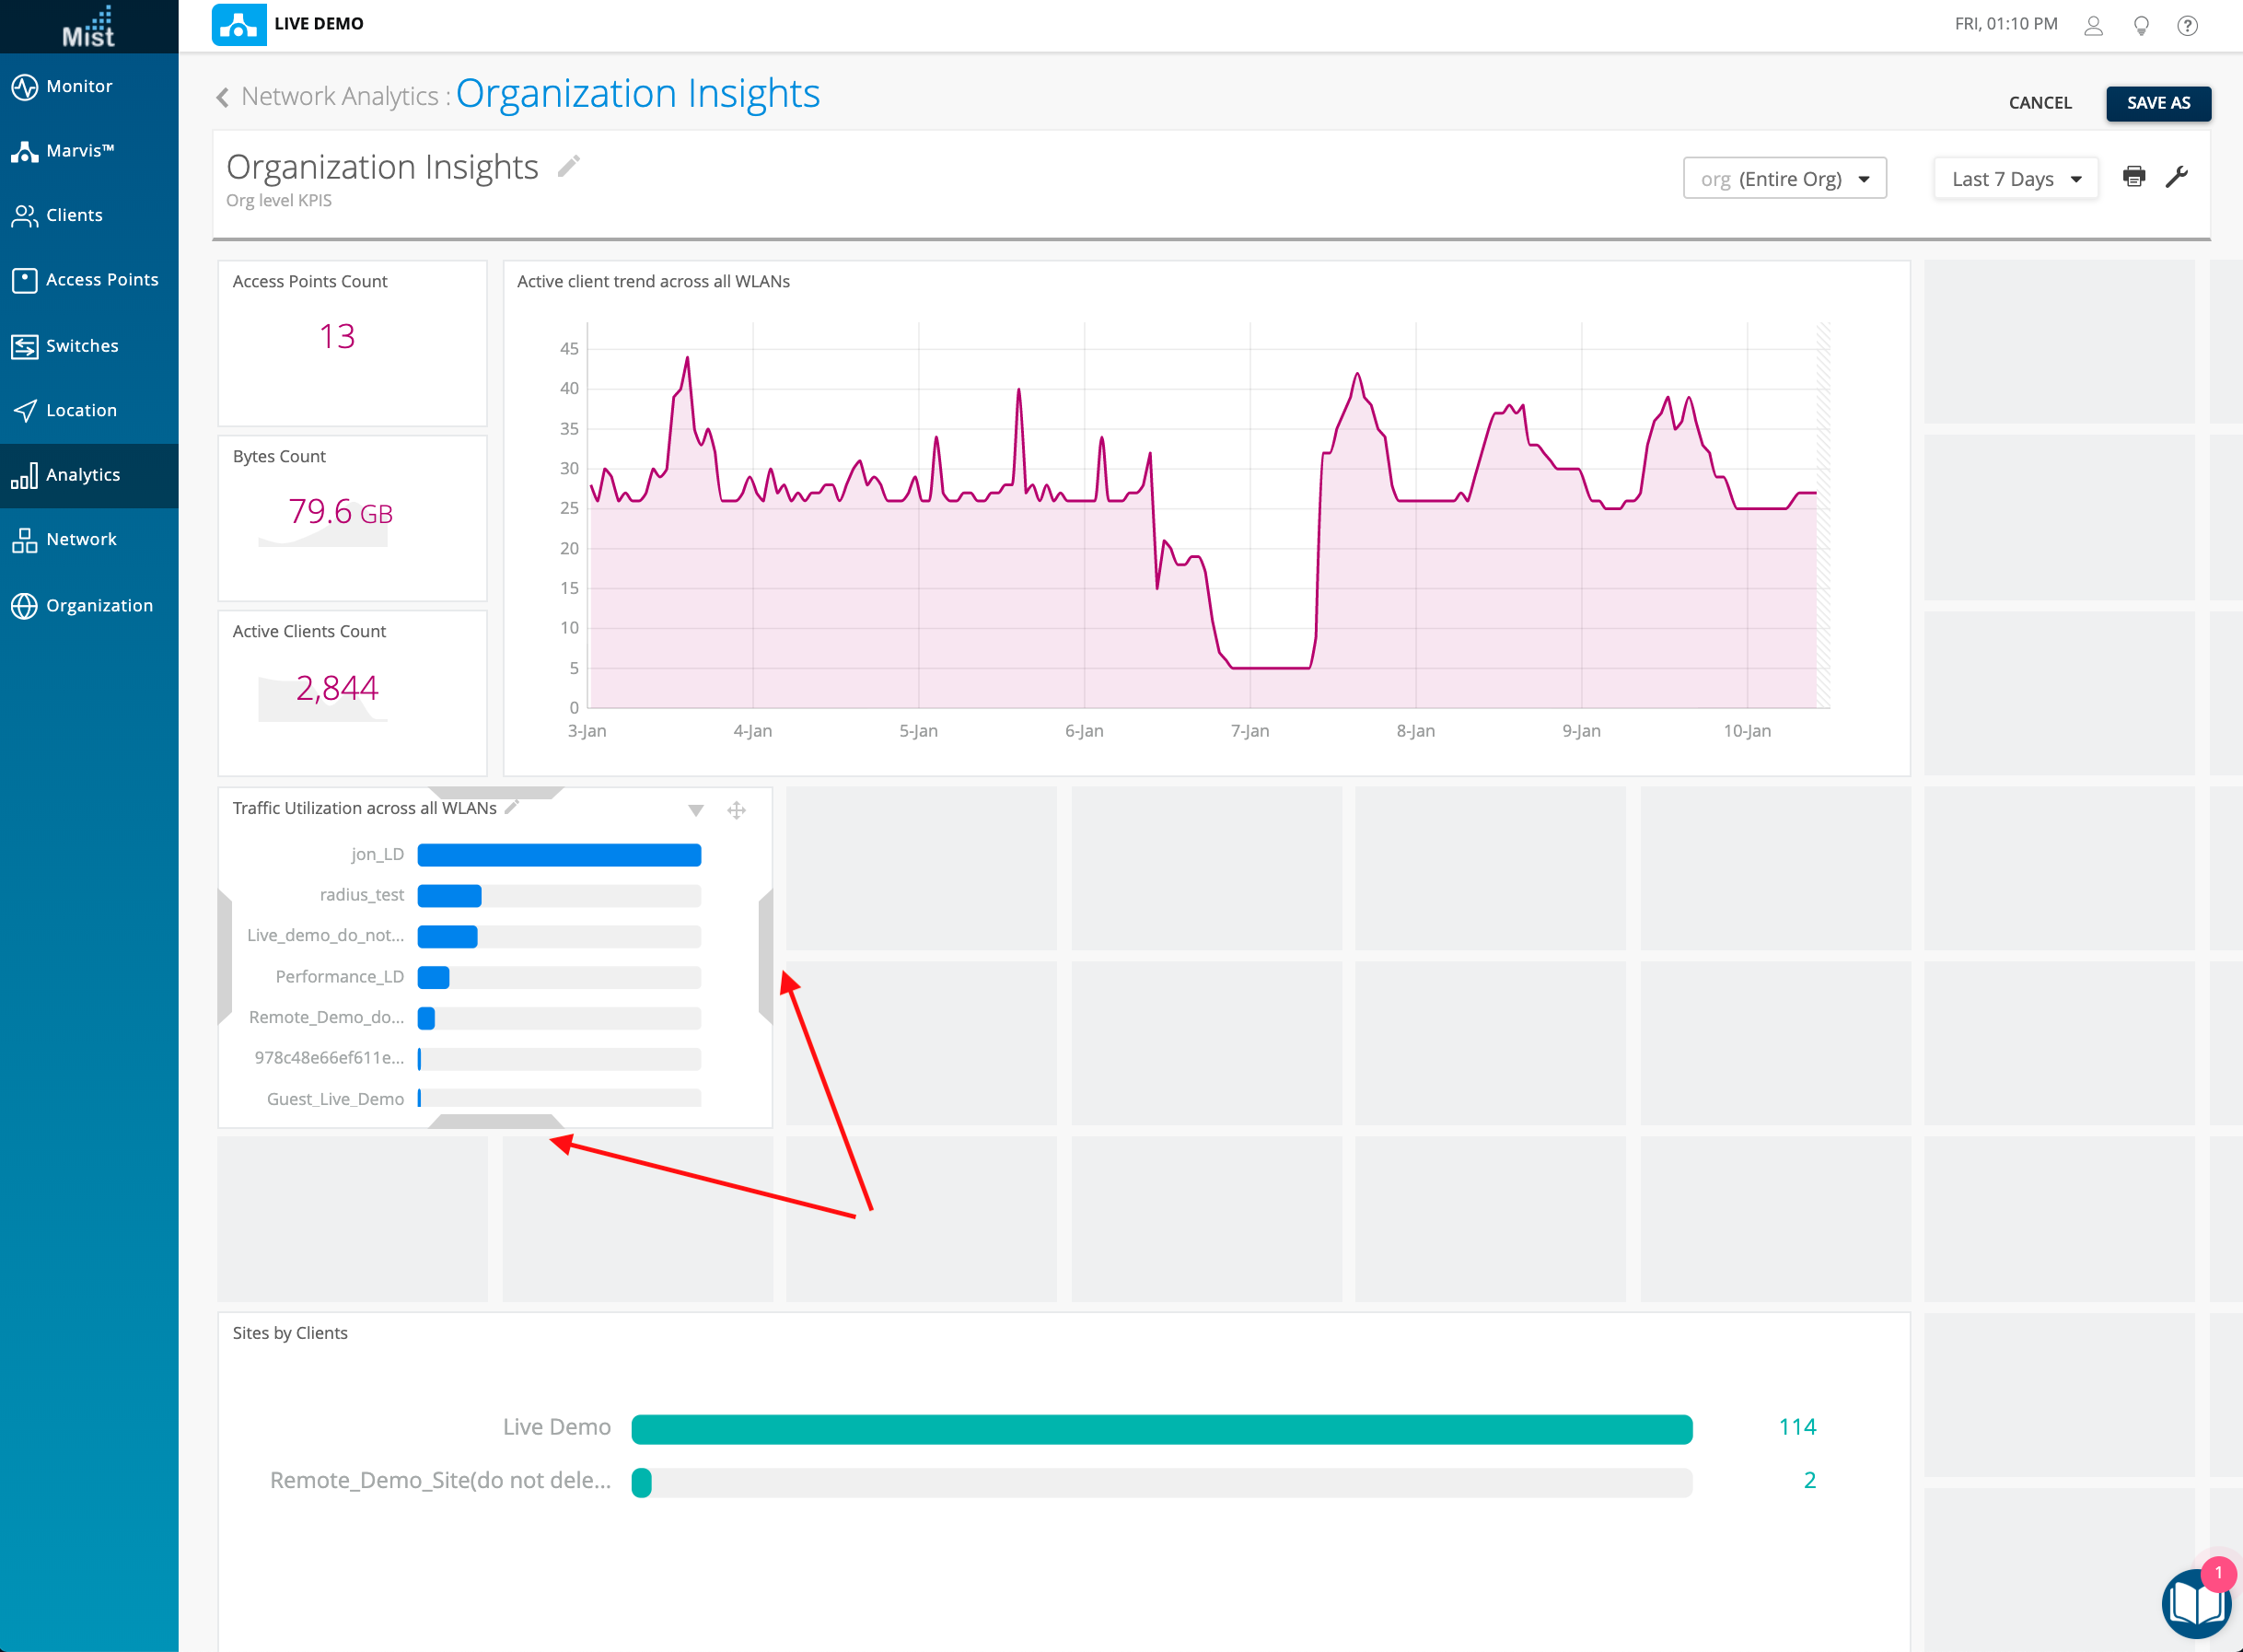
Once completed, you may drag on the sides of the cell box to enlarge decrease the size of the cell. And once you are satisfied with the databoard, select Save As.
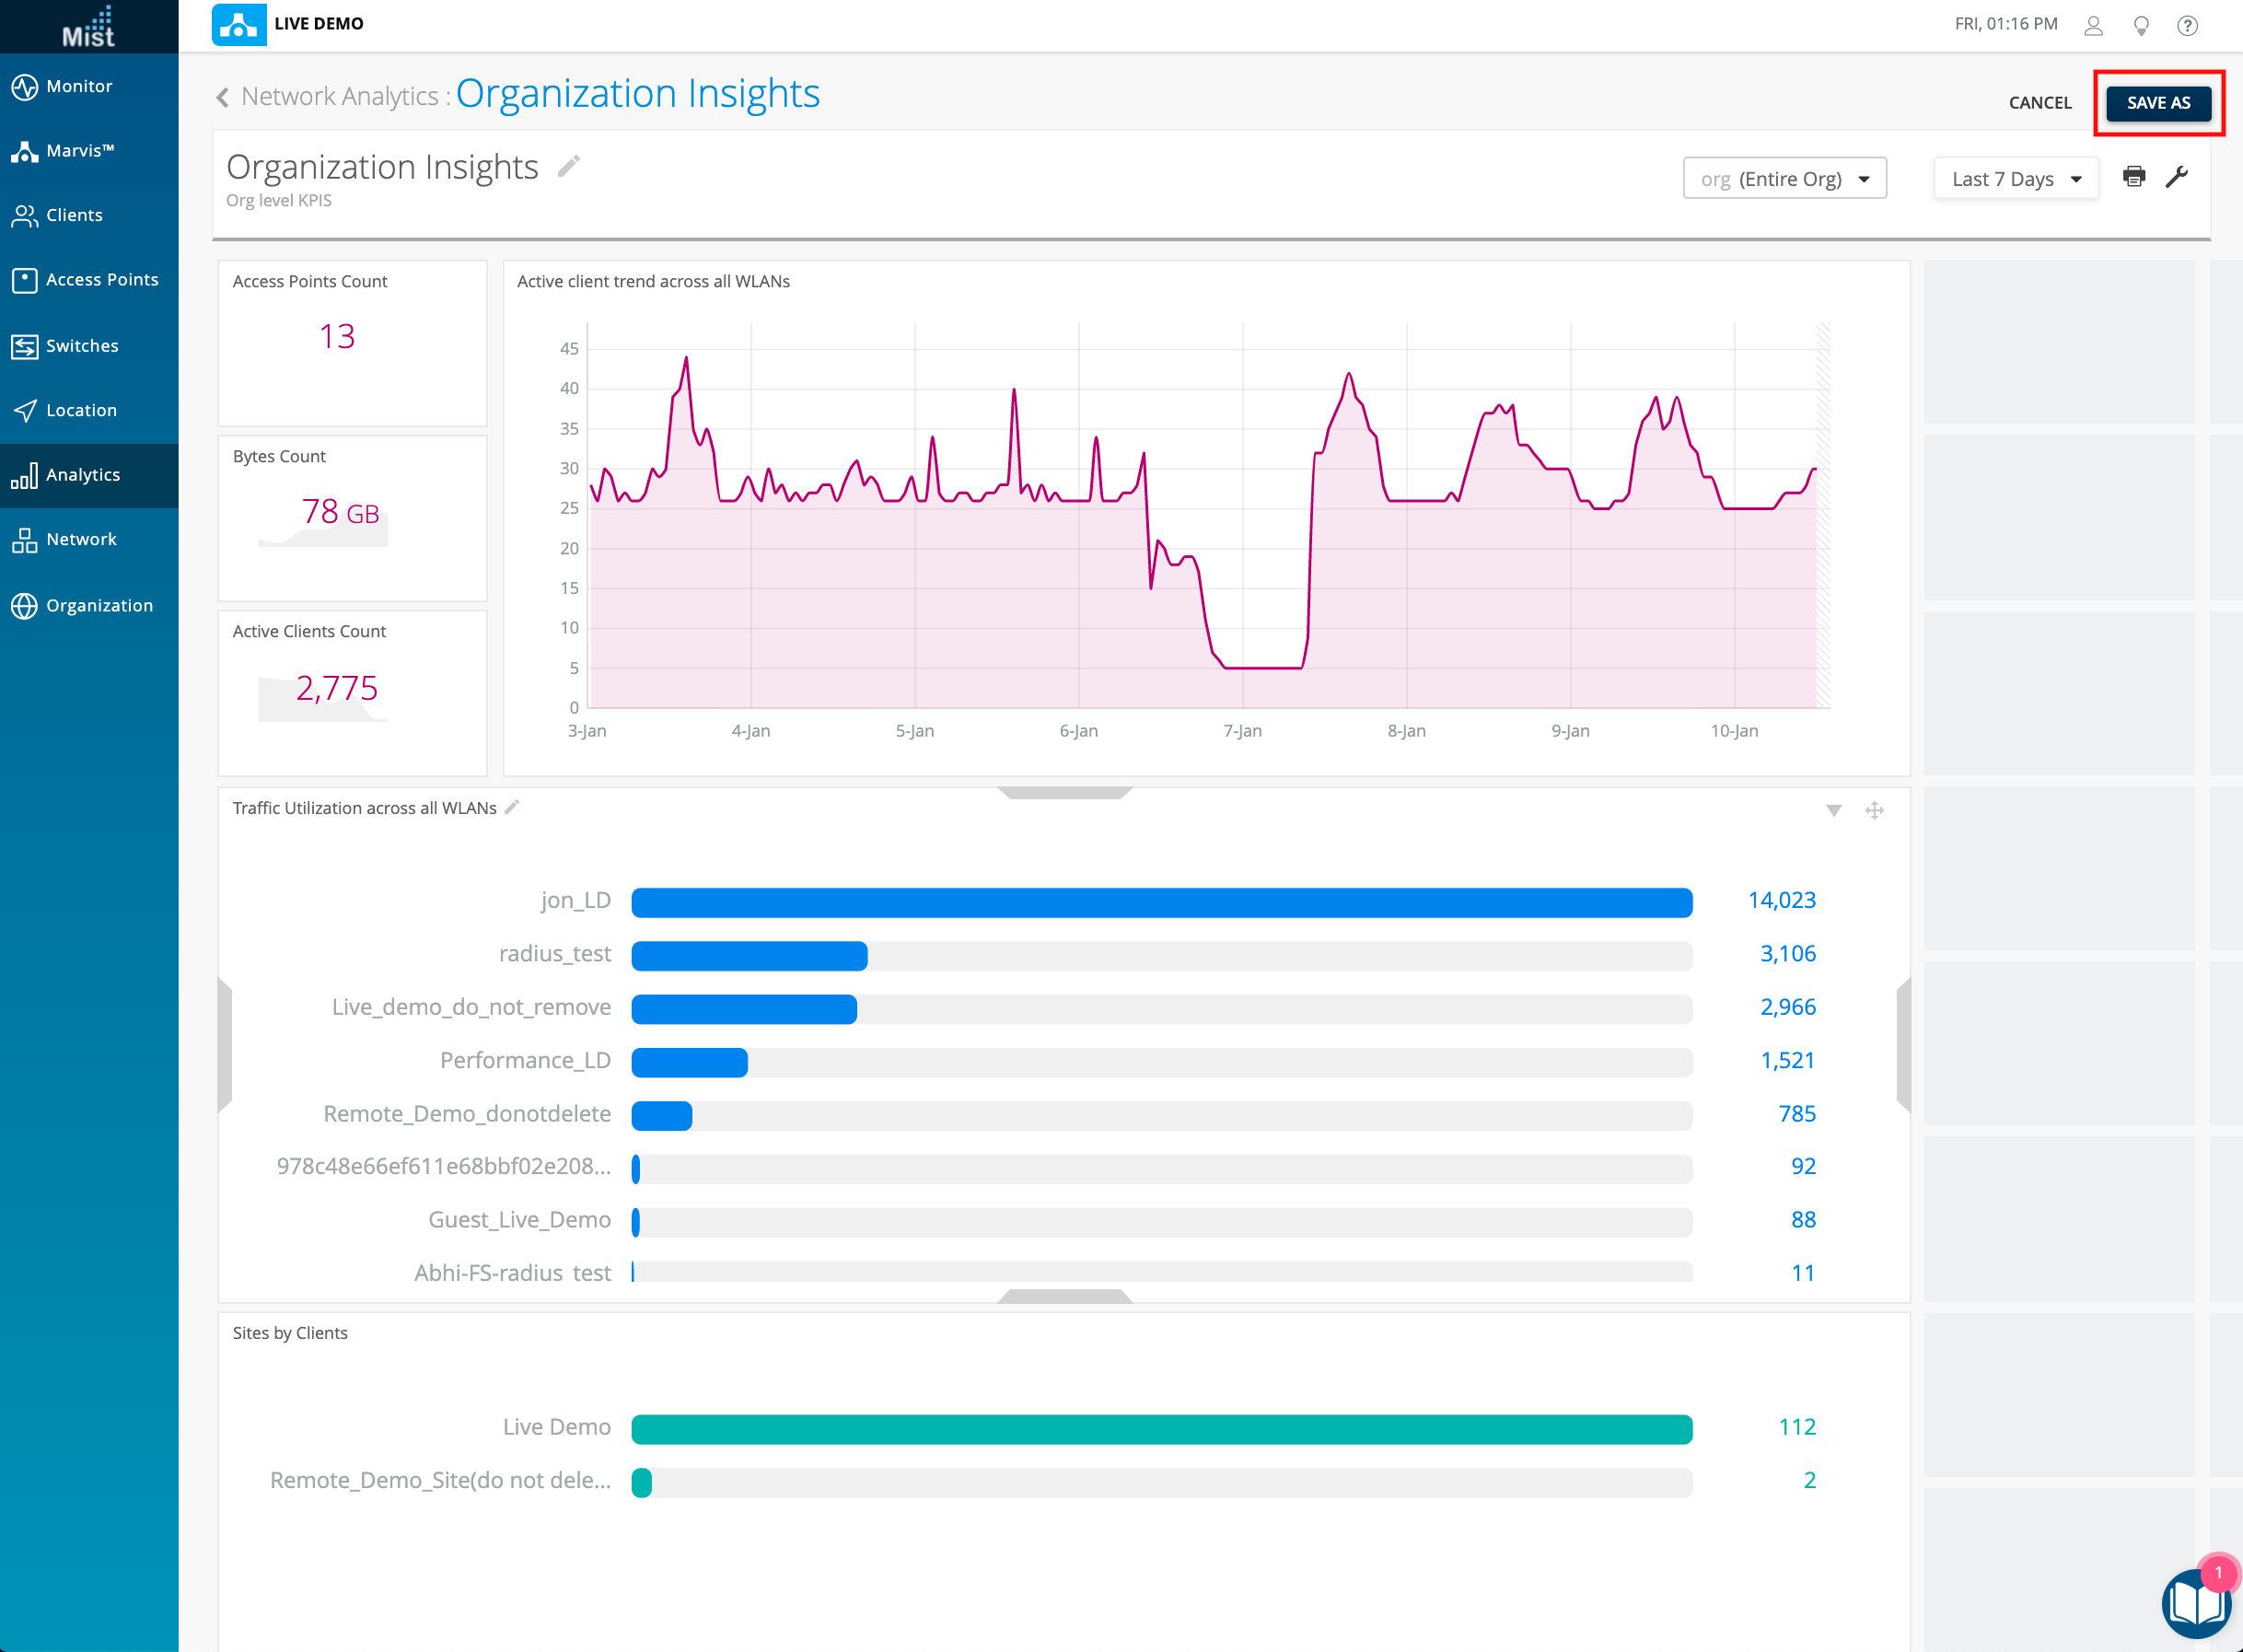
You may view all previously saved databoards by selecting Network Analytics while on the databoard page.